Báo cáo hóa học: " Research Article A Cascade of Boosted Generative and Discriminative Classifiers for Vehicle Detection" pptx
Bạn đang xem bản rút gọn của tài liệu. Xem và tải ngay bản đầy đủ của tài liệu tại đây (2.12 MB, 12 trang )
Hindawi Publishing Corporation
EURASIP Journal on Advances in Signal Processing
Volume 2008, Article ID 782432, 12 pages
doi:10.1155/2008/782432
Research Article
A Cascade of Boosted Generative and Discriminative
Classifiers for Vehicle Detection
Pablo Negri, Xavier Clady, Shehzad Muhammad Hanif, and Lionel Prevost
Institut des Syst
`
emes Intelligents et de Robotique, CNRS FRE 2507, Universit
´
e P ierre et Marie Curie-Paris 6,
3 Rue Galil
´
ee, 94200 Ivry sur Seine, France
Correspondence should be addressed to Lionel Prevost,
Received 1 October 2007; Revised 4 January 2008; Accepted 16 January 2008
Recommended by Hubert Cardot
We present an algorithm for the on-board vision vehicle detection problem using a cascade of boosted classifiers. Three families
of features are compared: the rectangular filters (Haar-like features), the histograms of oriented gradient (HoG), and their
combination (a concatenation of the two preceding features). A comparative study of the results of the generative (HoG features),
discriminative (Haar-like features) detectors, and of their fusion is presented. These results show that the fusion combines the
advantages of the other two detectors: generative classifiers eliminate “easily” negative examples in the early layers of the cascade,
while in the later layers, the discriminative classifiers generate a fine decision boundary removing the negative examples near the
vehicle model. The best algorithm achieves good performances on a test set containing some 500 vehicle images: the detection rate
is about 94% and the false-alarm rate per image is 0.0003.
Copyright © 2008 Pablo Negri et al. This is an open access article distributed under the Creative Commons Attribution License,
which permits unrestricted use, distribution, and reproduction in any medium, provided the original work is properly cited.
1. INTRODUCTION
The increasing number of cars has increased the demand of
driver assistance systems which makes driving more com-
fortable and safe [1]. Many researches have been conducted
by the intelligent transport systems (ITSs) community in this
field. It deals with the installation of high-tech devices and
other controllers on vehicles and road networks. Among
the systems to be integrated on intelligent vehicles, it is
necessary to distinguish those related to perception. They can
be either proprioceptive (to deal with the vehicle internal
state) or exteroceptive (to deal with the vehicle external
environment).
In this framework, many vision-based sensors are being
studied now. Indeed, an on-board vision system can provide
information about the localization and the size of other
vehicles in the environment, the road, the traffic signs, and
the other users of the road network.
This article deals with a monocular vision-based system.
We present an algorithm for on-board vehicle detection. We
have used a cascade of boosted classifiers quite similar to
the one proposed by Viola and Jones in 2001 [2]forface
detection. Here, two types of features are employed and
hence compared: the rectangular filters (Haar-like features)
and the histograms of oriented gradient (HoG). These two
features are frequently used in the domain of object detection
and recognition.
The originality of our work is (1) the use of generative
classifiers in association with HoG features, (2) the com-
parative study of discriminative classifiers (based on Haar-
like features) and generative (HoG) classifiers, and (3) the
concatenation of both features.
The paper is divided as follows. The following section
presents previous researches in vehicle detection with a
particular focus on boosted detector and most commonly
used feature set. Section 3 describes precisely the feature
spaces we studied. Weak learners used in the boosting process
are described in Section 4. Section 5 details several detection
architectures: respectively, a single stage detector and two
cascade (multistages) detectors. Various experimental results
for these three detectors, obtained on images taken by an
on-board camera, are presented and analyzed in Section 6.
The last section is devoted to conclusions on the particular
behavior of generative/discriminative features and their
fusion. Some prospects are also presented.
2 EURASIP Journal on Advances in Signal Processing
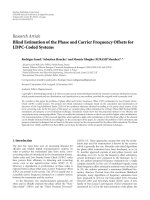
Feature space for discriminative classifier
(a)
Featurespaceforgenerativeclassifier
(b)
Figure 1: Feature space 2D.
2. PREVIOUS WORKS
A trivial solution for vehicle detection is the exhaustive
search at all potential positions in the image. Of course,
this solution is not satisfactory for real-time applications.
To solve this problem, most of the methods reported in
the literature follow an attentional process which can be
decomposed into two steps [3] as follows.
(i) Hypotheses generation: the system provides potential
positions of vehicles in a simple and rapid way
resulting in a reduced search area.
(ii) Hypotheses validation: hypotheses generated in the
earlier step are verified by using some complex algo-
rithms and false alarms are eliminated.
Hypotheses generation is based on simple, low-level algo-
rithms which estimate potential vehicle locations. They can
be classified in three categories: knowledge-based (symmetry
[4], color [5, 6], shadows [7], edges [8], corners [9], texture
[10]), stereo-based (disparity map [11], inverse perspective
mapping [12]), and motion-based [13].
The different approaches used for hypotheses validation
are either model-based or appearance-based.
The first methods use a predefined template of the vehicle
class and perform a correlation between the template and
the input image for validation. Templates can be either rigid
[14, 15] (horizontal or vertical contours [16]) or deformable
[17–19].
Appearance-based methods learn the vehicle class char-
acteristics from a set of images. Each training image is
represented by a [20] feature vector. Then a classifier (neural
network, support vector machine, Bayesian, etc.) is trained
to estimate the decision boundary between the vehicle class
and the nonvehicle class.
In addition to these methods, Viola and Jones [2]
proposed an original attentional scheme for detection. The
approach consists in a cascade of boosted classifiers with
increasing complexity: each layer in the cascade reduces
the search zone while rejecting regions that do not contain
any object. This method uses Haar-like features, also called
rectangular filters (experimented by Papageorgiou et al.
[21, 22]), and Adaboost learning [23]. The latter permits to
select a limited number of features in each layer. In reality,
Adaboost does not select the best features but the associated
weak classifiers (cf. Section 4).Theuseofanintegralimageto
calculate Haar-like features and the cascade approach results
in a real-time face-detection application.
This approach has inspired a lot of recent works in vehicle
detection. They propose some improvements about the used
features [3, 24, 25], their selection process [24, 25], the
boosting algorithm (RealBoost [26], GentleBoost [27]), and
the cascade architecture [27].
In this work, two types of features are employed and
hence compared: rectangular filters (Haar-like features or
Haar features) and HoG. These two features are frequently
used in the domain of object detection and recognition.
Haar-like features were introduced by [21, 22]for
pedestrian and vehicle detection. They are derived from
the wavelet decomposition (using Haar wavelets). The filter
set was enhanced by different works [2, 28], and does not
comply strictly with the wavelet theory. Thus, they are called
rectangular filters or Haar-like filters.
The histogram of oriented gradients is a histogram of
neighbourhood pixels according to their gradient orientation
and weighted by their gradient magnitude. Recently [29–31],
HoG are used in a feature set called scale invariant feature
transform(SIFT) [32], which are employed successfully
for pedestrian detection. In [29], the authors regrouped
SIFT computed on a window and used a linear SVM for
classification.
In [31], they used SIFT instead of Haar-like features in
Viola and Jones detector. Linear SVM acting as weak learners
are used in the cascade.
As we can see, in all previous approaches, HoG are used
with discriminative classifiers. In this paper, we propose
to associate generative classifiers with HoG features and to
concatenate generative and discriminative features. Some
papers have already proposed to concatenate two different
Pablo Negri et al. 3
−1
1
−11
1
−2
1
1
−21
Figure 2: Set of Haar-like features.
features: Haar+HoG [30] or Haar+Gabor [33], but they only
employ discriminative classifiers.
3. FEATURE SPACE
Positive examples (windows with vehicle) and negative
examples (windows without vehicle) are distributed in an N
dimensional space depending on the features used to extract
information. In the initial space (pixel grey-levels), classes
may be overlapped. While choosing a good representation
space and an adequate classifier, we can separate them.
In our work, two types of features have been evaluated:
Haar-like features and HoG. The former feature set defines
a discriminative model of vehicles which separates the
two classes by a decision boundary (hyper plane). The
test examples will be categorised by their position in the
feature space with respect to this hyperplane. The vehicle
model estimated with the histograms of oriented gradients
is generative. A class model is established from the training
database, and the test examples are compared to the model
and are categorised by using their dissimilarity. Now, we
describe the adopted feature spaces for vehicle detection.
3.1. Rectangular filters or Haar-like features
Rectangular filters or Haar-like features provide information
about the grey-level distribution of two adjacent regions in
an image.
Figure 2 shows the set of Haar filters used in our
algorithm. These filters consist of two or three rectangles.
To compute the output of a filter on a certain region of
image, the sum of all pixels values in the grey region is
subtracted from the sum of all pixels values in the white one
(and normalized by a coefficient in case of a filter with three
rectangles).
Viola and Jones [2] introduced the integral image which
is an intermediate representation of an input image and
reduces the computation time for the filters. Sum of the
rectangular regions can be calculated by using only four
references in the integral image. As a result, the difference of
two adjacent rectangular regions can be computed by using
only six references in the integral image. For a filter with three
rectangular regions, only eight references are needed. At the
same time, integral image allows to perform fast variance
normalization, necessary to reduce the effect of different
lighting conditions.
Figure 3 illustrates the filtering of an image using two
types of rectangular filters on two different scales: 1
× 2
and 2
× 4 pixels. These pictures show that the chosen filters
emphasize the horizontal and vertical edges in the image. We
−11
1
2
2
4
Original image
Filter 1 Filter 2
10 20 30
25
20
15
10
5
10 20 30
20
15
10
5
10 20 30
20
15
10
5
10 20
25
20
15
10
5
Figure 3: Original image and different image windows obtained by
applying the vertical and horizontal Haar filters.
can also observe that when the filter size is doubled, details in
the image are filtered while conserving the most important
edges.
Every feature j is defined as f
j
(x
j
, y
j
, s
j
, r
j
), where r
j
is
the type of rectangular filter (see Figure 2), s
j
is the scale, and
(x
j
, y
j
) is its position in the window. Five scales are used for
the two rectangles filters: 1
× 2, 2 × 4, 4 × 8, 8 × 16, 16 × 32
(similar scales are used for the three rectangles filters).
The Haar feature space is defined by a vector containing
8151 features for a window size of 32
× 32 pixels.
3.2. Histogram of oriented gradient
The other feature space used in this work is HoG. This local
feature uses gradient magnitude and orientation around a
point of interest or in a region of the image to construct
the histograms. To calculate the input image (grey-level)
gradient, we apply a Sobel filter of size 3
× 3. The orientation
of pixels is then quantized to integer values between 0 and
N
− 1(hereN = 4) using modulo π instead of modulo 2π.
Each histogram is computed as follows:
(i) all the pixels of the rectangular region are traversed;
(ii) for each pixel with gradient orientation o, the value of
the corresponding bin is incremented by the gradient
magnitude at the pixel (the number of quantized
histogram bins is N);
(iii) once all the pixels are evaluated, the bin values are
normalised to obtain their sum equals to 1.
The HoG feature space is defined by 3917 histograms
computed in a rectangular area of 32
× 32 pixels. Each
histogram j is defined as h
j
(x
j
, y
j
, s
j
, r
j
), where r
j
is the type
of rectangle, s
j
is the scale, and (x
j
, y
j
) is its position in the
window.
The types of rectangles depend on the width/height ratio
which can be (1
× 1), (1× 2), (2× 1). We h ave a total of fo ur
scales: s :
{2, 4, 8, 16}.
We observe from the examples of Figure 4 that the
majorityofthecontoursfoundinacertainregionare
horizontal (bin two of the histogram). The other region
4 EURASIP Journal on Advances in Signal Processing
contains the contours of all types but we can see a large
number of vertical contours.
We use an intermediate representation (integral his-
togram [34]) of the input image (inspired in the integral
image) which permits to rapidly compute the histograms.
We obtain, in the similar way as we obtain with the integral
image, a three-dimensional table (the third dimension
corresponds to orientation) which allows us to accumulate
gradient magnitude for a certain given orientation in a region
with the help of four references in the integral histogram. In
this way, the complete histogram can be built with 4
× N
references in the integral histogram.
4. AdaBOOST
The size of feature set is many times greater than the number
of pixels in the input image. Keeping in view the computation
time and robustness, the use of this much large set for
classification is not suitable because some features from
this set do not contain any useful information (noise). In
literature, different methods have been used for the selection
of useful and representative features: statistical methods
[35], principal component analysis [36], genetic algorithms
[37, 38], and so forth.
4.1. Discrete Adaboost
Among these methods, Adaboost algorithm [23] has shown
its capability to improve the performance of various classi-
fication and detection systems. It finds precise hypotheses
by combining several weak classification functions which, in
general, have moderate precision. Adaboost is an iterative
algorithm that finds, from a feature set, some weak but
discriminative classification functions and combines them in
a strong classification function:
G
=
⎧
⎪
⎪
⎨
⎪
⎪
⎩
1,
T
t=1
α
t
g
t
≥
1
2
T
t=1
α
t
= S,
0, otherwise,
(1)
where G and g are the strong and weak classification
functions, respectively, and α is a weight coefficient for each
g. S is the threshold of strong classifier G.
Different variants of boosting algorithm are developed:
discrete AdaBoost [2], real AdaBoost [39], gentle AdaBoost,
and so forth. However, we use the first one defined by
Pseudocode 1.
To use this algorithm, we have to define the weak classi-
fiers for two different types of features: Haar and HoG.
4.1.1. Weak classifier-Haar
We define the weak classifier for a feature j as a binary
response g
Haar
:
g
Haar
=
1, if p
j
f
j
<p
j
θ
j
,
0, otherwise,
(2)
where f
j
is the absolute value of the feature j and θ
j
is
the threshold, and p
j
is the parity. For each feature j,
AdaBoost determines an optimal threshold θ
j
for which the
classification error on training database (with positive and
negative examples) is minimised.
4.1.2. Weak classifier-HoG
In this case, we construct a generative classifier based on the
class (vehicle) model. The median of histograms of positive
examples from training database is used as our model,
defined as
m
j
= median
h
i
j
i=1, ,P
,(3)
where P is the number of positive examples in the training
database.
The generative classifier computes the distance between a
histogram h
j
of the input image and a model histogram m
j
.
We defined the weak classifier g
HoG
as follows
g
HoG
=
1, if d
h
j
, m
j
<θ
j
,
0, otherwise,
(4)
where d(h
j
(x),m
j
) is the Bhattacharya distance between the
histogram h
j
and model histogram m
j
,andθ
j
is the optimal
threshold on the distance for this feature.
Bhattacharya distance is defined as
d
h
j
, m
j
=
1 − h
j
•m
j
,(5)
where [
•] is the scalar product.
The distance is a similarity measure between two his-
tograms, that is, values close to 0 for similar histograms. The
output values are bounded between 0 and 1.
5. IMPLEMENTATION
In this section, we describe the image database used for the
training and for the test. Later, we present our implementa-
tion.
5.1. Database
The database used for experimentation contains more than
557 images of one or more rear viewed vehicles, resulting in
more than 1500 vehicle images of typical cars, sport-utility
vehicles (SUVs), and minivans. The dataset was labelled
manually by enclosing each vehicle in a bounding box.
We have constructed three databases as follows.
(i) Vehicle database: the positive database contains 745
examples. The number of images is doubled by
synthesizing a mirror image (along the vehicle axis of
symmetry). From a total of 1490 vehicle images, two-
thirds are used as positive training set and one-third
as positive validation set. This validation set is used
to tune the strong classifier decision threshold S to
reach the minimum acceptable correct detection rate
(DR
min
) and the maximum acceptable false-alarm rate
(FA
max
) during cascade training (see Section 5.3). This
validation set is independent of the positive training
Pablo Negri et al. 5
0
1
2
3
Orientation
0
0.2
0.4
0.6
0.8
1
HoG
0
1
2
3
Orientation
0
0.2
0.4
0.6
0.8
1
HoG
Original image Gradient magnitude
Figure 4: Result of application of HoG on a vehicle image.
set used to select weak classifiers. Some positive
examples from the training set are shown in Figure 5.
(ii) Test database: composed of 230 on-road scene images
containing 472 vehicles.
(iii) Negative database: composed of negative examples
which are taken randomly in a set of more than 4000
arbitrary images (which do not contain any vehicle).
During training, the size of the smallest window used is
32
× 32 pixels. It also corresponds to the minimum size of
an object that can be detected in an image. In our case, it
corresponds to a vehicle at nearly 80 meters apart from the
vehicle carrying the vision system.
5.2. Single detector
A single detector is a strong classifier G (i.e., without cascade)
composed of T features or weak classifiers and trained
using Adaboost algorithm. Three detectors are constructed
according to the choice of features. The first two are trained
by using individual features of Haar and HoG. The third
one is trained on the concatenation of both Haar and HoG
features. Five thousand (5000) windows are used in the
negative database for training.
To evaluate the performance of the training method,
we employ cross-validation. We obtained three classifiers
from three different training databases: positive examples in
training and cross-validation databases are chosen randomly.
In the same way, the negative examples are drawn randomly
to construct the negative database. The correct detections
rate (DR), evaluated on test database and used in Section 6,
is the average of DR on all the three detectors. In the same
way, we used the average of false alarms (FAs).
5.3. Cascade detector
In this section, we discuss the implementation of the
attentional cascade [2]. This architecture had shown to be
an appropriate method for fast and reliable object detection
6 EURASIP Journal on Advances in Signal Processing
(1) Given N examples (x
1
, y
1
), ,(x
N
, y
N
)
with x
∈ R and y
i
∈{0,1}
(2) Initialise w
i
= 1/N, i = 1, , N
(3) For t
= 1, , T
For each feature j, train a classifier g
j
using w
i
for which the error is defined as:
j
=
i=1
ω
i
|g
j
(x
i
) − y
i
|
Choose a classifier g
t
with lowest error
t
Update weights: ω
t+1,i
= ω
t,i
β
1−e
i
t
where e
i
= 0ifg
t
(x
i
) = y
i
, e
i
= 1otherwise,
with β
t
=
t
/(1 −
t
)
(4) Output: G
=
T
t
=1
α
t
g
t
≥)(1/2)
T
t
=1
α
t
with α
t
= log(1/β
t
)
Pseudocode 1: Discrete AdaBoost.
on embedded hardware [25, 40]. The cascade is composed
of a series of strong classifiers G
i
.Eachstrong classifier in the
cascade is trained using AdaBoost. Instead of stopping the
iterative process according to a maximum number of features
T, we fix two performance parameters of strong classifier G
i
:
the minimum acceptable correct detections rate DC
min
and
maximum acceptable false-alarm rate FA
max
.
The negative database N
i
, used for training the strong
classifier G
i
at layer i, is formed of those negative examples
which were misclassified (categorized as vehicles) by the
preceding layers.
Till now, we have defined three stopping criteria for the
cascade training as follows.
(1) The first is the maximum number of training itera-
tions (limited to 200) for strong classifier G
i
without
reaching the maximum acceptable false-alarm rate or
minimum acceptable rate of correct detections. We
observed from the results that, for numerous cascades
(called Non Conv), the algorithm has not converge in
the last stage.
(2) The cascade gets a global false-alarm rate lower than
the objective (called F attained). Here, the objective
is F
= 43∗10
−7
, obtained for 16 stage cascade with a
FA
max
equal to 40%.
(3) It is not possible to find sufficient number of negative
examples (called non-Neg).
ThechoiceofDC
min
and FA
max
modifies the cascade
behavior and their architecture. The algorithm given in [2]
indicates that the threshold S
i
of the strong classifier G
i
(1)is
decreased until G
i
has a detection rate of at least DC
min
on the
validation set. The higher the DC
min
, the lower the S
i
, and the
vehicle model will perform better on difficult positives. On
the other hand, more negative examples will be considered
as positives (false alarms). The value of DC
min
also gives the
detection rate for the attentional cascade: D
AC
= (DC
min
)
K
,
where K is the number of layers in the cascade. For example,
the choice of DC
min
= 99.5% achieves a detection rate of
92.3% for a 16-stage classifier.
Considering the classifier threshold is decremented to
reach DC
min
, the iterative process will be stopped when the
strong classifier G
i
does not exceed FA
max
on the negative
dataset. Taking into account the cascade would reject off at
least one half of negatives at each layer, FA
max
can be 50%.
To g e t l o w e r v a l u e s o f F A
max
, G
i
needs weaker classifiers.
In these cases, the global false-alarm rate F can be achieved
shortly, obtaining a cascade with a reduced number of layers.
We obtained three different detectors trained on the three
feature spaces: Haar-like features, HoG, and their fusion.
Three versions of each detector are realised by varying the
number of negative examples used during training: 1000,
2000, 3000 negative examples.
5.4. Controlled cascade
Without any kind of supervision, the training of the different
feature spaces results in dissimilar cascade architectures:
features by layer and number of layers (Figure 7). In order to
obtain comparable cascade detectors and, at the same time,
to avoid the nonconvergences (as frequently observed, see
Ta ble 2 ), we modify the training process by changing the
criterion used to stop the training of the strong classifier G
i
.
For a certain stage in the cascade, if an upper bound on the
maximum number of features is reached without converging
(i.e., it does not achieve DR
min
and FA
max
), the iterative
process is stopped and the function G
i
is conserved in this
state. Then the function G
i+1
of the next stage is trained.
To fix this upper bound in each stage of the cascade, we
use an exponential law. This choice is based on the fact that
we only need a small quantity of features in the earlier stages
of the cascade to eliminate “easy” examples (far from the
boundary). When we move further, the number of features
must be increased as the later stages have to face more
complex examples (positive and negative examples are near
the boundary and are hard to separate). So our choice of
exponential law serves this task and helps us in finding an
appropriate number of features for each layer.
6. RESULTS
In this section, we analyse the results obtained for three
different types of detectors (Haar, HoG, and fusion) and
for the three different implementations (simple, cascade,
and controlled cascade). The performance measures are the
correct detections rate corresponding to the ratio of correct
detections to the total number of vehicles present in the
test database: the false-alarm rate computed as the average
number of false alarms per image (calculated on all the test
images) divided by the total number of windows evaluated
by the detector in an image. In total, 31514 windows are
evaluated in every image at various positions and at different
scales. Detected rectangles are considered as hits if they fulfil
a coincidence criterion with the reference positive bounding
box. The parameters used are a maximum difference size
and a maximum difference position, with values 1.5and0.3,
respectively (OpenCV method). The average computation
time for an image is evaluated on a PC with 2.2GHz
processor.
Pablo Negri et al. 7
Figure 5: Positive and negative examples used for training. The first line shows positive examples (vehicle). The other lines show negative
examples (nonvehicle) used to train the attentional cascade: easy examples used in first stages for the second line and difficult examples used
in the last stages for the third line.
6.1. Single detector
For each detector, we varied the number of features (T
=
50, 100, and 150 features). Figure 6 shows the ROC curves for
each detector (Haar, HoG, and fusion) obtained by changing
the threshold S of (1).
In this figure, we observe the following:
(i) to obtain a low false-alarm rate (less than 0.005), Haar
detector performs better than HoG detector,
(ii) inversely, for a high false-alarm rate, fusion detector
provides a higher correct detection rate than Haar
detector,
(iii) HoG detector behaves in a similar manner as fusion
detector but with a larger quantity of false alarms.
These conclusions are confirmed in Tab le 1 which details
the performances of the single detectors when the threshold
is tuned to obtain a global correct detection rate greater than
99.5% on the positive validation database.
Increasing the number of features refines the decision
boundary for Haar features and the model for HoG features.
Comparing the false-alarm rate, Haar-like features are more
discriminative than HoG features. The fusion of these two
gives intermediate results while conserving a high detection
rate and eliminating a large number of false alarms.
Table 1: Table of results for single detectors.
Type no. Desc DR (%) FA Time (sec)
Haar 50 99.8 0.0220 1.42
Haar 100 99.8 0.0145 3.51
Haar 150 99.0 0.0044 5.17
HoG 50 100 0.0588 0.90
HoG 100 99.9 0.0300 1.68
HoG 150 99.9 0.0233 2.33
Fusion 50 99.6 0.0130 1.67
Fusion 100 99.3 0.0093 3.19
Fusion 150 99.2 0.0063 4.75
We also observed that the computation time increases
with the increase in the number of features. For real-
time application, the use of a large number of features is
unrealistic, so we have to adopt the cascade architecture.
6.2. Cascade detector
Ta ble 2 details the architecture and the performances of
each cascade detector. We used the following parameters
of accuracy for the function G
i
: the minimum acceptable
correct detection rate DR
min
= 0.995 and the maximum
8 EURASIP Journal on Advances in Signal Processing
00.005 0.01 0.015 0.02 0.025 0.03
False alarms rate
0.955
0.96
0.965
0.97
0.975
0.98
0.985
0.99
0.995
1
Detection rate
Haar
HoG
Fusion
Figure 6: ROC curves of single detectors based on Haar, HoG, and
fusion.
acceptable false-alarm rate FA
max
= 0.40. We observe a
mismatch of number of layers between three detectors: in
most cases, the algorithm AdaBoost does not converge.
Increasing the number of negative training examples
increases the number of stages to achieve convergence. This
can easily be explained as follows: a large number of negative
examples allows to generate a robust model or a robust
decision boundary in order to eliminate a huge number of
false alarms in the early stages of the cascade; and very soon,
the difficult cases are left for elimination, resulting in the
nonconvergence of the algorithm.
Moreover, in the case of HoG detector, the number
of features increases quickly (Figure 7). This behaviour is
quite symptomatic of generative classifiers. They can model
accurately positive examples (resulting in a high correct
detection rate in Ta ble 2 ), but they need to construct a
rather complex model in order to fit an accurate decision
boundary for those negative examples which are close to
positive ones. It is also noteworthy that HoG strong classifiers
converge with a small number of features in the early stages
of the cascade as compared to Haar one. In fact, a small
number of features are needed to eliminate those negative
windows relatively far from the model and are sufficient for
convergence. Inversely, Haar detector needs a lot of features
to estimate correctly the decision boundary between the
classes.
We can again observe that the combination of two
features in fusion detector enhances the performance: it uses
HoG features to eliminate those negative examples which
are far from the model and uses Haar features to eliminate
those near the decision boundary. Moreover, the cascade
realisations do not have same number of layers as can be seen
in Ta ble 2 .
We verified that the number of false alarms is strongly
related to number of stages in the cascade. A large number
2 4 6 8 10 12 14
Layer
0
20
40
60
80
100
120
Features number
Haar
HoG
Fusion
Figure 7: Number of features retained by each layer for a detector
with 1000 negative examples.
of stages can eliminate a lot of false alarms. However the
number of correct detections may also get reduced. We will
see that controlling the number of features per stages during
training, as proposed in Section 5.4, will allow us to increase
the number of stages and to enhance the performance of
detectors. Moreover, with this approach, we will obtain the
same number of stages for all detectors and hence will
validate our above-mentioned hypotheses.
6.3. Controlled cascade detector
Figure 8 shows the number of features per stage for the
detectors trained with 1000 negative examples. When a point
is under the exponential curve, this means that the strong
classifier has achieved its goal or has converged without
exceeding the allowed number of features for this layer.
TheHoGdetectorconvergedwithasmallnumberof
features without reaching the maximum number of features
in the earlier stages. On the other hand, in later stages, it was
saturated and could not converge.
The Haar detector did not converge in first stages, but
from the tenth stage (or later) it did. The fusion detector
has an intermediate behavior that lies between the above two
detectors. Figure 9 illustrates the evolution of the proportion
of HoG features with respect to the total number of features
chosen at each layer. We observe that in the initial stages,
HoG features are chosen as being more discriminative, while
in later layers, strong classifiers are mainly based on Haar
features.
This confirms our previous hypotheses for cascade detec-
tors without features controlling mechanism. Moreover,
this can be deduced from Table 3 which summarizes the
global performance of controlled cascade detectors. The
HoG detector obtains a high correct detections rate while the
number of false alarms is also high.
Pablo Negri et al. 9
Table 2: Table of results for the cascade detectors.
Type no. Neg no. Layers no. Desc DR (%) FA Time Stop
Haar 1000 12 430 95.4 0.00080 0.59 Non-Conv
Haar 2000 11 479 96.4 0.00070 0.57 Non-Conv
Haar 3000 10 272 97.7 0.00099 0.58 Non-Conv
HoG 1000 5 89 99.8 0.030 0.73 Non-Conv
HoG 2000 5 52 99.9 0.034 0.56 Non-Conv
HoG 3000 4 21 99.9 0.077 0.43 Non-Conv
Fusion 1000 14 392 94.5 0.00027 0.39 F Attained
Fusion 2000 12 369 93.9 0.00035 0.37 Non-Conv
Fusion 3000 12 358 94.3 0.00039 0.36 Non-Neg
2 4 6 8 10 12 14 16 18 20
Layer
0
20
40
60
80
100
120
140
160
180
200
Features number
Exponential law
Haar
HoG
Fusion
Figure 8: Number of features for the three detectors.
5101520
layer
0
20
40
60
80
100
HoG proportion
Figure 9: Proportion of chosen HoG features for each layer in the
cascade for fusion detector.
Haar detector behaves inversely. It obtains a small
quantity of false alarms at the end of the cascade, but
a large number of positive examples were eliminated in
the preceding layers (Figure 10). This figure describes the
evolution of both detection rate and false-alarm rate with
respect to the number of stages used. Figure 9 illustrates the
fact that the fusion detectors combines the advantages of
Table 3: Table of results for controlled cascade detectors.
Type no. Neg no. Desc DR (%) FA t (s)
Haar 1000 1016 93.8 0.00031 0.66
Haar 3000 942 89.83 0.00018 0.69
HoG 1000 1027 97.8 0.0045 0.51
HoG 3000 1031 99.6 0.0114 1.07
Fusion 1000 1022 94.0 0.00029 0.36
Fusion 3000 1021 93.5 0.00032 0.40
the two features, generative for HoG and discriminative for
Haar. In initial layers, it has essentially used the generative
features to eliminate the negative examples far from model
while conserving a high detection rate. In later layers, it
used the discriminative features to generate fine decision
boundary between positive examples and those negative
examples which are near the model.
This is correctly reflected in on-road scene images in
Figure 11, where white squares indicate (correct or false)
detections. We observe that Haar detector does not detect all
the vehicles but it does not produce many false alarms. On
the contrary, HoG detector produces a large number of false
alarms but detects all the vehicles. Fusion detector reduces
the number of false alarms while detecting all the vehicles as
in HoG case.
Hence the fusion detector performs much better com-
pared to the two others, particularly considering the com-
puting time. This can be explained easily by analysing the
curve in Figure 10(b) where a large number of hypotheses
are rejected by the fusion detector in the earlier stages of the
cascade.
7. CONCLUSIONS
In this paper, we present a cascade of boosted classifiers for
vehicle detection in on-road scene images. Two feature spaces
have been evaluated: Haar-like features and HoG features.
Haar-like features are used to construct discriminative
weak classifiers while the other ones are used to construct
generative weak classifiers. A third detector is obtained by
concatenating these two feature vectors.
10 EURASIP Journal on Advances in Signal Processing
2 4 6 8 10 12 14 16 18 20
Layer
0.9
0.91
0.92
0.93
0.94
0.95
0.96
0.97
0.98
0.99
1
Detection rate
Haar
HoG
Fusion
(a) Rate of correct detections per layer
4 6 8 101214161820
Layer
0
100
200
300
400
500
600
700
800
900
1000
False alarms
Haar
HoG
Fusion
(b) Quantity of false alarms per layer
Figure 10: Behaviour of detection as a function of cascade for a detector with 3000 negative examples.
HoGHaar
Fusion
Figure 11: Detection results on road (motorway) scene images for
three types of detectors.
We have studied the behavior of different architectures:
single detector, cascade detector. To optimise the perfor-
mance of cascade detector, we fix the maximum number
of features per stage of the cascade, that is, for each strong
classification function.
The fusion detector combines the advantages of both
Haar and HoG detectors and achieves a high correct
detection rate and a small number of false alarms. It
uses the generative classifiers to eliminate those negative
examples that are far from the model and then it employs
discriminative classifiers to generate fine decision boundary
between positive examples and those negative examples
which are near to the model.
The main goal of this article is to show the comple-
mentarity between generative and discriminative classifiers.
This complementarity was already proved-theoretically and
experimentally—in [41–43]. This study demonstrates exper-
imentally that the boosting process selects automatically
in first place generative classifiers and then discriminative
ones. Previously, this was done intuitively by combining
sequentially both classifiers.
Our future work will be devoted to the use of these
features to associate a classification system to this vehicle
detection system. The classification system will categorise the
several classes of the vehicle type: passenger car, light truck,
van, and bus.
ACKNOWLEDGMENTS
This research is funded by Peugeot Citro
¨
en Automobile
(PCA). The authors would like to thank M. Fabien Her-
nandez, from the PCA’s Direction de la Recherche et de
l’Innovation Automobile, for his support.
REFERENCES
[1] S. Han, E. Ahn, and N. Kwak, “Detection of multiple
vehicles in image sequences for driving assistance system,” in
Proceedings of the Internat ional Conference on Computational
Science and Its Applications (ICCSA ’05), vol. 3480, pp. 1122–
1128, Singapore, May 2005.
[2] P.A.ViolaandM.J.Jones,“Robustreal-timefacedetection,”
in Proceedings of the 8th IEEE International Conference on
Pablo Negri et al. 11
Computer Vision (ICCV ’01), vol. 2, p. 747, Vancouver, BC,
Canada, July 2001.
[3] Z. Sun, G. Bebis, and R. Miller, “On-road vehicle detection:
a review,” IEEE Transactions on Pattern Analysis and Machine
Intelligence, vol. 28, no. 5, pp. 694–711, 2006.
[4] A. Bensrhair, M. Bertozzi, A. Broggi, P. Miche, S. Mousset,
and G. Toulminet, “A cooperative approach to vision-based
vehicle detection,” in Proceedings of the 4th IEEE Conference
on Intelligent Transportation Systems (ITSC ’01), pp. 207–212,
Oakland, Calif, USA, August 2001.
[5] D. Guo, T. Fraichard, M. Xie, and C. Laugier, “Color modeling
by spherical influence field in sensing driving environment,”
in Proceedings of IEEE Intelligent Vehicles Symposium (IVS ’00),
pp. 249–254, Dearbon, Mich, USA, October 2000.
[6] T. Xiong and C. Debrunner, “Stochastic car tracking with line-
and color-based features,” IEEE Transactions on Intelligent
Transportation Systems, vol. 5, no. 4, pp. 324–328, 2004.
[7] M. B. van Leeuwen and F. C. A. Groen, “Vehicle detection with
a mobile camera,” Tech. Rep., Computer Science Institute,
University of Amsterdam, Amsterdam, The Netherlands,
October 2001.
[8] F. Dellaert, “Canss: a candidate selection and search algorithm
to initialize car tracking,” Tech. Rep. CMU-RI-TR-97-34,
Robotics Institute, Carnegie Mellon University, Pittsburgh, Pa,
USA, 1997.
[9] M. Bertozzi, A. Broggi, and S. Castelluccio, “A real-time
oriented system for vehicle detection,” Journal of Systems
Architecture, vol. 43, no. 1–5, pp. 317–325, 1997.
[10] T. Bucher, C. Curio, J. Edelbrunner, et al., “Image processing
and behavior planning for intelligent vehicles,” IEEE Transac-
tions on Industrial Electronics, vol. 50, no. 1, pp. 62–75, 2003.
[11] U. Franke and A. Joos, “Real-time stereo vision for urban
traffic scene understanding,” in Proceedings of IEEE Intelligent
Vehicles Symposium (IVS ’00), pp. 273–278, Dearbon, Mich,
USA, October 2000.
[12] M. Bertozzi and A. Broggi, “Vision-based vehicle guidance,”
Computer, vol. 30, no. 7, pp. 49–55, 1997.
[13] C. Demonceaux, A. Potelle, and D. Kachi-Akkouche, “Obsta-
cle detection in a road scene based on motion analysis,” IEEE
Transactions on Vehicular Technology, vol. 53, no. 6, pp. 1649–
1656, 2004.
[14] T. N. Tan and K. D. Baker, “Efficient image gradient based
vehicle localization,” IEEE Transactions on Image Processing,
vol. 9, no. 8, pp. 1343–1356, 2000.
[15] H. Yang, J. Lou, H. Sun, W. Hu, and T. Tan, “Efficient and
robust vehicle localization,” in Proceedings of IEEE Interna-
tional Conference on Image Processing (ICIP ’01), vol. 2, pp.
355–358, Thessaloniki, Greece, October 2001.
[16] N. Srinivasa, “Vision-based vehicle detection and tracking
method for forward collision warning in automobiles,” in
Proceedings of the IEEE Intelligent Vehicle Symposium (IV ’02),
vol. 2, pp. 626–631, Versailles, France, June 2002.
[17] J. M. Collado, C. Hilario, A. de la Escalera, and J. M. Armingol,
“Model based vehicle detection for intelligent vehicles,” in
Proceedings of IEEE Intelligent Vehicles Symposium (IVS ’04),
pp. 572–577, Parma, Italy, June 2004.
[18] M P. Dubuisson Jolly, S. Lakshmanan, and A. K. Jain, “Vehicle
segmentation and classification using deformable templates,”
IEEE Transactions on Pattern Analysis and Machine Intelligence,
vol. 18, no. 3, pp. 293–308, 1996.
[19] N. H. C. Yung and A. H. S. Lai, “Detection of vehicle occlusion
using a generalized deformable model,” in Proceedings of
the IEEE International Symposium on Circuits and Systems
(ISCAS ’98), vol. 4, pp. 154–157, Monterey, Calif, USA, May-
June 1998.
[20] S. Agarwal and D. Roth, “Learning a sparse representation
for object detection,” in Proceedings of the 7th European
Conference on Computer Vision (ECCV ’02), pp. 113–130,
Springer, Copenhagen, Denmark, May 2002.
[21] M. Oren, C. Papageorgiou, P. Sinha, E. Osuna, and T. Poggio,
“Pedestrian detection using wavelet templates,” in Proceedings
of the IEEE Computer Society Conference on Computer Vision
and Pattern Recognition (CVPR ’97), pp. 193–199, San Juan,
Puerto Rico, USA, June 1997.
[22] C. Papageorgiou and T. Poggio, “A trainable system for object
detection,” International Journal of Computer Vision, vol. 38,
no. 1, pp. 15–33, 2000.
[23] Y. Freund and R. E. Schapire, “Experiments with a new
boosting algorithm,” in Proceedings of the 13th International
Conference on Machine Learning (ICML ’96), pp. 148–156,
Bari, Italy, July 1996.
[24]Y.Abramson,F.Moutarde,B.Steux,andB.Stanciulescu,
“Combining adaboost with a hill-climbing evolutionary
feature-search for efficient training of performant visual object
detectors,” in Proceedings of the 7th International FLINS Con-
ference on Applied Artificial Intelligence (FLINS ’06),Genova,
Italy, August 2006.
[25] B. Alefs, “Embedded vehicle detection by boosting,” in Pro-
ceedings of the 9th IEEE International Conference on Intelligent
Transportation Systems (ITSC ’06), pp. 536–541, Toronto,
Ontario, Canada, September 2006.
[26] D. Ponsa and A. Lopez, “Cascade of classifiers for vehicle
detection,” in Proceedings of the 9th International Conference on
Advanced Concepts for Intelligent Vision Systems (ACIVS ’07),
vol. 4678, pp. 980–989, Delft, the Netherlands, August 2007.
[27] D. Withopf and B. Jahne, “Improved training algorithm for
tree-like classifiers and its application to vehicle detection,” in
Proceedings of the IEEE International Conference on Intelligent
Transportation Systems (ITSC ’07), pp. 642–647, Seattle, Wash,
USA, September 2007.
[28] R. Lienhart, A. Kuranov, and V. Pisarevsky, “Empirical analysis
of detection cascades of boosted classifiers for rapid object
detection,” in Proceedings of the 25th Pattern Recognition
Symposium (DAGM ’03), vol. 2781, pp. 297–304, Magdeburg,
Germany, September 2003.
[29] N. Dalal and B. Triggs, “Histograms of oriented gradients
for human detection,” in Proceedings of the IEEE Computer
Society Conference on Computer Vision and Pattern Recognition
(CVPR ’05), vol. 1, pp. 886–893, San Diego, Calif, USA, June
2005.
[30] D. Ger
´
onimo, A. L
´
opez, D. Ponsa, and A. D. Sappa, “Haar
wavelets and edge orientation histograms for on-board pedes-
trian detection,” in Proceedings of the 3rd Iber ian Conference on
Pattern Recognition and Image Analysis (IbPRIA ’07), pp. 418–
425, Girona, Spain, June 2007.
[31] Q. Zhu, M C. Yeh, K T. Cheng, and S. Avidan, “Fast human
detection using a cascade of histograms of oriented gradients,”
in Proceedings of the IEEE Computer Society Conference on
Computer Vision and Pattern Recognition (CVPR ’06), vol. 2,
pp. 1491–1498, New York, NY, USA, June 2006.
[32] D. G. Lowe, “Object recognition from local scale-invariant
features,” in Proceedings of the 7th IEEE International Confer-
ence on Computer Vision (ICCV ’99), vol. 2, pp. 1150–1157,
Kerkyra, Greece, September 1999.
12 EURASIP Journal on Advances in Signal Processing
[33] Z. Sun, G. Bebis, and R. Miller, “On-road vehicle detection
using evolutionary gabor filter optimization,” IEEE Transac-
tions on Intelligent Transportation Systems,vol.6,no.2,pp.
125–137, 2005.
[34] F. Porikli, “Integral histogram: a fast way to extract histograms
in cartesian spaces,” in Proceedings of the IEEE Computer
Society Conference on Computer Vision and Pattern Recognition
(CVPR ’05), vol. 1, pp. 829–836, San Diego, Calif, USA, June
2005.
[35] H. Schneiderman and T. Kanade, “A statistical method for 3D
object detection applied to faces and cars,” in Proceedings of
the IEEE Computer Society Conference on Computer Vision and
Pattern Recognition (CVPR ’00), vol. 1, pp. 746–751, Hilton
Head Island, SC, USA, June 2000.
[36] J. Wu and X. Zhang, “A PCA classifier and its application in
vehicle detection,” in Proceedings of the IEEE International Joint
Conference on Neural Networks (IJCNN ’01), vol. 1, pp. 600–
604, Washington, DC, USA, July 2001.
[37] A. Khammari, F. Nashashibi, Y. Abramson, and C. Laurgeau,
“Vehicle detection combining gradient analysis and AdaBoost
classification,” in Proceedings of the 8th IEEE International
Conference on Intelligent Transportation Systems (ITSC ’05),
vol. 2005, pp. 66–71, Vienna, Austria, September 2005.
[38] Z. Sun, G. Bebis, and R. Miller, “Object detection using feature
subset selection,”Pattern Recognition, vol. 37, no. 11, pp. 2165–
2176, 2004.
[39] J. Friedman, T. Hastie, and R. Tibshirani, “Additive logistic
regression: a statistical view of boosting,” Annals of Statistics,
vol. 28, no. 2, pp. 337–407, 2000.
[40] H. Ghorayeb, B. Steux, and C. Laurgeau, “Boosted algorithms
for visual object detection on graphics processing units,” in
Proceedings of the 7th Asian Conference on Computer Vision
(ACCV ’06), pp. 254–263, Hyderabad, India, January 2006.
[41] M. Fritz, B. Leibe, B. Caputo, and B. Schiele, “Integrating
representative and discriminant models for object category
detection,” in Proceedings of the 10th IEEE International
Conference on Computer Vision (ICCV ’05), vol. 2, pp. 1363–
1370, Beijing, China, October 2005.
[42] P. Negri, X. Clady, and L. Prevost, “Benchmarking haar and
histograms of oriented gradients features applied to vehicle
detection,” in Proceeding of the 4th International Conference on
Informatics in Cont rol, Automation and Robotics (ICINCO ’07),
pp. 359–364, Angers, France, May 2007.
[43] L. Prevost, L. Oudot, A. Moises, C. Michel-Sendis, and
M. Milgram, “Hybrid generative/discriminative classifier for
unconstrained character recognition,” Pattern Recognition
Letters, vol. 26, no. 12, pp. 1840–1848, 2005.