Báo cáo hóa học: "Research Article Efficient Scheduling of Pigeons for a Constrained Delay Tolerant Application" potx
Bạn đang xem bản rút gọn của tài liệu. Xem và tải ngay bản đầy đủ của tài liệu tại đây (695.31 KB, 7 trang )
Hindawi Publishing Corporation
EURASIP Journal on Wireless Communications and Networking
Volume 2010, Article ID 142921, 7 pages
doi:10.1155/2010/142921
Research Article
Efficient Scheduling of Pigeons for a Constrained Delay
Tolerant Application
Jiazhen Zhou, Jiang Li, and Legand Burge
Department of Systems and Computer Science, Howard University, Washington, DC 20059, USA
Correspondence should be addressed to Jiazhen Zhou,
Received 2 September 2009; Accepted 10 September 2009
Academic Editor: Benyuan Liu
Copyright © 2010 Jiazhen Zhou et al. This is an open access article distributed under the Creative Commons Attribution License,
which permits unrestricted use, distribution, and reproduction in any medium, provided the original work is properly cited.
Information collection in the disaster area is an important application of pigeon networks—a special type of delay tolerant
networks (DTNs) that borrows the ancient idea of using pigeons as the telecommunication method. The aim of this paper is
to explore highly efficient scheduling strategies of pigeons for such applications. The upper bound of traffic that can be supported
under the deadline constraints for the basic on-demand strategy is given through the analysis. Based on the analysis, a waiting-
based packing strategy is introduced. Although the latter strategy could not change the maximum traffic rate that a pigeon can
support, it improves the efficiency of a pigeon largely. The analytical results are verified by the simulations.
1. Introduction
After disasters (e.g., earthquakes, fires, tornadoes) happen,
it is urgent to rescue people and protect property. To ensure
the rescuing work timely and correctly executed, accurate live
information (e.g., in the format of videos) is needed by the
commanding headquarter. As the instant communications
of large amount of message is usually unrealistic, especially
after the disasters which probably destroy the communi-
cation infrastructure, a feasible solution is to send special
vehicles (like helicopters) to the disaster areas to collect the
information. This special type of communication belongs to
the range of delay tolerant communications.
Pigeon networks [1, 2], which borrow the ancient idea
of employing pigeons as the communication tool, can be
viewed as a special type of delay tolerant networks (DTNs)
[3] that use special-purpose message carriers. Of course, the
“pigeons” used here are not the real pigeons. Instead, they
are vehicles that are equipped with much better moving
ability and partial instant wireless communication ability.
For instance, it can be an unmanned aviation vehicle or a
robotic insect.
The communication in a DTN is achieved through the
mobility of nodes since two nodes can only communicate
when they are close enough. This mobility has two modes:
random mobility and controlled mobility. Examples of
random mobility include epidemic routing [4] and the
naturally mobile sensor networks [5]. For the controlled
mobility mode, usually special purpose message carriers like
message ferries [6] are used and they can follow desired
routes to pick up or deliver messages.
The mobility of a pigeon can be controlled, which is
similar to the message ferry [6]. However, the difference is
that a pigeon network has the character of being private and
secure [1, 2], which is especially suitable for the purpose of
disaster rescue and recovery. Thus, in the remained part of
this paper, pigeon is used in place of the vehicle mentioned
above.
Although the rescuing task hastobetimetolerantdue
to the long time (compared with instant communications)
needed by the travel of pigeons, the delay that can be
tolerated is still limited. For example, the best time to
rescuing people in an earthquake disaster should be within
48 hours, and this limit is largely shortened (two hours)
if someone is wounded or if the buildings that people are
locked in are in dangerous situation. In conclusion, this
becomes a constrained delay tolerant problem, and the delay
is the most important metric to be considered for this type
of problems.
Superficially, the delay that each message demand suffers
is the only important factor, and so it sounds like a pigeon
can stay in an area as long as it can to make sure that the
2 EURASIP Journal on Wireless Communications and Networking
demands in that area can be satisfied. However, another
fact is that the pigeons available for the disaster rescue and
recovery tasks are also limited. If the pigeons can be schedule
more efficiently, more disaster areas can be covered. As a
result, more lives and properties can be saved if the pigeons
are scheduled more efficiently.
The problem presented in this paper is very close to the
dynamic vehicle routing problem (VRP) [7–9]. The arrival
of new demands is stochastic, and there is no ending of
time horizon. Thus, a complete solution of routing and
scheduling plan like in the static vehicle routing problem
is impossible. This character makes policies rather than the
solution the primary goal to pursue in the area of dynamic
VRP. The representative works include those by Bertsimas
and van Ryzin [10, 11] and extended work by Swihart and
Papastavrou [12].
While this paper borrows the important results from
Bertsimas and van Ryzin [10, 11] and Swihart and Papas-
tavrou [12], it is also obviously different.
(1) The problem in this paper is more like a dynamic
traveling salesman problem (TSP) rather than a dynamic
VRP. The main reason is that essentially there is no capacity
constraints. The amount of information that can be picked
up by a pigeon is very large due to the advanced storage
technique. Thus, it can be viewed as if there is no limit.
(2) There is only one destination node, which is the
headquarter. All pigeons must start from the headquarter
and deliver all information to the headquarter rather than
random destinations like in [12]. This difference makes the
delay considered here totally different from what are in
[10, 12].
(3) Messages to be picked up have their deadlines that
should not be violated. In contrast, in [10, 12], the only goal
is to minimize the average delay.
The rest of this paper is organized as follows. The basic
model is described in Section 2, and the analyses on the two
main strategies—the on-demand strategy and the waiting-
based packing strategy—are presented in Sections 3 and 4,
respectively. In Section 5, the numerical results are shown,
and Section 6 concludes this paper.
2. Model Description
Due to the consideration of safety for emergency staff and
the availability of resources, the headquarter for information
precessing and rescue commanding is usually far away from
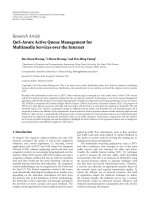
the disaster area. As shown in Figure 1, t
r
is the travel time
for a pigeon between the headquarter and the disaster area
with the assumption that the velocity of a pigeon is constant.
The pigeon has enough communication ability to know the
arrivals of messages on the information collectors in the
disaster area immediately. For the facility of analysis, the
disaster area is assumed to be a square with the size being
A, which is similar to most study on dynamic vehicle routing
problem like in [10, 12]. The demands are generated in the
disaster area with average rate being λ, and the time spent on
picking up each message is
s. For each demand generated, it
must be delivered to the headquarter within time T
D
. T
D
is
Headquarter
t
r
Pigeon Pigeon
Disaster areaA
Figure 1: System view of headquarter and disaster area.
also called the deadline of a message in the following part of
this paper.
A key question here is how a pigeon should be scheduled
to pickup and deliver messages. If the goal is merely
guaranteeing minimum delay for each message as in [10, 12],
it is often beneficial to let the pigeon start picking up the
messages whenever they are available. This approach can be
viewed as an on-demand strategy.
However, there is a big disadvantage of the on-demand
strategy in the scenario considered in this paper. As the
headquarter is far away from the disaster area, if the message
rate is not high, then the number of messages picked up
on each trip is very limited. In other words, the throughput
that can be achieved compared with the travel cost, which is
defined as efficiency in Section 4.2, can be very low for the
low-load case. In fact, a high-efficient scheduling scheme can
allow a pigeon to be shared among different disaster areas.
Based on this fact, a waiting-based scheduling is introduced.
In the following part of this paper, these two strategies are
evaluated. The main performance metrics studied include
the maximum throughput of the system, the maximum
number of messages allowed to be picked up on each trip,
and the comparison of efficiency of these two strategies
under different load cases.
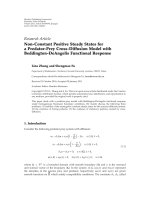
3. On-Demand Strategy
Denote the time point that the message demands firstly
generated as time 0; a pigeon is sent out to the disaster
area right away. The dynamic flow of traveling and pickup
is described in Figure 2.
With the assumption that a pigeon is able to com-
municate with the information collectors, it is reasonable
for a pigeon to determine the messages to be picked up
when it arrives at the disaster area. The pickup strategies in
the disaster area is a dynamic traveling salesman problem
EURASIP Journal on Wireless Communications and Networking 3
t
k
− t
r
t
k
Tr ip
k
Tr ip
k
+1
t
k
+trip
k
t
k
+trip
k
+trip
k
+1
Pickup time t
r
t
r
Pickup time t
r
t
r
Headquarter
Disaster
area
Headquarter
Disaster
area
Headquarter
Disaster
area
Figure 2: The trips of a pigeon.
(DTSP) [7]. As shown by Bertsimas and van Ryzin [10],
possible strategies include Shortest TSP, Nearest Neighbor,
and Space Fill Curve. Since the focus of this paper is analysis
of the scheduling of the pigeon, only the Shortest TSP policy
is considered due to its tractability on analysis.
With the Shortest TSP strategy applied, a shortest route
will be formed after the messages for the current trip have
been determined. Then the pigeon will go through those sites
according to the shortest tour to pick up their messages.
3.1. Basic Scenario—A Single Pickup Point. To facilitate the
analysis and get better insight, a simpler scenario with a
single pickup point is firstly considered. For example, there
is a sensor network and a collector in the disaster area . The
pigeon just needs to pick up messages from the collector. For
this simple case, there is no additional travel cost involved
with picking up messages.
Denote the number of messages picked up at kth trip
by n
k
; the total time spent on each trip (calculated as from
the moment that start pickup to the moment that the pigeon
returns to the disaster area for next pickup) is the summation
of the time spent on pickup (n
k
s) and the travel time back
and forth between the headquarter and the disaster area
(2t
r
):
TripTime
k
= n
k
s +2t
r
.
(1)
The total number of messages picked up during (k +1)
th
trip is generated during k
th
trip, which is the product of the
average arrival rate and the k
th
trip time:
n
k+1
= λ
(
n
k
s +2t
r
)
.
(2)
For a stablesystem, the number of messages picked up at each
trip should converge to a value. Let k
→∞and denote the
steady-state solution for n
k
as n
∗
,and(2)becomes
n
∗
= λsn
∗
+2λt
r
= ρn
∗
+2λt
r
.
(3)
Thus,
n
∗
=
2λt
r
1 − ρ
.
(4)
Note that in the above equation, ρ
= λs is the system
utilization, which is surely
≤1. As to be shown later, the
allowed value of ρ could be much lower with the deadline
constraint considered.
Theorem 1. The upper bound of system utilization without
violating t he deadlines of messages can be approximated as
(T
D
− 3t
r
)/(T
D
+ t
r
).
Proof. For the scenarios considered here, if the deadline of
the message at the head of each trip can be met, the deadlines
of all other messages can also be met.
Denote the delay of the message at the head of (k +1)
th
trip as D
k+1
.AscanbeseenfromFigure 2, the starting point
of pickup for k
th
trip is between the time points of the arrival
of the tail message of k
th
trip and the head message of (k +
1)
th
trip. It is reasonable to estimate that the waiting of the
head message of the (k +1)
th
trip starts at 1/(2λ) after the
starting of k
th
trip. Thus the waiting time before being picked
up is n
k
s +2t
r
−1/(2λ), and the time spent on picking up the
messages on the (k +1)
th
trip is n
k+1
s. Also consider the time
returning to the headquarter (t
r
), D
k+1
can be expressed as
D
k+1
= n
k
s +2t
r
−
1
(
2λ
)
+ n
k+1
s + t
r
.
(5)
Similar to the derivation for the number of messages on
each trip, the steady-state solution for (5) can be obtained by
letting k
→∞. The resulting expression of delay for the head
message, denoted as D
∗
, is confined by the deadline:
D
∗
= 2n
∗
s +3t
r
−
1
(
2λ
)
T
D
.
(6)
As the goal is to get the maximum allowed message rate,
which means that λ should be quite high, it is reasonable
to omit the 1/(2λ) part to make the expression neater. As a
result, the inequality (6)becomes
4t
r
λs
1 − ρ
+3t
r
T
D
.
(7)
Note that ρ
= λs, after solving above inequality, it can be
obtained that
ρ
Max
=
T
D
− 3t
r
T
D
+ t
r
.
(8)
Remarks 2. (1) The maximum system utilization that can be
supported is constrained by the deadline requirement and
the travel costs between the headquarter and the disaster
area. The longer the tolerant delivery delay is, the higher is
the traffic rate that can be supported.
4 EURASIP Journal on Wireless Communications and Networking
(2) To make sure this scheme to be useful, it is necessary
that T
D
− 3t
r
> 0. Thus, the time spent on single-trip travel
between the headquarter and the disaster area should be <
T
D
/3.
3.2. Scenario with Multiple Pickup Locations. As a more
general case, there are multiple information collectors in a
disaster area, and a Shortest TSP algorithm is to be employed.
It is assumed that n messages to be picked up are located on
n sites, one for each.
As a classical problem, the shortest travel cost for going
though n locations in a square area in the Euclidean plane
can be approximated as [13]
Tr vCst
≈ β
TSP
An
,
(9)
in which β
TSP
≈ 0.72 [14]. Using normalized velocity of the
pigeon (
= 1), the time spent on travel for picking up messages
is β
TSP
√
An. Thus, (2)becomes
n
k+1
= λ
n
k
s + β
TSP
An
k
+2t
r
. (10)
The steady-state solution can be obtained as
n
∗
=
2λt
r
1 − ρ
+
λ
2
β
2
TSP
A + λβ
TSP
A
λ
2
β
2
TSP
A +8λt
r
1 − ρ
2
1 − ρ
2
.
(11)
The delay of the head message is
D
∗
= 2n
∗
s
+2β
TSP
An
∗
+3t
r
−
1
(
2λ
)
≤ T
D
.
(12)
Solving above inequality (with the 1/(2λ)partomitted),
the highest system utilization that will ensure no violation of
deadline is
ρ
Max
=
T
D
− 3t
r
T
D
+ t
r
+
β
2
TSP
A −
β
4
TSP
A
2
+2β
2
TSP
As
(
T
D
− 3t
r
)
(
T
D
+ t
r
)
s
.
(13)
4. Waiting-Based Packing Strategy
The on-demand strategy studied above has at least two
disadvantages: (1) the pigeon might never get any rest; (2)
the number of messages picked up on each trip can be
quite limited, which causes low efficiency of the pigeon. To
avoid these shortcomings, a waiting-based packing st rategy is
introduced and analyzed in this section.
As shown in Section 3.1, the number of messages picked
up on each trip for the on-demand strategy is n
∗
. If the
pigeon waits some additional time in the disaster area (or
the headquarter), more demands can be formed during the
pigeon’s waiting (can be for taking a rest, or going to other
areas for a trip). Thus, the amount of messages to be picked
up is more than n
∗
. In the practical operation, a fixed
amount of messages N (or say a batch with size N)canbe
packed for the pigeon to pick up. An important constraint,
however, is that the deadlines of messages should not be
violated.
4.1. Maximum Number of Messages That Can Be Picked Up.
Since there is a deadline associated with each message, the
number of messages picked up at each trip is limited. As the
pigeon chooses to wait before starting pickup, the waiting
time for the head message before the pickup process is N/λ.
For the single pickup point scenario, the travel time for
picking up and delivery is N
s + t
r
. As a result, the total delay
for the head message (denoted as D
w
)is
D
w
=
N
λ
+ N
s
+ t
r
≤ T
D
.
(14)
It can be derived that
N
≤
λ
(
T
D
− t
r
)
1+ρ
= N
∗
.
(15)
For the multiple pickup point case, the delay for the head
message is
D
w
=
N
λ
+ N
s + β
TSP
AN + t
r
.
(16)
With the deadline constraint applied, the maximum
message that can be packed on a trip is
N
∗
=
λ
(
T
D
− t
r
)
1+ρ
+
λ
2
β
2
TSP
A −
λ
4
β
4
TSP
A
2
+4λ
3
β
2
TSP
A
1+ ρ
(
T
D
− t
r
)
2
1+ρ
2
.
(17)
4.2. Comparison of Efficiency. Efficiency measures the
amount of message that can be picked up by a round trip
of the pigeon. To facilitate the comparison, it is defined as the
ratio of time spent on serving customers compared with the total
time spent on the trip. Here the waiting time is not counted
as the time in a trip since the pigeon can use this time period
for resting or picking up messages from other areas.
According to the above definition, the efficiency of on-
demand strategy, denoted as Eff
od
,is
Eff
od
=
n
∗
s
n
∗
s +2t
r
= ρ.
(18)
For the waiting-based packing strategy, the highest
efficiency can be achieved when N = N
∗
:
Eff
Max
packing
=
N
∗
s
N
∗
s +2t
r
=
ρ
(
T
D
− t
r
)
ρ
(
T
D
+ t
r
)
+2t
r
.
(19)
For the multiple pickup scenarios, the efficiency can be
computed similarly using the results of (11)and(17).
5. Numerical Results
In this section, the above analysis is firstly verified with
the simulation results, in which CSIM [15] simulation
tool is employed. After the verification of correctness, the
EURASIP Journal on Wireless Communications and Networking 5
8070605040302010
Arrival rate of messages
Simulation result
Analytical result
Deadline
0
1
2
3
4
5
Averagedelayoftheheadmessage
(a) Single pickup point
605040302010
Arrival rate of messages
Simulation result
Analytical result
Deadline
0
1
2
3
4
5
Averagedelayoftheheadmessage
(b) Multiple pickup points
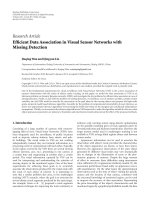
Figure 3: Comparison of delay for on-demand strategy.
9080706050403020
Number of messages picked up on each trip
Simulation result
Analytical result
Deadline
0
1
2
3
4
5
Averagedelayoftheheadmessage
(a) Single pickup point
807060504030
Number of messages picked up on each trip
Simulation result
Analytical result
Deadline
0
1
2
3
4
5
Averagedelayoftheheadmessage
(b) Multiple pickup points
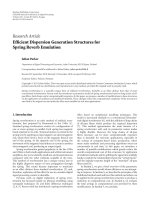
Figure 4: Comparison of delay with different packing size.
improvement of efficiency by the waiting-based packing
scheme is shown.
The main parameters used here are the following: the
time spent on picking up a message is
s = 0.01 hour (36
seconds), the single trip time between the headquarter and
the disaster area is t
r
= 0.2 hour (12 minutes), and the
deadline for a message is 4 hours. The travel time of a side
of the disaster area, which is normalized as
√
A,is0.05hour
(3 minutes).
5.1. Comparison of Simulation and Analytical Results. In
Figure 3, the change of delay according to the arrival rate
is shown for the on-demand scheduling. For both the single
pickup point and multiple pickup points cases, the analytical
results match the simulation results very well. From the x-
axis of two graphs it can be observed that the maximum
supported trafficisλ
Max
= 80.95 for the single pickup point
case, and it is λ
Max
= 61.47 for the multiple pickup points
case due to additional travel costs needed for picking up the
messages.
For the waiting-based packing strategy, the effect of batch
size on the delay of head message is shown in Figure 4.Here
λ
= 30, and n
∗
<N<N
∗
, n
∗
and N
∗
can be computed
using (4), (11), (15), and (17). For single pickup point case,
the rounded values are n
∗
= 18, N
∗
= 88. For the multiple
pickup location case, it is n
∗
= 25, N
∗
= 80.
As can be seen from Figure 4, the delay goes up as the
batch size becomes larger and larger. Also it can be seen that
less number of messages can be packed when there are travel
6 EURASIP Journal on Wireless Communications and Networking
109876543210
Deadline of messages (hours)
0
0.2
0.4
0.6
0.8
1
Maximum system utilization
(a) Effect of deadline
109876543210
√
A
t
r
0
0.2
0.4
0.6
0.8
1
Maximum system utilization
(b) Effect of size of disaster area
Figure 5: Effects of parameters on maximum throughput.
8070605040302010
Arrival rate of messages
On-demand strategy
Packing strategy
0.1
0.2
0.3
0.4
0.5
0.6
0.7
0.8
0.9
1
Efficiency
(a) Single pickup point
605040302010
Arrival rate of messages
On-demand strategy
Packing strategy
0.1
0.2
0.3
0.4
0.5
0.6
0.7
0.8
0.9
1
Efficiency
(b) Multiple pickup points
Figure 6: Comparison of efficiency for the two strategies.
costs associated with pickup. In addition, the simulation
results show that the analytical results are very accurate.
5.2. Effects of D eadline and Disaster Area on the Maximum
Throughput. As shown in (13), the maximum throughput
that can be achieved is determined by the deadlines of
messages, the travel time between the headquarter and the
disaster area, and the size of the disaster area. Here t
r
is
assumed to be fixed at 0.2 (hour). In Figure 5(a), A is close
to 0 so that we can observe the effect of deadline. It can be
observed that the normalized throughput is very low when
T
D
is close to the minimum allowed value (3t
r
)butcanbe
closeto1whenT
D
is very high, which means almost no
deadline constraints.
In Figure 5(b), T
D
is fixed at 4 hours and the effect of
size of disaster area is shown. When the disaster area is very
small, ρ
Max
can be as large as 0.81; as the size of disaster
area increases, the incurred travel cost also increases, which
reduce the traffic that can be supported drastically. When the
travel time along a single side of the disaster area is as large
as 10 times of the travel distance between the headquarter
and the disaster area, the maximum system utilization can be
achieved is close to 0.
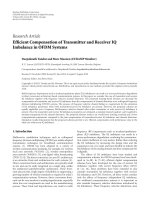
5.3. Comparison of Efficiency. As shown in Figure 6, the
efficiency of the waiting-based scheme is obviously higher
(as much as 500% higher) than the on-demand strategy,
especially when the load is not heavy. However, the difference
of the two strategies disappears as ρ
→ ρ
Max
. In fact, this is
because as the load increases, the demands accumulated on
the former trip in the on-demand strategy are close to the
maximum number of messages that the pigeon can pick up
EURASIP Journal on Wireless Communications and Networking 7
without violating the deadline, and the two schemes become
the same when ρ
= ρ
Max
.
Another benefit of the waiting-based packing strategy is
that the efficiency of the pigeon is not so sensitive to the
arrival rate as the on-demand strategy. For example, for the
single pick up point case (Figure 6(a)), the efficiency of the
pigeon under the waiting-based strategy when λ
= 20 is
0.61, and it becomes 0.81 when λ
= 81, which is about 30%
percent higher. In contrast, with the on-demand strategy the
efficiency increases from 0.2 to 0.8 as λ increases from 20 to
8, which is 300% higher.
6. Conclusion
The dynamic scheduling strategies of pigeons for informa-
tion pickup and delivery in the disaster area is analyzed.
The upper bound of traffic that can be supported under
the deadline constraints for the basic on-demand strategy is
given through the analysis and verified by the simulations.
Based on the analysis of the basic on-demand scheduling
strategy, a waiting-based packing strategy is introduced.
Although the latter strategy could not improve the maximum
traffic rate that a pigeon can support, it improves the
efficiency of the pigeon largely.
Possible future works include more detailed investiga-
tions of the dynamic routing strategies other than the short-
est TSP policy and the effect of the different distributions of
the arrival rate, service rate, deadlines on the conclusion, and
bounds obtained in this paper.
Acknowledgments
The authors would like to thank the funding support from
NSF under Grant CNS-0832000 and the Mordecai Wyatt
Johnson Program of Howard University.
References
[1] H. Guo, J. Li, and Y. Qian, “HoP: pigeon-assisted forward-
ing in partitioned wireless networks,” in Processings of the
International Conference on Wireless Algorithms, Systems and
Applications (WASA ’08), pp. 72–83, 2008.
[2] H. Guo, J. Li, Y. Qian, and Y. Tian, “A practical routing
strategy in delay tolerant networks using multiple pigeons,” in
Proceedings of the IEEE Military Communications Conference
(MILCOM ’08), San Diego, Calif, USA, November 2008.
[3] K. Fall, “A delay-tolerant network architecture for challenged
internets,” in Proceedings of the Computer Communication
Review (SIGCOMM ’03), vol. 33, pp. 27–34, August 2003.
[4] A. Vahdat and D. Becker, “Epidemic routing for partially-
connected ad-hoc networks,” Tech. Rep. CS-200006, Duke
University, Durham, NC, USA, 2000.
[5] D. Deng and Q. Li, “Communication in naturally mobile sen-
sor networks,” in Proceedings of the International Conference
on Wireless Algorithms, Systems and Applications (WASA ’09),
Boston, Mass, USA, August 2009.
[6] W. Zhao and M. Ammar, “Message ferrying: proactive routing
in highlypartitioned wireless ad hoc networks,” in Proceedings
of the 9th IEEE Workshop on Future Trends of Distributed
Computing Systems, pp. 308–314, San Juan, Puerto Rico, USA,
May 2003.
[7] H. N. Psaraftis, “Dynamic vehicle routing problems,” in
Vehicle Routing: Methods and Studies,B.L.GoldenandA.A.
Assad, Eds., pp. 223–248, North-Holland, Amsterdam, The
Netherlands, 1988.
[8] H. N. Psaraftis, “Dynamic vehicle routing: status and
prospects,” Annals of Operations Research,vol.61,no.1,pp.
143–164, 1995.
[9] A. Larsen, The dynamic vehicle routing problem, dissertation,
Technical University of Denmark, 2000.
[10] D. Bertsimas and G. van Ryzin, “A stochastic and dynamic
vehicle routing problem in the Euclidean plane,” Operation
Researches, vol. 39, pp. 601–615, 1991.
[11] D. Bertsimas and G. Ryzin, “Stochastic and dynamic vehicle
routing with general demand and interarrival time distribu-
tion,” Advanced Applied Probability, vol. 25, pp. 947–978, 1993.
[12] M. Swihart and J. Papastavrou, “A stochastic and dynamic
model for the singlevehicle pick-up and delivery problem,”
European Journal of Operational Research, vol. 114, no. 3, pp.
447–464, 1999.
[13] J. Beardwood, J. Halton, and J. Hammersley, “The shortest
path through many points,” Proceedings of the Cambridge
Philosophical Society, vol. 55, pp. 299–327, 1959.
[14] D. Johnson, “Local Optimization and the Traveling Salesman
Problem,” in Proceedings of the 17th International Colloquium
on Automata, languages and programming, pp. 446–461, 1990.
[15] Mesquite Software, Inc., “CSIM19 User’s Guide,” Austin, Tex,
USA, 2001.