Báo cáo hóa học: "Research Article Link Gain Matrix Estimation in Distributed Large-Scale Wireless Networks" pot
Bạn đang xem bản rút gọn của tài liệu. Xem và tải ngay bản đầy đủ của tài liệu tại đây (1.35 MB, 9 trang )
Hindawi Publishing Corporation
EURASIP Journal on Wireless Communications and Networking
Volume 2010, Article ID 651795, 9 pages
doi:10.1155/2010/651795
Research Article
Link Gain Matrix Estimation in Distributed Large-Scale
Wireless Networks
Jing Lei, Larry Greenstein, and Roy Yates
WINLAB, Department of ECE, Rutgers University, North Brunswick, NJ 08902, USA
Correspondence should be addressed to Jing Lei,
Received 9 June 2009; Revised 1 October 2009; Accepted 25 November 2009
Academic Editor: Christian Ibars
Copyright © 2010 Jing Lei et al. This is an open access article distributed under the Creative Commons Attribution License, which
permits unrestricted use, distribution, and reproduction in any medium, provided the original work is properly cited.
In planning and using large-scale distributed wireless networks, knowledge of the link gain matrix can be highly valuable. If the
number N of radio nodes is large, measuring N(N
−1)/2 node-to-node link gains can be prohibitive. This motivates us to devise
a methodology that measures a fraction of the links and accurately estimates the rest. Our method partitions the set of transmit-
receive links into mutually exclusive categories, based on the number of obstructions or walls on the path; then it derives a separate
link gain model for each category. The model is derived using gain measurements on only a small fraction of the links, selected on
the basis of a maximum entropy. To evaluate the new method, we use ray-tracing to compute the “true” path gains for all links in
the network. We use knowledge of a subset of those gains to derive the models and then use those models to predict the remaining
path gains. We do this for three different environments of distributed nodes, including an office building with many obstructing
walls. We find in all cases that the partitioning method yields acceptably low path gain estimation errors with a significantly reduced
number of measurements.
1. Introduction
The powerful technology and market trends towards por-
table computing and communications imply an increasingly
important role for wireless access in the next-generation
Internet. Moreover, distributed and pervasive computing
applications are proliferating and expected to drive large-
scale deployments of embedded computing devices inter-
connected via wireless links. Large-scale distributed wireless
networks arise in a variety of forms. Examples include sensor
networks, wherein data processing is distributed among
the nodes [1]; ad hoc mesh networks, wherein nodes act
as relays for each other [2]; and the laboratory testbeds
used to evaluate sensor and mesh network protocols [3]. In
all these cases, the operation for the network can benefit
from knowing the link gain matrix, which describes the
transmitter-receiver power ratio among all the nodes in the
network taken pairwise.
A particular application of the gain matrix in testbeds
is described in [4, 5]. Motivated by the goal to advance
the technology innovation in the wireless networking field,
the Open Access Research Testbed for Next-Generation
Wireless Networks (ORBIT) was built at Rutgers University’s
WINLAB facility [4, 5], which focuses on the creation of
a large-scale wireless network testbed and aims to facilitate
a broad range of experimental research on novel protocols
and application concepts. The proposed ORBIT system
employs a two-tier laboratory emulator/field trial network
to achieve reproducibility of experimentation, and supports
evaluation of protocols and applications in real-world set-
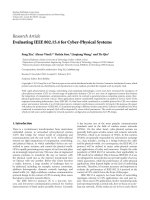
tings illustrated in Figure 1(a). As shown by Figure 1(b), the
laboratory-based wireless network emulator is constructed
with a large two-dimensional array of 802.11x radio nodes
(400 nodes), which are uniformly spaced on a square
grid of 20 meters by 20 meters and can be dynamically
interconnected into specified topologies for reproducible
wireless channel models. The number of pairwise link gains
in this case is about 80,000. Due to obstructing pillars as well
as multipath from reflecting walls, floor, and ceiling, the link
gains depart significantly from a simple free-space pathloss
description. Unfortunately, conventional stochastic pathloss
models (e.g., [6]) cannot be applied to laboratory testbed,
and the alternative of making measurements over all node
pairs can be impractical. Therefore, it is desirable to estimate
2 EURASIP Journal on Wireless Communications and Networking
(a) (b)
Figure 1: Mapping of real world environments onto the ORBIT indoor testbed. (a) Real world outdoor/indoor environment (b) 400-node
ORBIT indoor testbed.
all the path gains, if possible, using only a small fraction of
the full number of measurements.
In [7], we considered the use of spatial interpolation
for pathloss estimation. In this approach, a subset of link
gains is measured, and then we invoke the assumption of
smooth spatial variations to infer all other path gains via
interpolation. For the 400-node ORBIT testbed, we found
that the use of spatial interpolation methods permitted
reasonably accurate estimates to be obtained using only a
few thousand measurements instead of 80,000. However,
we report here on an alternative approach that provides
even better accuracies with even fewer measurements. The
key to this new approach, and what makes it novel, is that
the set of all node-to-node paths is partitioned into 3 or
more categories, and a separate stochastic model is derived
for each. By using a suitable means of categorization, we
find that each model of pathloss versus log-distance fits a
simple mathematical function with a low-standard deviation
of values about the fit. Specifically, we show that using 1,000
measurements, and a heuristic method for choosing which
links to measure, the RMS value of the errors in estimating
link gains can be kept below 3 dB. As noted, the testbed
environment we study is characterized by multipath and also
by obstructions on many of the paths. To test our approach,
we emulate the measurements of link gains by using WiSE, a
ray-tracing tool developed by Bell Labs [8]. In addition to the
perfect square grid on the ORBIT testbed, we also apply the
proposed method to a similar lab with larger obstructions
and an irregular node layout in a building with many
obstructing walls. We find that, even for a difficult scenario
with numerous obstructions, the partitioning method yields
acceptably low-path gain estimation errors with a much-
reduced number of measurements.
The rest of this paper is organized as follows. Models of
both the environment and the node-to-node link gain (or
pathloss) are given in Section 2. The new method for esti-
mating link gains from limited measurements is described
and exemplified in Section 3, and a method based on entropy
is described for choosing the subset of transmitting nodes.
In Section 4, two alternative, more complicated distributed
network scenarios are postulated. For each, the entropy
method for choosing transmitters and the new method for
estimating link gains are applied, and numerical results are
presented. Section 5 concludes the paper.
2. System Model
2.1. Classification of Link Gains. With the help of WiSE
[8], we can obtain the set of all link gains for a specific
environment as a function of its geometry. We have observed
that in an indoor environment, the link gains deviate from
the law of free-space propagation, due to the impacts of
reflection, diffraction, and scattering. Furthermore, we have
found that obstructed links, that is, those without a clear LOS
path, usually undergo more severe attenuation than those
with an LOS path, and the added attenuation caused by
the obstructions is almost unrelated to the T-R separation
distance [9].
Accordingly, the link between a given transmitter and
receiver can be classified into one of several different
categories according to the number of obstructing objects
lying between them. A partition-based path loss analysis for
in-home and residential areas at 5.85 GHz was conducted
by Durgin et al. in [10]. In this paper, we generalize their
framework to distributed wireless networks and propose to
estimate both the path loss exponent and attenuation factors
using selectively sampled measurements.
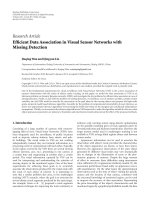
Consider the ORBIT testbed, for example, whose layout
(top view) is shown in Figure 2. All the links are classified
into three categories, namely, links having an LOS path,
NLOS links traversing pillars only once, and NLOS links
traversing pillars twice (there are no links traversing pillars
three or more times in this particular grid). For convenience,
in the following we will refer to the links in the three
categoriesastypes0,1,and2,respectively.
EURASIP Journal on Wireless Communications and Networking 3
0 5 10 15 20 25
0
2
4
6
8
10
12
14
16
18
20
(m)
(m)
Figure 2: Top view of layout of 400-nodes ORBIT testbed. Both the
vertical and horizontal dimensions are measured in meters (m). The
three added rectangles in the middle represent obstructing pillars.
The 21 transmitters highlighted with red stars and circled within
ellipses serve transmit-receive links in all three categories. All other
transmitters serve links in only the first and second categories.
More generally, let us assume that, in a given network
of distributed wireless nodes, there are some paths between
node pairs with as many as L different types of obstructions.
Then, according to our approach, there will be L + 1 distinct
categories (with one LOS category and L NLOS categories)
for the pathloss formula, where pathloss is the negative dB
value of link gain (received power divided by transmitted
power). Assume that d
0
is a conveniently chosen reference
distance, which is typically 1 meter in indoor environments;
that
(d
0
) is the pathloss at d
0
for a single direct ray free-space
pathloss; that α
l
is the pathloss exponent for the lth category;
that PL
l
(d) denotes the pathloss of type l at T-R separation
distance d. A generalized expression for the LOS (type 0) and
NLOS (type 1 to type L) pathloss estimate can be given by
PL
l
(
d
)
=
(
d
0
)
+ Δ
l
−10α
l
log
10
d
d
0
,0≤ l ≤ L,
(1)
where
(d
0
) = 20 log
10
(4πd
0
/λ); λ is the wavelength; α
l
is
the pathloss exponent of type l links; Δ
l
denotes an added
increment resulting from multipath and for l obstructions.
3. Link Gain Matrix Estimation Based on
Classified Links
3.1. MMSE Estimation for the Model Parameters. Assume
d
0
= 1 m and that N
l
measurements of path loss for links of
type l are available, that is, PL
0
l
(d
i
), i = 1,2 , N
l
. Then the
MMSE estimate for the pathloss exponent and attenuations
can be obtained by solving
α
0
, , α
L
,
Δ
0
, ,
Δ
L
=
arg min
α, Δ
⎧
⎨
⎩
L
l=0
N
l
i=1
ρ
l
α
l
, d
l,i
+ Δ
l
2
⎫
⎬
⎭
,
(2)
where α
:= [α
0
···α
L
], Δ := [Δ
0
···Δ
L
],
ρ
l
(
α
l
, d
)
= PL
0
l
(
d
)
−10α
l
log
10
d
d
0
+ ε
(
d
0
)
(3)
denotes the difference between the actual path loss (mea-
sured by equipment or emulated using ray tracing tools) and
the estimate based on our model in (1).
For those links which are not measured, we can learn
their T-R separations as well as their path type (i.e., value
of l) through a simple geometric analysis. Then, by plugging
the MMSE estimates into (1), the unknown link gains can be
predicted.
3.2. A Heuristic Approach and Some Results. In order to
achieve a good tradeoff between estimation accuracy and the
complexity of measurement, an appropriate choice for the
sampling set of link gains is important. Unfortunately, this is
beyond the scope of classical sampling theory. Therefore, we
need to resort to some heuristics.
To begin, let us consider the ORBIT testbed in Figure 2,
which shows the 2-D top view of the 400-nodes. The three
rectangles in the middle represent the obstructing pillars,
and the uniformly-spaced dots denote the possible node
locations. Through a simple geometrical calculation, we
learned that to have a full diversity of links, that is, types 0, 1,
and 2 all included, the transmitters have to be placed on one
of the 21 locations (within the ellipses highlighted), while
the remaining locations do not have type 2 links. Therefore,
these 21 transmitter locations have more uncertainty than
the remaining ones in terms of link types.
Our design is to measure a total of 1,000 link gains, and
to do so by using transmitters at the 21 locations within the
highlighted ellipses. Then we randomly choose 350, 600 and
50 samples from links of types 0, 1, and 2, respectively. The
numbers of samples are chosen to be proportional to the total
number of link gains in each category. This set of choices
constitutes a trial. For each trial, we estimate the link gain
model parameters via (2), and then substitute them into (1)
to obtain the set of link gain estimates, say
{PL
est
l
}.Foreach
transmitter-receiver pair on the grid, we employed the ray
tracing result from WiSE as our benchmark set of type l link
gain “measurements”, say
{PL
l
}. The estimation error for a
type l link is then given by
ε
l
= PL
est
l
−PL
l
.
(4)
We repeat the above experiments for 100 trials.
For each type of link, we calculate the bias and standard
deviations of ε, and plot them against the experimental
trial index (1, 2, , 100) in (a)-(b) of Figures 3, 4,and5.
(The estimation accuracy of type 2 NLOS links outperforms
type 1 links in this example. This is because the number
of sampled links versus the number of unmeasured links is
greater for type 1 links with respect to our choice, that is,
50/(unmeasured number of type 2 links) > 600/(unmeasured
number of type 1 links). Basically, the relative estimation
accuracy for each category depend on how we allocate the
ratio of samples for a given number of measurements. The
general principle of selective sampling should guarantee
4 EURASIP Journal on Wireless Communications and Networking
0 102030405060708090100
−0.02
0
0.02
0.04
0.06
Trial index
Bias of ε
0
Bias (dB)
(a)
0 102030405060708090100
0.65
0.6
0.55
0.5
0.45
Trial index
Standard deviation of ε
0
Stdv (dB)
(b)
Figure 3: Statistics of estimation error for type 0 (LOS) links for 100 trial selection of sample measurements. The horizontal line is the
average over the 100 trials. (a) Bias of ε
0
, (b) Standard deviation of ε
0
.
0 102030405060708090100
0
0.5
1
1.5
Trial index
Bias of ε
1
Bias (dB)
(a)
0 102030405060708090100
2.8
2.85
2.9
2.95
3
3.05
Trial index
Standard deviation of ε
1
Stdv (dB)
(b)
Figure 4: Statistics of estimation error for type 1 (NLOS) links for 100 trial selection of sample measurements. The horizontal line is the
average over the 100 trials. (a) Bias of ε
1
, (b) Standard deviation of ε
1
.
the link gain estimation accuracy for every category.) The
common value of α in these results was approximately 2.3.
The solid lines in (a) and (b) denote the empirical bias and
standard deviation for the estimation error ε,respectively;
the dashed lines indicate the mean value over the 100 trials.
We can conclude from these results that the random choice
of 1, 000 link samples can provide sufficient estimation
accuracy. (As a rule-of-thumb on testbed experimentation,
calibration errors below 3 dB can be considered quite accept-
able.). The method proposed in this paper outperforms
spatial interpolation methods. In a separate computation not
reported here, we have found that our proposed method,
using 1/4 as many measurements, produces RMS estimation
errors 3–4 dB lower than those using spatial interpolation.
3.3. Maximum Entropy Sampling. Despite the success of
the heuristic strategy for the ORBIT testbed, for a more
general setup a quantitative or semianalytic approach is
desired. The first problem we need to solve is the selection
of measurements. Given the size of samples, our objective
is to select a most informative subset of link gains. As is
traditional, we use entropy as our measure of information
since it is a robust measure of the information available from
a set of random variables [11]. To this end, let us assume that
through site-specific analysis, the relative frequencies of type
l link gains over the node ensemble of size N(N
− 1)/2are
known a priori, and are given by τ
l
,0≤ l ≤ L. For links in
each category, we characterize their “importance” or entropy
by a constant [12]
λ
l
=−log
2
τ
l
.
(5)
As a consequence, the entropy of transmitter n can be
quantized by the weighted sum of the (N
− 1) TX-RX links
propagating from it, that is,
(
n
)
=
N
q=1
L
l=0
λ
l
δ
l
n,q
,
(6)
where
δ
l
n,q
=
⎧
⎨
⎩
1, if link
n, q
is of type l,
0, otherwise.
(7)
Then the indices of transmitters,
{n
l
}, are rearranged
according to their entropy, yielding
(
n
1
)
≥
(
n
2
)
···≥
(
n
N
)
.
(8)
As a test for the proposed maximum-entropy sampling
strategy, we calculated the empirical entropy for all the
transmitter locations in Figure 2. It is not surprising that the
21 transmitter locations highlighted in Figure 2 stand out as
the ones having the largest entropy.
In light of (8), we can identify the locations for the
transmitter-receiver pairs whose link gains are going to be
measured. Specifically, assume that χ is the total number of
link gain measurements for a size N network, and that we
will measure all the N
− 1 link gains between a transmitter,
say n
l
, and its N −1receivers.Wecanchooseκ =χ/(N −1)
transmitter locations for sampling, which correspond to the
first κ indices
{n
l
}
κ
l
=1
in (8). Considering the reciprocity
of link gains, κ is a lower bound for candidate transmitter
locations. It is worth noting that spatial correlation is
EURASIP Journal on Wireless Communications and Networking 5
0 102030405060708090100
0.05
0.1
0.15
0.2
0.25
Trial index
Bias of ε
2
Bias (dB)
(a)
0 102030405060708090100
2.2
2.25
2.3
2.35
2.4
2.45
Trial index
Standard deviation of ε
2
Stdv (dB)
(b)
Figure 5: Statistics of estimation error for type 2 (NLOS) links for 100 trial selection of sample measurements. The horizontal line is the
average over the 100 trials. (a) Bias of ε
2
, (b) Standard deviation of ε
2
.
0 5 10 15 20 25
0
2
4
6
8
10
12
14
16
18
20
(m)
(m)
Figure 6: Layout of imaginary case with 400 nodes and three
obstructers in the middle. Both the vertical and horizontal dimen-
sions are measured in meters (m).
0
0.05
0.1
0.15
0.2
0.25
0.3
0.35
0.4
123
Relative ratio
NLOS link type
Number of NLOS links of given type
versus number of LOS links
Figure 7: Relative size for the three types of NLOS links. For each
type l (l
≥ 1), the number of NLOS links is normalized by the
number of LOS links (type 0).
not taken into account by (8). In other words, provided
some of the nodes are close enough in space, the adjacent
neighbors may exhibit similar entropy values because they
are subject to very similar obstruction situations. To remove
the redundancy incurred by spatial correlation, we can
employ a spatial mask over a sufficiently small area to “filter
out” the node with representative entropy value and have it
serve as the centroid of a clustered neighborhood.
4. Results for More Complex Scenarios
The results so far are for a fairly benign scenario: A 20 × 20
square grid in an open lab with three small obstructions.
Here, we postulate two scenarios that are more difficult and
evaluate the new method for each one, using the maximum-
entropy strategy for selecting the links that are measured. The
first scenario assumes an ORBIT-like testbed, except that the
three obstructing pillars are irregularly placed and of various
sizes. The second scenario assumes an irregular layout of
100 nodes distributed throughout an office building with 81
separation walls. Specifically, we consider the first floor of the
Alcatel-Lucent building at Crawford Hill in Holmdel, New
Jersey. This building has been the focus of numerous studies
using the WiSE ray-tracing tool [13–15].
4.1. Modified Testbed Environment. As shown in Figure 6, the
400-nodes are still arranged into a 20 by 20 array, but the
three pillars are reconfigured such that they are of different
size and do not align with each other. In this experimental
setup, all links are classified into four categories depending
on the number of obstructions encountered. Specifically, the
LOS links are denoted as type 0, whereas the NLOS links
aregroupedintotype1,type2,andtype3,respectively.As
shown in Figure 7, their relative frequencies (normalized by
the number of LOS-type links) are quite different, where the
type 1 links significantly outnumber their type 2 and type 3
counterparts, resulting in their discrepancies of entropy.
In this exercise, we will specify χ
∼ 8, 000 measurements,
considerably more than the 1,000 measurements for the
simpler, more regular ORBIT Lab. This means that there will
be κ
= 20 transmitting nodes, each sending signals to be
measured by the other 399 nodes.
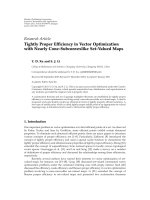
Figures 8(a)–8(c) enumerates the number of type 1, 2,
and 3 links for each possible sampling location n,1
≤ n ≤
400. Based on Figures 6 and 8, Figure 9 shows the entropy
value for each possible transmitter location. It is obvious
that our sampling of link gains can focus on a small set
of transmitter locations only, namely, those with the largest
entropies. The clustering around the spikes (local maxima)
can be attributed to the spatial correlation among adjacent
6 EURASIP Journal on Wireless Communications and Networking
0 50 100 150 200 250 300 350 400
0
200
400
Number of
type
−II
(a) T−R Pair Obstructed by 1 Pillar Only
0 50 100 150 200 250 300 350 400
0
50
100
Number of
type
−III
(b) Obstructed by 2 Pillars Only
0 50 100 150 200 250 300 350 400
0
20
40
Number of
type
−IV
TX index, n
(c) Obstructed by 3 Pillars
Figure 8: Number of NLOS links in each category as a function of transmitter location. For convenience, the TX located on array coordinates
(i, j), 1
≤ i, j ≤ 20 is indexed by 20 × (i − 1) + j.
0
100
200
300
400
500
600
700
800
0 50 100 150 200 250 300 350 400
TX index, n
, n
Typicality for 400 possible sampling locations
Figure 9: Entropy of each possible transmitter location.
transmitters. It can also be seen that there are 20 transmitter
indices exhibiting local maximum values of typicality. We
select these beacons for our experiment.
By sampling the link gains associated with the 20 trans-
mitter locations (
≤ 20×399), we can obtain MMSE estimates
for the LOS and NLOS pathloss exponents, attenuation
factors, and then use them to predict the gains of all
the unmeasured links. As a benchmark, we can collect
the ensemble of pseudomeasurements given by ray tracing
(using WiSE or other tools) and do the same estimation
for modeling parameters as above. Figures 10(a), 10(b) and
10(c) compare the difference of these two approaches. The
bar on the left corresponds to the full ensemble, which
involves all the link gains obtained by ray tracing; while the
bar on the right corresponds to the selected samples from the
ensemble. Employing the full ensemble of link gains obtained
by ray tracing, the estimation for the pathloss exponents
and attenuation dB factors are given by α
0
= 2.0, α
1
=
2.84, α
2
= 2.93, α
3
= 3.00; and Δ
0
= 0.92, Δ
1
= 4.98, Δ
2
=
5.96, Δ
3
= 6.13, respectively. In contrast, by invoking
the proposed “maximum entropy sampling” method, the
estimation for the pathloss exponents and attenuation factors
are α
0
= 1.96, α
1
= 2.86, α
2
= 2.90, α
3
= 2.98; and
Δ
0
= 1.15, Δ
1
= 5.07, Δ
2
= 5.93, Δ
3
= 6.47, respectively,
which agree well with the previous derivations. We can see
from these figures that, although the samples in the selected
set are 10% of the ensemble size (200
× 399), the estimation
accuracies for the pathloss parameters using the reduced set
are within
±8% of the accuracies using the full set. Therefore,
the efficacy of our selective sampling approach, which is
based on the links’ entropy, is verified.
4.2. Mesh Network in an O ffice Building. Figure 11 shows
a top view of the first floor of the Crawford Hill building
[13]. We assume that 100 wireless transceivers (nodes) are
deployed in the offices and hallways with uniform random-
ness. Figure 12 is a scatter plot of pathloss versus distance for
the nearly 5000 transmit-receive paths among the 100 nodes.
The spread is large, but appropriate partitioning of the links
can produce individual scatter plots of narrower spread.
Before proceeding, we note that there is a small number
of weak links where the pathloss falls below 100 dB. As a
rule-of-thumb, we can ignore any link in this category, since
the pathloss is so large that the two nodes can be regarded
as “disconnected”. As a result, there are 4818 link gains to
model, of which 590 are LOS (type 0) and 4228 are NLOS.
The 4228 NLOS links can be further partitioned into
links with one or two intervening walls (type 1); links
with three or four intervening walls (type 2); and links
with more than four intervening walls (type 3). Figure 13
presents fitting parameters (α and Δ) and RMS fitting errors
(δ) for two cases: in (a), all NLOS links are lumped into
one category; and in (b), the NLOS links are partitioned,
as above, into three categories. It is clear that the refined
modeling corresponding to (b) provides a better fit to the
scatter plots, since the average δ
l
(l = 0, , L) is significantly
reduced by increasing L. Little is gained in this case, however,
by increasing L beyond 4.
Now assume a target of χ
∼ 500 link gain measurements,
that is, about 10% of the total number of link gains. By
applying the sampling methodology of Section 3.3,wecan
pick the five transmitter nodes with maximum entropy and
EURASIP Journal on Wireless Communications and Networking 7
0
0.5
1
1.5
2
2.5
3
Link gain type, l
0123
α
l
(a) Comparison of pathloss exponents
0
1
2
3
4
5
6
7
Link gain type, l
0123
Δ
l
(b) Comparison of attenuation factors
0
0.5
1
1.5
2
2.5
3
3.5
4
Link gain type, l
0123
δ
l
Full
Samples
(c) Comparison of RMS estimation error
Figure 10: Comparison of Pathloss Model Parameters and RMS Estimation Error for the Experimental Setup in Figure 6.
Figure 11: Top view of first floor of the Crawford Hill Building,
with 100 nodes (filled circles) distributed with uniform random-
ness.
then measure their link gains (with respect to the rest of
the network) to estimate the model parameters of (1). The
outcome is shown in Figure 14, where the three bar graphs
indicate the values of α, Δ, and RMS gain estimation error for
each of the NLOS categories. The close agreements between
the bars for the ensemble and those for the sample sets
validate, again, the maximum-entropy approach for selecting
transmitters. The RMS gain estimation errors are seen to be
∼ 6 dB while, with all NLOS links lumped into one category,
this error is close to 10 dB. This demonstrates the significant
gain in accuracy by partitioning the NLOS links into several
categories.
Most mesh network scenarios will probably have a
complexity lying between the two extremes of the ORBIT Lab
and the Crawford Hill example, above. In that case, the RMS
−140
−130
−120
−110
−100
−90
−80
−70
−60
−50
−40
10
0
10
1
10
2
10
3
T-R separation distance (m)
Pathloss (dB)
Figure 12: Scatter plot of pathloss versus log-distance for all node-
to-node link gains inside the Crawford Hill Building (Figure 11).
Most of the points near the top are for LOS paths.
gain estimation errors for most cases are likely to lie between
3 and 6 dB. The latter value might be reduced further, not
by increasing L but by alternative, novel arrangements for
choosing the links to be measured. This is a topic for further
research.
8 EURASIP Journal on Wireless Communications and Networking
Type−0(LOS)
{α
0
=1.92, Δ
0
=0}
Type
−1(NLOS)
{α
1
=3.1, Δ
1
=8.36}
σ
0
=0.68 σ
1
=9.54
(a)
Type−0(LOS)
{α
0
=1.92, Δ
0
=0}
Type
−1(NLOS)
{α
1
=2.56, Δ
1
=3.85}
Type
−2(NLOS)
{α
2
=2.93, Δ
2
=5.26}
Type
−3(NLOS)
{α
3
=3.18, Δ
3
=7.1}
σ
0
=0.68 σ
1
=5.13 σ
2
=5.77 σ
3
=6.48
(b)
Figure 13: Results for two ways of partitioning links in the Crawford Hill Building. (a) LOS links and all NLOS links. (b) LOS links and three
categories of NLOS links, based on number of intervening walls. For each case, the results given are for the model parameters, α and Δ,and
the fitting error, δ.
0
0.5
1
1.5
2
2.5
3
3.5
Link gain type, l
0123
α
l
(a) Comparison of pathloss exponents
0
1
2
3
4
5
6
7
8
Link gain type, l
0123
Δ
l
(b) Comparison of attenuation factors
0
1
2
3
4
5
6
7
Link gain type, l
0123
δ
l
Full
Samples
(c) Comparison of RMS estimation error
Figure 14: Model parameters and gain estimation errors for the Crawford Hill scenario in Figure 11 with three NLOS categories. Results are
shown for measurement of the full ensemble of link gains (left bars) and for measurement of a reduced set of 500 link gains (right bars). For
the more conventional case where all NLOS links are lumped into one category, the RMS estimation error is close to 10 dB.
5. Conclusion
We have developed a link gain matrix estimation methodol-
ogy for distributed nodes in wireless networks. In contrast
to stochastic pathloss models with but one set of parameters,
the proposed approach distinguishes among links with dif-
ferent numbers of path obstructions (or walls) and partitions
them into separate models. We also developed a maximum-
entropy method for selecting, in a structured way, the links to
be measured. The results show that all gain matrix elements
can be predicted with reasonable accuracy by measuring only
a small fraction of all network links. Finally, the proposed
method could be extended to outdoor networks, assuming
the availability of site-specific data. This is due to the
generality of the pathloss modeling, link partitioning, and
transmitter selection approaches described here.
EURASIP Journal on Wireless Communications and Networking 9
References
[1] I. F. Akyildiz, W. Su, Y. Sankarasubramaniam, and E. Cayirci,
“A survey on sensor networks,” IEEE Communications Maga-
zine, vol. 40, no. 8, pp. 102–105, 2002.
[2] I. F. Akyildiz, X. Wang, and W. Wang, “Wireless mesh
networks: a survey,” Computer Networks,vol.47,no.4,pp.
445–487, 2005.
[3] J. Lei, R. Yates, L. Greenstein, and H. Liu, “Mapping link SNRs
of real-world wireless networks onto an indoor testbed,” IEEE
Transactions on Wireless Communications,vol.8,no.1,pp.
157–165, 2009.
[4]J.Lei,R.Yates,L.Greenstein,andH.Liu,“Wirelesslink
SNR mapping onto an indoor testbed,” in Proceddings of the
1st International Conference on Testbeds and Research Infras-
tructures for the Development of Networks and Communities
(TRIDENTCOM ’05), pp. 130–135, Trento, Italy, February
2005.
[5] J. Lei, R. Yates, L. Greenstein, and H. Liu, “Mapping link
SNRs of wireless mesh networks onto an indoor testbed,” in
Proceedings of the 2nd International Conference on Testbeds and
Research Infrastructures for the Development of Networks and
Communities (TRIDENTCOM ’06), pp. 389–395, Barcelona,
Spain, March 2006.
[6] V. Erceg, L. J. Greenstein, S. Y. Tjandra, et al., “Empirically
based path loss model for wireless channels in suburban envi-
ronments,” IEEE Journal on Selected Areas in Communications,
vol. 17, no. 7, pp. 1205–1211, 1999.
[7] X. Zhao, L. Razoumov, and L. J. Greenstein, “Path loss
estimation algorithms and results for RF sensor networks,” in
Proceedings of the 60th IEEE Vehicular Technology Conference
(VTC ’04), vol. 7, pp. 4593–4596, September 2004.
[8] S. J. Fortune, D. M. Gay, B. W. Kernighan, O. Landron, R.
A. Valenzuela, and M. H. Wright, “WISE design of indoor
wireless systems: practical computation and optimization,”
IEEE Computational Science & Engineering,vol.2,no.1,pp.
58–68, 1995.
[9] F. Aguado, F. Isasi, J. M. Hernando, A. Formella, and S. Pagel,
“Interpolation techniques for ray-tracing models,” Microwave
and Optical Technology Letters, vol. 25, no. 5, pp. 343–346,
2000.
[10] G. D. Durgin, T. S. Rappaport, and H. Xu, “Partition-based
path loss analysis for in-home and residential areas at 5.85
GHz,” in Proceedings of the IEEE Global Telecommunications
Conference, vol. 2, pp. 904–909, Sydney, Australia, 1998.
[11] V. Markl, P. J. Haas, M. Kutsch, N. Megiddo, U. Srivastava, and
T. M. Tran, “Consistent selectivity estimation via maximum
entropy,” The VLDB Journal, vol. 16, no. 1, pp. 55–76, 2007.
[12] J. Lee, “Constrained maximum-entropy sampling,” Operations
Research, vol. 46, no. 5, pp. 655–664, 1998.
[13] R. A. Valenzuela, S. Fortune, and J. Ling, “Indoor propagation
prediction accuracy and speed versus number of reflections in
image-based 3-D ray-tracing,” in Proceedings of the 48th IEEE
Vehicular Technology Conference (VTC ’98), vol. 1, pp. 539–
543, Ottawa, Canada, 1998.
[14] L. Xiao, L. Greenstein, N. Mandayam, and W. Trappe, “A
physical-layer technique to enhance authentication for mobile
terminals,” in Proceedings of IEEE International Conference on
Communications (ICC ’08), pp. 1520–1524, 2008.
[15] A. O. Kaya, L. Greenstein, D. Chizhik, R. Valenzuela, and
N. Moayeri, “Emitter localization and visualization (ELVIS):
a backward ray tracing algorithm for locating emitters,” in
Proceedings og the 41st Annual Conference on Information
Sciences and Systems (CISS ’07), pp. 376–381, Baltimore, Md,
USA, 2007.