Báo cáo hóa học: " Research Article An Evaluation of Interference Mitigation Schemes for HAPS Systems" ppt
Bạn đang xem bản rút gọn của tài liệu. Xem và tải ngay bản đầy đủ của tài liệu tại đây (2.12 MB, 11 trang )
Hindawi Publishing Corporation
EURASIP Journal on Wireless Communications and Networking
Volume 2008, Article ID 865393, 11 pages
doi:10.1155/2008/865393
Research Article
An Evaluation of Interference Mitigation Schemes for
HAPS Systems
Bon-Jun Ku,
1
Do-Seob Ahn,
1
and Nam Kim
2
1
Department of Global Area Wireless Technology Research, Electronics and Telecommunications Research Institute,
Daejeon 305-350, South Korea
2
Information and Communication Engineering Division, Chungbuk National University, Cheongju 360-763, South Korea
Correspondence should be addressed to Bon-Jun Ku,
Received 28 September 2007; Revised 25 February 2008; Accepted 23 May 2008
Recommended by Abbas Mohammed
The International Telecommunication Union-Radiocommunication sector (ITU-R) has conducted frequency sharing studies
between fixed services (FSs) using a high altitude platform station (HAPS) and fixed-satellite services (FSSs). In particular,
ITU-R has investigated the power limitations related to HAPS user terminals (HUTs) to facilitate frequency sharing with space
station receivers. To reduce the level of interference from the HUTs that can harm a geostationary earth orbit (GEO) satellite
receiver in a space station, previous studies have taken two approaches: frequency sharing using a separated distance (FSSD) and
frequency sharing using power control (FSPC). In this paper, various performance evaluation results of interference mitigation
schemes are presented. The results include performance evaluations using a new interference mitigation approach as well as
conventional approaches. An adaptive beamforming scheme (ABS) is introduced as a new scheme for efficient frequency sharing,
and the interference mitigation effect on the ABS is examined considering pointing mismatch errors. The results confirm that the
application of ABS enables frequency sharing between two systems with a smaller power reduction of HUTs in a cocoverage area
compared to this reduction when conventional schemes are utilized. In addition, the analysis results provide the proper amount
of modification at the transmitting power level of the HUT required for the suitable frequency sharing.
Copyright © 2008 Bon-Jun Ku et al. This is an open access article distributed under the Creative Commons Attribution License,
which permits unrestricted use, distribution, and reproduction in any medium, provided the original work is properly cited.
1. INTRODUCTION
A high-altitude platform station (HAPS) is a station that is
located at an altitude of 20–50 km It is designed to provide
various services in a wide coverage range over a terrestrial
area and a short delay over a satellite network [1, 2].
Due to these service characteristics, HAPS is considered
to be a new infrastructure that can substitute or fill in
conventional systems, including terrestrial and/or satellite
systems. Specifically, the possibility of utilizing HAPS as
base stations for IMT-2000 services, as gateway links, and as
an infrastructure for broadband wireless services has been
investigated [3–5]. As HAPS utilizes the frequency bands
previously allocated for conventional systems, investigations
of issues on the frequency sharing between these systems
have been conducted [6].
The International Telecommunication Union-Radio-
communication sector (ITU-R) has studied frequency shar-
ing between HAPS and terrestrial systems for the IMT-
2000 service, between HAPS and terrestrial systems for fixed
services (FS), and between HAPS for FS and satellite systems
forfixed-satelliteservices(FSSs)[7–9]. Due to the recent
increase in the demand for broadband services, frequency
sharing studies related to higher-frequency bands are very
important for the efficient use of frequency resources. For
this reason, ITU-R has conducted the studies related to
limiting the transmit power of HAPS user terminals (HUTs)
in order to protect satellite receivers utilizing the frequency
bands of 47-48 GHz [10]. The 47-48 GHz frequency bands
were previously allocated to the FFS spectrum to accommo-
date feeder links that serve to supply broadcasting satellite
services [11].
As a part of these ITU-R study results, frequency sharing
using a separated distance (FSSD) and frequency sharing
using power control (FSPC) have been proposed [9, 12].
FSSD has been proposed for sharing between the HUTs of an
HAPS system and a space station receiver of an FSS system
[9]. The results show that the two systems cannot share the
2 EURASIP Journal on Wireless Communications and Networking
North pole
z-axis
Latitude, φ
e
= 90
◦
Fixed longitude line
HUT
HAPS coverage
HAPS platform
Earth station of satellite (ES)
Nadir
SAC
RAC
UAC
HUT
Off-axis angle, φ
h
Latitude of the HAPS platform or ES
Off-axis angle, φ
s
Satellite
Center of the Earth
Latitude, φ
e
= 0
◦
y-axis
Magnification
Earth
HAPS
Satellite
x
y
z
φ
e
Desired path
Interfering path
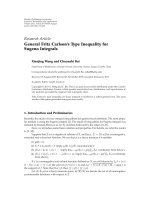
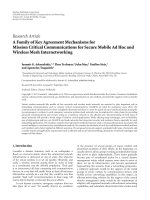
Figure 1: Description of HAPS and GEO systems.
same frequency band within a cocoverage area. The aggregate
interference from the HUTs to a space station receiver would
be minimally acceptable when there is no overlap between
service areas. The use of FSSD is a simple approach that
avoids harmful interference from HUTs to geostationary
earth orbit (GEO) receivers in the space station. This is not
desirable in terms of sharing because a very long separation
distance may be required.
On the other hand, a recent study [12] demonstrated
frequency sharing between two systems by applying an FSPC
to the HUTs. Various methodologies have been investigated
to determine the power level for the HUT; the results of these
studies contributed to ITU-R. In this paper, several impor-
tant points during the application of these two schemes
for frequency sharing are addressed using the contribution
results of [12] to ITU-R. Detailed performance evaluation
results of these schemes are provided.
In addition to the aforementioned evaluations of conven-
tional schemes, new evaluation results of frequency sharing
studies applicable to the HUTs are introduced. Adaptive
beamforming schemes (ABSs) are practically mandatory for
future wireless communication systems, not only for efficient
interference mitigation but also for high-quality service.
However, there have been no reported results related to
sharing via ABS between the two systems in the frequency
bands of 47-48 GHz. ABS is applied to HUTs to maintain
the main beam in the direction of the HAPS platform and
to create a null condition in the direction of a GEO receiver.
The performance of ABS is compared with that of FSPC by
obtaining the cumulative distribution function (CDF) of the
interference level. However, ABS is sensitive to errors caused
by imprecise sensor calibrations. Considering this, the effects
of the errors due to the pointing mismatch under the null
condition are analyzed. Finally, a hybrid approach combining
FSPC and ABS is applied in order to take advantage of
both schemes and the performance evaluation results are
presented.
This paper is organized as follows. Section 2 describes the
system model and the related system parameters to calculate
the interference level from the HUTs to a GEO receiver.
Section 3 presents the methodology that calculates the inter-
ference from the HUTs to a GEO receiver. The procedure of
calculating the CDF of the interference level that is received
from the transmitted power of HUTs is then presented, and
the estimation results are shown according to the latitude of
the HAPS platform. After showing the interference analysis
results using various conventional interference mitigation
schemes including FSSD and FSPC in Section 4, new results
are introduced using ABS and its variant in Section 5. This
paper concludes with Section 6.
2. SYSTEM MODEL
2.1. System configuration
In this section, the system model that estimates the interfer-
ence level from the HUTs to the satellite receiver is intro-
duced [12]. Figure 1 shows the system model represented
Bon-Jun Ku et al. 3
Ground range (km)
−250 −200 −150 −100 −50 0 50 100 150 200 250
Ground range (km)
−250
−200
−150
−100
−50
0
50
100
150
200
250
HUTs in UAC
HUTs in SAC
HUTs in RAC
HAPS nadir (center of the HAPS coverage)
UAC
SAC
RAC
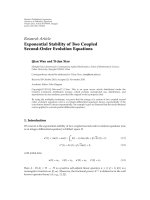
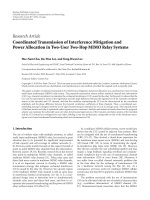
Figure 2: An example of HUT distribution.
Table 1: HAPS coverage zones.
Coverage area Elevation angles (degrees) Ground range (km)
UAC 90–30 0–36
SAC 30–15 36–76.5
RAC 15–5 76.5–203
in three-dimensional (3D) coordinates. At the bottom of
Figure 1, a 3D constellation of an HAPS system exists along
with a satellite in the GEO. Here, the target range was
magnified to estimate the interference, and it is represented
in the yz plane. The y-andz-axes represent the lines from
the center of the Earth to the satellite and to the North Pole,
respectively.
The HAPS system consists of the HAPS platform and
a number of HUTs distributed in the HAPS coverage. The
HAPS service coverage areas consist of urban area coverage
(UAC), suburban area coverage (SAC), and rural area
coverage (RAC) areas that are delineated mainly according
to the elevation angles. This is based on the assumption that
the HAPS nadir is located at the center of the UAC. SAC and
RAC surround the UAC, as indicated in Figure 1.
The satellite system has a GEO receiver in a space station
and an earth station (ES) based on the ground. As a satellite
system is considered in the GEO, it is assumed that the HAPS
platform is located at the same longitude with the satellite
in a worst-case scenario. The satellite is located at the GEO,
that is, φ
e
= 0 degrees, at a height that is 36,000 km above
sea level. The ES of the satellite is located at the nadir of the
HAPS platform to consider the worst case. The desired paths
shown here as solid lines indicate the signal paths from HUTs
to theHAPS platform in theHAPS system and the signal path
from the ES to the satellite receiver in the satellite system. The
interfering paths represented here as dotted lines indicate the
signal paths from the HUTs to the satellite receiver. The angle
φ
h
is the off-axis angle from the main beam of a transmitting
HUT antenna to the satellite, and the angle φ
s
is the off-axis
angle from the main beam of the receiving satellite antenna
to a HUT.
2.2. HAPS system
HAPS service coverage zones are divided into UAC. SAC
and RAC depending on the elevation angle of the HUTs, as
shown in Ta ble 1 [13]. Each coverage area has a maximum
of 100 HUTs respectively. Each HUT has a bandwidth B of
2 MHz; the transmitting power density P
t
and the maximum
antenna gain G
max
of the HUTs differ depending on the
coverage area, as shown in Ta ble 2 [13]. By analyzing the
link budget of the HAPS system, it is possible to obtain the
appropriate transmit power and antenna gain for the HUTs.
It is assumed that the HUTs are distributed randomly in
each zone. Figure 2 shows an example of a HUT distribution
scheme on the ground.
The antenna beam pattern of [14] is used here for the
HUT. The antenna beam pattern, G
h
(φ
h
) is expressed by
G
h
(φ
h
) =
⎧
⎪
⎪
⎪
⎪
⎪
⎪
⎪
⎪
⎪
⎪
⎪
⎪
⎪
⎪
⎨
⎪
⎪
⎪
⎪
⎪
⎪
⎪
⎪
⎪
⎪
⎪
⎪
⎪
⎪
⎩
G
max
− 2.5 × 10
−3
D
λ
φ
h
2
,0
◦
<φ
h
<φ
m
,
2 + 15 log
D
λ
, φ
m
≤ φ
h
<
100λ
D
,
52
− 10 log
D
λ
− 25 log φ
h
,
100λ
D
≤ φ
h
< 48
◦
,
10
− 10 log
D
λ
,48
◦
≤ φ
h
≤ 180
◦
,
(1)
where G
max
and D are the maximum antenna gain defined in
Ta bl e 2 and the antenna diameter of the HUT, respectively,
and λ is the wavelength in meters. φ
m
is given by
φ
m
=
20λ
D
G
max
− 2 + 15 log
D
λ
. (2)
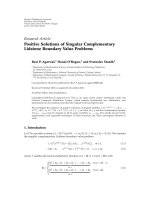
Figure 3 shows the relative amplitude response with the off-
axis angle, φ
h
, of the transmitting HUT antenna using (1).
2.3. GEO satellite system
A GEO satellite system consists of a GEO receiver in a space
station and an ES on the ground. An interference criterion of
−150.5 dB (W/MHz) is used for the satellite system defined
4 EURASIP Journal on Wireless Communications and Networking
Table 2: HUT transmitter parameters.
Coverage area
(Total number
of terminals)
Power density, P
t
,
(dB(W/MHz))
Maximum
antenna gain,
G
max
, (dBi)
Bandwidth, B,
(MHz)
UAC (100) −8.2 23 2
SAC (100)
−7382
RAC (100)
−1.5 38 2
φ
h
(degrees)
01020304050
Relative amplitude response (dB)
−50
−40
−30
−20
−10
0
G
max
= 23 dBi
G
max
= 38 dBi
Figure 3: Antenna beam patterns for the HUT.
in [9]. For the GEO receiver, antenna beam pattern of [15],
G
s
(φ
s
), is used, as expressed by
G
s
(φ
s
)=
⎧
⎪
⎪
⎪
⎪
⎪
⎪
⎪
⎪
⎪
⎪
⎪
⎪
⎪
⎪
⎪
⎪
⎪
⎪
⎪
⎨
⎪
⎪
⎪
⎪
⎪
⎪
⎪
⎪
⎪
⎪
⎪
⎪
⎪
⎪
⎪
⎪
⎪
⎪
⎪
⎩
G
max
− 3
φ
s
φ
3dB
2
, φ
3dB
≤ φ
s
≤ 2.58φ
3dB
,
G
max
− 25, 2.58φ
3dB
<φ
s
≤ 6.32φ
3dB
,
G
max
−25+25 log φ
s
,6.32φ
3dB
<φ
s
≤ 6.32φ
3dB
×10
0.04(G
max
−25)
,
0, 6.32φ
3dB
10
0.04(G
max
−25)
<φ
s
≤ 90
◦
,
−10 + 0.25G
max
,90
◦
<φ
s
≤ 180
◦
.
(3)
Here, the maximum antenna gain, G
max
for the satellite
receiver is 51.8dBi and one-half the 3 dB beamwidth, φ
3dB
,
is given by [15]
φ
3dB
≈ 10
(44.5−G
max
)/20
. (4)
Figure 4 shows the antenna beam pattern using the off-axis
angle φ
s
of a satellite receiver. To compare the coverage of the
satellite with that of HAPS, the diameter of the coverage, l
c
is
calculated in km using
l
c
=
2 × 36,000
tan(90
◦
− φ
3dB
)
. (5)
φ
s
(degrees)
0 5 10 15 20
Relative amplitude response (dB)
−70
−60
−50
−40
−30
−20
−10
0
Figure 4: Antenna beam pattern for the GEO receiver.
The service coverage of a satellite on the ground is approx-
imately 271 km in diameter at the equator. The coverage
includes all of the HUTs in UAC and SAC as well as most of
them in RAC, implying that the GEO receiver may experience
strong interference from the HUTs.
3. ESTIMATION OF THE INTERFERENCE LEVEL
In this section, the methodology that calculates the inter-
ference level from the HUTs to the GEO receiver is pre-
sented. Figure 5 shows the geometric configuration for the
estimation of the interference between the HAPS and satellite
systems. Referring to the 3D coordinate configuration in
Figure 1, the coordinates of the ith HUT, HUT
i
,aredenoted
as (x
i
, y
i
, z
i
). Similarly, the coordinates of the HAPS platform,
the GEO receiver, and the ES are (0, y
h
, z
h
), (0, h
s
,0), and
(0, y
e
, z
e
), respectively. The angle φ
i
h
represents the off-axis
angle to the satellite from the main beam of the transmitting
HUT
i
antenna. The angle φ
i
s
represents the off-axis angle
from the main beam of the receiving satellite antenna to the
HUT
i
.
The estimated receiving interference power density
received by the GEO receiver can be calculated as [9]
P
r
=
i
P
i
t
+ G
h
(φ
i
h
)+G
s
(φ
i
s
) − L
a
(θ
i
)
− 10 log B − 20 log
4πd
λ
− 60
, dB(W/MHz),
(6)
where P
i
t
is the transmitting output power density from the
ith HUT, G
h
(φ
i
h
) is the transmitting antenna gain for the
Bon-Jun Ku et al. 5
GEO receiver (0, h
s
,0)
HAPS platform
(0, y
h
, z
h
)
HUT
i
(x
i
, y
i
, z
i
)
HUT
j
(x
j
, y
j
, z
j
)
HAPS nadir
Earth station of satellite (ES)
(0, y
e
, z
e
)
Transmitting beams
for HUTs
Receiving beam
for GEO receiver
φ
j
h
φ
i
h
φ
i
s
φ
j
s
Desired path
Interfering path
Figure 5: Geometric configuration for interference estimation.
off-axis angle φ
i
h
of the ith HUT, G
s
(φ
i
s
) is the receiving
antenna gain for the off-axis angle φ
i
s
of the satellite antenna,
L
a
(θ
i
) is atmospheric absorption for the elevation angle from
θ
i
the ith HUT, λ is the wavelength in meters, and d is the
distance between the HUT and the satellite in km. Thus, P
r
can be regarded as the aggregated interference power from all
HUTs.
In order to estimate P
r
in (6), 300 locations of HUTs
were randomly generated. The antenna gain with the off-
axis angles for the HUTs and the GEO receiver were initially
obtained. The off-axis angles, φ
i
h
and φ
i
s
, can be calculated
from
φ
i
h
= cos
−1
l
i
h
p
2
+
l
i
h
s
2
−
l
i
p
s
2
2·
l
i
h
p
2
·
l
i
h
s
2
,
φ
i
s
= cos
−1
l
i
h
s
2
+
l
i
s
e
2
−
l
i
h
e
2
2·
l
i
h
s
2
·
l
s e
2
,
(7)
where l
i
h
p
, l
i
h
s
, l
i
p
s
, l
s e
,andl
i
h
e
represent the path lengths
from HUT
i
to the HAPS platform, from HUT
i
to the GEO
receiver, from the HAPS platform to the GEO receiver, from
the GEO receiver to the ES, and from HUT
i
to the ES,
respectively. The path lengths can be obtained from the
coordinates of the HUTs, the HAPS platform, the GEO
receiver, and the ES.
Here, the propagation attenuation term
L
a
(θ
i
)
in (6)
is considered. Assuming that the height of HUTs is zero,
the atmosphere attenuation
L
a
(θ
i
)
is defined by (8)in
the frequency band from 47.9 GHz to 48.2 GHz [8]. This
depends on the elevation angle θ
i
of the ith HUT and the
latitude φ
e
of the HAPS platform:
L
a
(θ
i
)=
⎧
⎪
⎪
⎪
⎪
⎪
⎪
⎪
⎪
⎪
⎪
⎪
⎪
⎨
⎪
⎪
⎪
⎪
⎪
⎪
⎪
⎪
⎪
⎪
⎪
⎪
⎩
57.90
1+A
1
θ
i
+ A
2
θ
2
i
−A
3
θ
3
i
+ A
4
θ
4
i
,0
◦
≤ φ
e
<22.5
◦
,
53.06
1+B
1
θ
i
+ B
2
θ
2
i
− B
3
θ
3
i
+ B
4
θ
4
i
,22.5
◦
≤ φ
e
<45
◦
,
53.21
1+C
1
θ
i
+ C
2
θ
2
i
− C
3
θ
3
i
+ C
4
θ
4
i
, φ
e
≥ 45
◦
.
(8)
Here, the constants from A
1
to C
4
are given by Ta bl e 3.
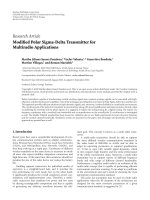
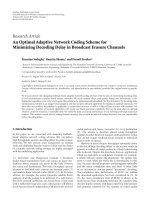
One thousand independent simulations were run and
the CDF of the interference levels was then estimated.
Figure 6 shows the estimated CDF, that is, the cumulative
probability of interference, I, that is less than or equal to
I
0
in the x-abscissa. It was found that the interference level
increases as the HAPS platform moves to a higher latitude,
as the possibility that HUTs at higher latitudes can face
directly toward a GEO receiver is high. For example, if the
latitude of the HAPS platform is greater than 50 degrees, the
probability of the aggregate interference to the GEO receiver
exceeding the interference criterion is 100%. If the latitude
of the HAPS platform is 30 degrees, the probability of the
aggregate interference satisfying the criterion is only 10%.
This implies that a proper interference mitigation scheme
(IMS) is required.
6 EURASIP Journal on Wireless Communications and Networking
Table 3: Constant values.
Constants Values Constants Values Constants Values
A
1
0.7262 B
1
0.6962 C
1
0.6864
A
2
0.03534 B
2
0.03555 C
2
0.03632
A
3
0.001074 B
3
0.001076 C
3
0.001103
A
4
0.7826 × 10
−5
B
4
0.7840 × 10
−5
C
4
0.8073 × 10
−5
Interference, I
0
(dB(W/MHz))
−152 −148 −144 −140 −136 −132
Probability [I<= I
0
](%)
0
20
40
60
80
100
Latitude of HAPS platform, φ
e
30 degrees
50 degrees
70 degrees
75 degrees
Interference criterion
(Section 2.3)
Figure 6: Interference level with the latitude of the HAPS platform
φ
e
.
4. INTERFERENCE ANALYS IS USING
CONVENTIONAL APPROACHES
4.1. FSSD approach
The separation distance can be considered as an easy means
of determining the sharing condition between wireless
systems. In a previous study by [9, 16], the separation
distance satisfying the criterion of a GEO receiver was
estimated. Figure 7 shows the minimum separation distance,
d
s
, required to satisfy the interference criterion according
to various HAPS platform latitudes as represented by φ
e
.If
the HAPS platform is located at the latitudes φ
e
= 0
◦
, the
separation distance d
s
should be more than 145 km between
the HAPS nadir and the ES. As more HUTs face a GEO
receiver as the latitude of the HAPS platform φ
e
increases,
a greater separation distance is needed at a higher latitude.
FSSD is a simple but inefficientwaytobringthisabout,
as a very long separation distance may be required for two
systems to use the same frequency bands.
4.2. FSPC approach
As an alternate approach to FSSD, FSPC can be used. In this
section, the concept and results of a performance evaluation
of the FSPC are given, and several problems when applying
Latitude of HAPS platform, φ
e
(degrees)
0 102030405060
Minimum separation distance, d
s
(km)
100
150
200
250
300
350
400
450
500
550
Figure 7: Separation distance with the latitude of the HAPS
platform φ
e
.
it are discussed using the contribution results to ITU-R
originally proposed by [12].
HAPS using frequency bands of 47-48 GHz may expe-
rience significant rain attenuation; such a system requires a
sufficient rain attenuation margin to overcome it. However,
during most clear-sky days, these relatively high margins
have been shown to result in harmful interference to a
satellite system [9]. This implies that an appropriate power
control mechanism can reduce the interference level. A
methodology to determine the minimum required power
level for the HUT using FSPC was investigated, and the
results are presented in the Recommendation ITU-R SF.1843
[12]. The results show that perfect sharing can be achieved
between HUTs and a GEO receiver in a cocoverage area, that
is, without any distance separation.
In the FSPC scheme, the transmit power level of the
HUT is controlled. This reduces the harmful interference
in the direction of a GEO receiver. If HUTs are equipped
with power control systems, they can reduce or increase
the transmit power depending on the conditions and not
exceed the interference criterion of the GEO receiver in a
cocoverage area. In clear-sky conditions, HUTs reduce these
power levels, and on rainy days, they increase the power up
to the rain attenuation margin defined in [13].
Figure 8 shows the CDF of the interference levels for
the FSPC scheme according to various latitudes of the
HAPS platform φ
e
.Apowercontrolrange,P
R
,of5dB
as defined in [12]isusedhere;Figure 8 shows that the
interference levels do not exceed the interference criterion
Bon-Jun Ku et al. 7
Interference, I
0
(dB(W/MHz))
−160 −158 −156 −154 −152 −150
Probability [I<= I
0
](%)
0
20
40
60
80
100
Latitude of HAPS platform, φ
e
(degrees)
30
50
55
60
Interference criterion
(Section 2.3)
Figure 8: Interference level with the latitude of an HAPS platform
φ
e
,usingtheFSPCscheme(P
R
= 5dB).
with any φ
e
value. However, any HUTs power control failure
may cause a power loss of up to 5 dB, which can lead to
serious performance degradation of the HAPS system. In
addition, as shown in Figure 9, if a HUT is located at a
border of a rainy region and a clear-sky region, the signal
path from the HUT to the satellite does not experience any
rain attenuation, which may cause strong interference. For
this reason, an efficient technique to control the antenna
sidelobes is required, leading to an efficient beamforming
technique. This is investigated in detail in the next section.
5. A NEW ANALYSIS RESULTS
5.1. Ideal ABS approach
5.1.1. Basic concept
Adaptive beamforming can provide an efficient means of
interference mitigation. Figure 10 shows an example of a
HUT system with an adaptive beamforming device. The
system consists of receiving and transmitting beamformers.
The number of elements, M, determines the antenna gain of
the HUT. The incident wave impinges on the array at any
angles that are normal to the array surface. The signal in
each branch is weighted in order to point to the target. It
is assumed that the same weighting vectors are used in the
receiver and the transmitter, that is, [w
in
0
, w
in
1
, , w
in
M
−1
] =
[w
out
0
, w
out
1
, , w
out
M
−1
]. This is discussed in Section 5.1.2.
It is assumed that the system is equipped with a
minimum-variance beamformer (MVB) in [17] and that
the HUT can estimate the optimum weighting vectors to
reduce the interference signal in the direction of the GEO
receiver. Here, the antenna beam pattern of the MVB for the
interference analysis is presented. MVB is used to minimize
the variance of the input signals with the interfered signals,
satisfying the constraint in which the power for the desired
direction should be characterized by unity. Assuming M
HAPS platform
GEO receiver
HUT
HUT
HUT
HUT
Rainy region
Clear-sky region
Desiredpathwiththereducedrainattenuationmargin
Interfering path with the reduced rain attenuation margin
Desiredpathwiththemaximumrainattenuationmargin
Interfering path with the maximum rain attenuation margin
Figure 9: Scenario in the case of strong interference.
linear array elements spaced by a half wavelength between
them in the receiving module, this concept can be expressed
as [18]
w
= arg
w
∗
a(θ
e
)=1
min w
∗
R
x
w,(9)
where w is the M-by-1 optimum weighting vector of the
beamformer, R
x
is the M-by-M correlation matrix of the
received signal covariance, and a(θ
e
) is the M-by-1 steering
vector with the electrical angle θ
e
related to the angle of
incidence φ
h
that is normal to the array surface defined by
θ
e
= π sin φ
h
. (10)
Here, T and
∗ represent the transposition of a matrix and
complex conjugate of the matrix.
Generally, it is possible to solve the optimum solution
givenin(9) using the method of Lagrange [18, 19].
Combining the variance equation defined by w
∗
R
x
w with the
constrained part w
∗
a(θ
e
) = 1gives
w
mv
=
R
−1
x
a(θ
e
)
a(θ
e
)
∗
R
−1
x
a(θ
e
)
. (11)
The MVB with the optimal solution (11), having been
designed to minimize w
∗
R
x
w in (9) while preserving the
8 EURASIP Journal on Wireless Communications and Networking
Tr an sce iv er
of HUT
Weighting
values
estimator
Weighting vector
Received signals
Beamformer
Weighting vector
.
.
.
.
.
.
w
in
0
w
in
1
w
in
M
−1
y
in
(t)
w
out
0
w
out
M
−2
w
out
M
−1
y
out
(t)
Figure 10: Block diagram for the HUT using ABS.
signal for the direction of the HAPS platform, imposes a null
in the direction of GEO.
Via (11), the antenna beam pattern of the MVB can be
expressed as
G(φ
h
) = 10 log
10
w
H
mv
a(θ
e
)
2
. (12)
5.1.2. Analysis on the frequency translation effect
In the previous section, it was assumed that the same
weighting vectors are used in the receiver and the transmitter.
Here, the effect of this is analyzed. The concept of the
reuse of the weight has been introduced for land mobile
cellular systems [20]. For the time-division duplex (TDD),
the weight obtained during the receiving time slot can be
reused in the transmitting time slot as a fixed parameter, as
the carrier frequency of the uplink, f
u
, is equal to that of the
downlink, f
d
. This no longer holds for the frequency-division
duplex (FDD) [20, 21]. Generally, utilizing the same array
weight gives rise to null positioning error between the up-
and down-link, as the antenna element spacing normalized
by the wavelength varies in proportion to the difference
in frequency. A good example of this is a beamforming
system with FDD in the IMT-2000 frequency bands that
uses a carrier frequency of 2140 MHz for the downlink
and 1950 MHz for the uplink. Figure 11 compares the
beam patterns of the receiver and the transmitter when the
interfering signal is at 25 degrees. If the same array weights
are used for the receiver and the transmitter, a comparatively
large null pointing error of approximately 2.5 degrees is
produced. This is shown in Figure 11. To address this issue,
Ohgane proposed the reconfiguration of the weight vector by
comparing the transmitting and receiving array patterns and
adjusting the weight value for transmission [20].
This is analyzed in the application of HAPS FDD
system. According to Resolution 122 (Rev. WRC-2007), the
frequency bands 47.9–48.2 GHz and 47.2–47.5 GHz, each
φ
h
(degrees)
−80 −60 −40 −20 0 20 40 60 80
Amplitude response (dB)
−60
−40
−20
0
20
f
u
: 1950 MHz
f
d
: 2140 MHz
Null positioning error
Figure 11: Comparison of the beam patterns of the receiver and
transmitter using IMT-2000 frequency bands.
with 300 MHz bandwidth, can be used for the HAPS.
Here, 48.05 GHz is used as the carrier frequency of the
uplink, f
u
, and 47.35 GHz is used as the carrier frequency
of the downlink, f
d
. The bandwidth of 300 MHz is very
narrow in the target frequency bands, as the percentage
of the bandwidth for the carrier frequency is only 0.62%.
Figure 12 compares the beam patterns of the receiver and the
transmitter when the interfering signal is at 25 degrees. As
shown in the figure, the beam patterns are nearly identical
for f
u
and f
d
, despite the fact that the same weights are used
for the receiver and the transmitter. This implies that the
same weighting factors can be used without any performance
degradation.
Bon-Jun Ku et al. 9
φ
h
(degrees)
−80 −60 −40 −20 0 20 40 60 80
Amplitude response (dB)
−60
−40
−20
0
20
f
d
:47.35GHz
f
u
:48.05GHz
Figure 12: Comparison of the beam pattern of the receiver and the
transmitter of the HUT using MVB.
5.1.3. Interference analysis results
An important factor related to the reduction of the interfer-
ence that is harmful to the GEO receiver is that a very low
sidelobe level of the HUTs that face the GEO receiver should
be obtained. The same analysis procedure from (6)to(8)
used in the previous section is followed using the antenna
beampatternin(12).
Figure 13 shows an example of the adaptive beam
patterns when the G
max
values of the HUT are 23 dBi and
38 dBi, respectively, (see Tab le 2). In this example, the desired
and interfering direction is 0 and 30 degrees, respectively.
When the antenna beam patterns in (12) are used for the
transmitting beams, a symmetric beam for all direction can
be assumed by extending the 2D antenna beam pattern in
Figure 13 to 3D. As shown in Figure 14, when the ABS is
applied to the HUTs, two systems can share a cocoverage
without any power reduction in the HUTs.
5.2. Hybrid approach
The ABS can cause pointing errors at the null, which may
introduce harmful interference to other systems. In order to
offset this pointing error, the FSPC approach can be used
in conjunction with the ABS. The effect of the error due to
the null pointing mismatch on the amount of interference to
the satellite is initially analyzed. It is assumed that M linear
array elements with the uniform amplitude distribution
experience pointing error at the null defined by [22]
σ
2
Δ
=
12
M
3
σ
2
Φ
, (13)
where σ
2
Δ
is the variance of the pointing error and σ
2
Φ
is the
phase error variance. The parameters σ
Φ
of contemporary
microwave amplifiers can provide a phase nonidentity within
a limit of 10 degrees [23]. In the case of phase distribution
errors of 5 and 10 degrees, the total range of the pointing
φ
h
(degrees)
−80 −60 −40 −20 0 20 40 60 80
Amplitude response (dB)
−50
−40
−30
−20
−10
0
10
20
30
(a) G
max
= 23 dBi, M = 10
φ
h
(degrees)
−80 −60 −40 −20 0 20 40 60 80
Amplitude response (dB)
−40
−30
−20
−10
0
10
20
30
40
(b) G
max
= 38 dBi, M = 46
Figure 13: An example of an antenna beam pattern using ABS.
Interference, I
0
(dB(W/MHz))
−170 −165 −160 −155 −150 −145
Probability [I<= I
0
](%)
0
20
40
60
80
100
Without any IMS scheme
FSPC (P
R
= 5dB)
Ideal ABS
Interference criterion (Section 2.3)
Figure 14: CDF of interference levels for ideal ABS and FSPC
schemes.
10 EURASIP Journal on Wireless Communications and Networking
Interference, I
0
(dB(W/MHz))
−170 −165 −160 −155 −150 −145
Probability [I<= I
0
](%)
0
20
40
60
80
100
Pointing error, σ
Δ
0degree
1degrees
2degrees
Interference criterion (Section 2.3)
Figure 15: CDF of interference levels according to the pointing
errors, σ
Δ
.
error is approximately 1 and 2 degrees, respectively. Figure 15
shows the CDF of the interference levels according to various
pointing error values. If pointing errors are not controlled
within at least 1 degree, the aggregated interference level may
exceed this criterion. In order to overcome the increase in
the interference due to the pointing error, a hybrid method
that combines ABS with FSPC can be used. The advantage
of the hybrid scheme can be understood by comparing the
required power control range that regulates the interference
to the satellite. A large power control range indicates a high
probability of system outage in case of failure or error in
power control scheme. Therefore, the outage probability can
be reduced using the ABS with the reduced power control
range. Figure 16 shows the required power control range
according to the σ
Δ
value of the ABS scheme compared to
the conventional FSPC scheme. It is clear that, even with
averylargevalueofσ
Δ
, the power control range can be
reduced considerably. For example, the reduction in the
power control range exceeds 50% and 40% if the σ
Δ
value
is 1 and 2 degrees, respectively.
6. CONCLUSION
Sharing issues between FS using HAPS and FSS systems were
studied with a focus on the uplink from HUTs to a GEO
receiver. In this paper, several sharing methodologies based
on the FSSD and FSPC were presented. The FSSD is a simple
approach that avoids harmful interference from HUTs to a
GEO receiver. However it is not desirable in terms of sharing.
The FSPC also has a drawback in that reducing the power
levels of the HUTs may result in performance degradation of
the HAPS system.
In this paper, an interference mitigation effect was
demonstrated by applying the ABS to HUTs in a manner
that overcomes the aforementioned drawbacks. However,
HUTs using ABS may give rise to interference that is harmful
to a satellite receiver when an amount of beam pointing
error exists due to phase disturbance on the array antenna
Pointing error, σ
Δ
(degrees)
00.511.52
Power control range, P
R
(dB)
0
1
2
3
4
5
FSPC with P
R
= 5dB
Hybrid scheme
Figure 16: Power control range, P
R
, according to the pointing
errors, σ
Δ
.
elements. Finally, a hybrid approach combining FSPC with
ABS considering the beam pointing errors was presented.
From the analysis results, it was shown that the two systems
can share the same frequency bands in a cocoverage case even
when beam pointing errors pertaining to HUTs exist. The
present analysis results reveal that an ABS scheme combined
with FSPC can reduce the power control range by 40%
compared to a conventional FSPC scheme.
ACKNOWLEDGMENTS
This work was supported by the IT R&D program of
KCC/IITA[2008-F-013-01, Development of spectrum engi-
neering and millimeterwave utilizing technology]. The
authors wish to thank Professor Dr. Sooyoung Kim for useful
discussions that significantly improved earlier versions of this
paper.
REFERENCES
[1] T. C. Tozer and D. Grace, “High-altitude platforms for wireless
communications,” Electronics & Communication Engineering
Journal, vol. 13, no. 3, pp. 127–137, 2001.
[2] Radio Regulations, Footnote 1.66A, International Telecom-
munication Union (ITU), 2004.
[3] D. Grace, J. Thornton, G. Chen, G. P. White, and T. C.
Tozer, “Improving the system capacity of broadband services
using multiple high-altitude platforms,” IEEE Transactions on
Wireless Communications, vol. 4, no. 2, pp. 700–709, 2005.
[4] B. Taha-Ahmed, M. Calvo-Ramon, and L. de Haro-Ariet,
“High altitude platforms (HAPs) W-CDMA system over
cities,” in Proceedings of the 61st IEEE Vehicular Technology
Conference (VTC ’05), vol. 4, pp. 2673–2677, Stockholm,
Sweden, May-June 2005.
[5] G. P. White and Y. V. Zakharov, “Data communications to
trains from high-altitude platforms,” IEEE Transactions on
Vehicular Technology, vol. 56, no. 4, pp. 2253–2266, 2007.
[6] Word Radiocommunication Conference Final Acts, ITU, 2003.
Bon-Jun Ku et al. 11
[7] Recommendation ITU-R M.1641, “A methodology for co-
channel interference evaluation to determine separation dis-
tance from a system using high-altitude platform stations
to a cellular system to provide IMT-2000 service within the
boundary of an administration,” ITU, 2006.
[8] Recommendation ITU-R F. 1501, “Coordination distance
for systems in the fixed service (FS) involving high-altitude
platform stations (HAPSs) sharing the frequency bands 47.2–
47.5 GHz and 47.9–48.2 GHz with other systems in the fixed
service,” ITU, 2000.
[9] Recommendation ITU-R SF. 1481-1, “Frequency sharing
between systems in the fixed service using high-altitude
platform stations and satellite systems in the geostationary
orbit in the fixed-satellite service in the bands 47.2–47.5 and
47.9–48.2 GHz,” ITU, 2002.
[10] Resolution 122 (revised in World Radiocommunication Con-
ference (WRC)—2003), “Use of the bands 47.2–47.5 GHz and
47.9–48.2 GHz by high altitude platform stations (HAPS) in
the fixed service and by other services,” ITU, 2003.
[11] Radio Regulations, Footnote 5.552A, International Telecom-
munication Union (ITU), 2004.
[12] Recommendation ITU-R SF. 1843, “Methodology for deter-
mining the power level for ground terminals to facilitate
sharing with space station receivers in the bands 47.2–47.5
GHz and 47.9–48.2 GHz,” ITU, 2007.
[13] Recommendation ITU-R F. 1500, “Preferred characteristics
of systems in the fixed service using high altitude platforms
operating in the bands 47.2–47.5 GHz and 47.9–48.2 GHz,”
ITU, 2000.
[14] Recommendation ITU-R F. 699, “Reference radiation patterns
for fixed wireless system antennas for use in coordination
studies and interference assessment in the frequency range
from 100 MHz to about 70 GHz,” ITU, 2003.
[15] Recommendation ITU-R S. 672, “Satellite antenna radiation
pattern for use as a design objective in the fixed-satellite service
employing geostationary satellites,” ITU, 1997.
[16] B J. Ku, J M. Park, and D S. Ahn, “Analyzing separation
distance from HAPS to satellite earth station in V band,” in
Proceeding of the 21st International Technical Conference in
Circuit/Systems, Computers and Communications (ITC-CSCC
’06), vol. 2, pp. 441–444, Chiang Mai, Thailand, July 2006.
[17] J. Capon, “High-resolution frequency-wavenumber spectrum
analysis,” Proceedings of IEEE, vol. 57, no. 8, pp. 1408–1418,
1969.
[18] S. Haykin, Adaptive Filter Theory, Prentice Hall Information
and System Sciences Series, Prentice Hall, Englewood Cliffs,
NJ, USA, 1996.
[19] J. Litva, Digital Beamforming in Wireless Communications,
Artech House, Boston, Mass, USA, 1996.
[20] T. Ohgane, “Spectral efficiency improvement by base station
antenna pattern control for land mobile cellular systems,”
IEICE Transactions on Communications,vol.E77-B,no.5,pp.
598–605, 1994.
[21] G. Xu and H. Liu, “Effective transmission beamforming
scheme for frequency-division-duplex digital wireless com-
munication systems,” in Proceedings of the 20th IEEE Inter-
national Conference on Acoustics, Speech and Signal Processing
(ICASSP ’95), vol. 3, pp. 1729–1732, Detroit, Mich, USA, May
1995.
[22] R. J. Mailloux, Phased Array Antenna Handbook,Artech
House, Boston, Mass, USA, 1994.
[23] B J. Ku, D S. Ahn, S P. Lee, et al., “Radiation pattern
of multibeam array antenna with digital beamforming for
stratospheric communication system: statistical simulation,”
ETRI Journal, vol. 24, no. 3, pp. 197–204, 2002.