Wireless Sensor Networks Application Centric Design 2011 Part 2 docx
Bạn đang xem bản rút gọn của tài liệu. Xem và tải ngay bản đầy đủ của tài liệu tại đây (3.18 MB, 30 trang )
Wireless Sensor Networks for On-field Agricultural Management Process
19
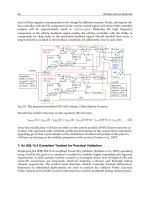
A WSN system was developed according to the afore mentioned requirements. The system,
shown in Fig. 1, comprises a self-organizing mesh WSN endowed with sensing capabilities, a
GPRS Gateway, which gathers data and provides a TCP-IP based connection toward a Remote
Server, and a Web Application, which manages information and makes the final user capable
of monitoring and interacting with the instrumented environment.
NODE 4
GPRS GATEWAY
TCP-IP
over
GPRS
NODE 3
NODE 1
NODE 2
WEB INTERFACE
REMOTE SERVER
Fig. 1. Wireless Sensor Network System
3. Hardware Design
Focusing on an end-to-end system architecture, every constitutive element has to be selected
according to application requirements and scenario issues, especially regarding the hardware
platform. Many details have to be considered, involving the energetic consumption of the sensor readings, the power-on and power-save status management and a good trade-off between
the maximum radio coverage and the transmitted power. After an accurate investigation
of the out-of-the-shelf solutions, 868 MHz Mica2 motes (Mica2 Series, 2002) were adopted according to these constraints and to the reference scenarios. The Tiny Operative System (TinyOS)
running on this platform ensures full control of mote communication capabilities to attain optimized power management and provides necessary system portability towards future hardware advancements or changes. Nevertheless, Mica2 motes are far from perfection, especially
in the RF section, since the power provided by the transceiver (Chipcon CC1000) is not completely available for transmission. However, it is lost to imperfect coupling with the antenna,
thus reducing the radio coverage area. An improvement of this section was performed, using
more suitable antennas and coupling circuits and increasing the transmitting power with a
power amplifier, thus increasing the output power up to 15 dBm while respecting international restrictions and standards. These optimizations allow for greater radio coverage (about
20
Wireless Sensor Networks: Application-Centric Design
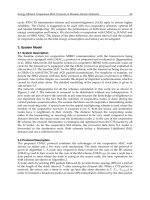
200 m) and better power management. In order to manage different kinds of sensors, a compliant sensor board was adopted, allowing up to 16 sensor plugs on the same node;, this makes a
single mote capable of sensing many environmental parameters at a time (Mattoli et al., 2005).
Sensor boards recognize the sensors and send Transducer Electronic Datasheets (TEDS) through
the network up to the server, making it possible for the system to recognize an automatic
sensor. The overall node stack architecture is shown in Fig. 2.
Overall size: 58x32x25 mm
Sensor Board
Power Board
Communication Board
Fig. 2. Node Stack Architecture
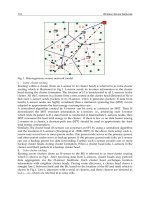
The GPRS embedded Gateway, shown in Fig. 3, is a stand-alone communication platform
designed to provide transparent, bi-directional wireless TCP-IP connectivity for remote monitoring. In conjunction with Remote Data Acquisition (RDA) equipment, such as WSN, it acts
when connected with a Master node or when directly connected to sensors and transducers
(i.e., Stand-Alone weather station, Stand-Alone monitoring camera).
Fig. 3. GPRS Gateway
The main hardware components that characterize the gateway are:
• a miniaturized GSM/GPRS modem, with embedded TCP/IP stack (Sveda et al.,
2005), (Jain et al., 1990);
• a powerful 50 MHz clock microcontroller responsible for coordinating the bidirectional
data exchange between the modem and the master node to handle communication with
the Remote Server;
Wireless Sensor Networks for On-field Agricultural Management Process
21
• an additional 128 KB SRAM memory added in order to allow for data buffering, even
if the wide area link is lost;
• several A/D channels available for connecting additional analog sensors and a battery
voltage monitor.
Since there is usually no access to a power supply infrastructure, the hardware design has
also been oriented to implement low power operating modalities, using a 12 V rechargeable
battery and a 20 W solar panel.
Data between the Gateway and Protocol Handler are carried out over TCP-IP communication and encapsulated in a custom protocol; from both local and remote interfaces it is also
possible to access part of the Gateway’s configuration settings. The low-level firmware implementation of communication protocol also focuses on facing wide area link failures. Since
the gateway is always connected with the Remote Server, preliminary connectivity experiments demonstrated a number of possible inconveniences, most of them involving the Service
Provider Access Point Name (APN) and Gateway GPRS Support Node (GGSN) subsystems. In
order to deal with these drawbacks, custom procedures called Dynamic Session Re-negotiation
(DSR) and Forced Session Re-negotiation (FSR), were implemented both on the gateway and on
the CMS server. This led to a significant improvement in terms of disconnection periods and
packet loss rates.
The DSR procedure consists in a periodical bi-directional control packet exchange, aimed
at verifying the status of uplink and downlink channels on both sides (gateway and CMS).
This approach makes facing potential deadlocks possible if there is asymmetric socket failure,
which is when one device (acting as client or server) can correctly deliver data packets on the
TCP/IP connection but is unable to receive any. Once this event occurs (it has been observed
during long GPRS client connections, and is probably due to Service Provider Access Point
failures), the DSR procedure makes the client unit to restart the TCP socket connection with
the CMS.
Instead, the FSR procedure is operated on the server side when no data or service packets are
received from a gateway unit and a fixed timeout elapses: in this case, the CMS closes the
TCP socket with that unit and waits for a new reconnection. On the other side, the gateway
unit should catch the close event exception and start a recovery procedure, after which a
new connection is re-established. If the close event should not be signaled to the gateway
(for example, the FSR procedure is started during an asymmetric socket failure), the gateway
would anyway enter the DSR recovery procedure.
In any case, once the link is lost, the gateway unit tries to reconnect with the CMS until a
connection is re-established.
4. Protocol Design
The most relevant system requirements, which lead the design of an efficient Medium Access
Control (MAC) and routing protocol for an environmental monitoring WSN, mainly concern
power consumption issues and the possiblity of a quick set-up and end-to-end communication
infrastructure that supports both synchronous and asynchronous queries. The most relevant
challenge is to make a system capable of running unattended for a long period, as nodes are
expected to be deployed in zones that are difficult to maintain. This calls for optimal energy
management since a limited resource and node failure may compromise WSN connectivity.
Therefore, the MAC and the network layer must be perfected ensuring that the energy used
is directly related to the amount of handled traffic and not to the overall working time.
22
Wireless Sensor Networks: Application-Centric Design
Other important properties are scalability and adaptability of network topology, in terms of
number of nodes and their density. As a matter of fact, some nodes may either be turned off
may join the network afterward.
Taking these requirements into account, a MAC protocol and a routing protocol were implemented.
4.1 MAC Layer Protocol
Taking the IEEE 802.11 Distributed Coordination Function (DCF) (IEEE St. 802.11, 1999) as
a starting point, several more energy efficient techniques have been proposed in literature to
avoid excessive power waste due to so called idle listening. They are based on periodical
preamble sampling performed at the receiver side in order to leave a low power state and
receive the incoming messages, as in the WiseMAC protocol (El-Hoiydi et al., 2003). Deriving
from the classical contention-based scheme, several protocols (S-MAC (Ye et al., 2002), TMAC
(Dam & Langendoen, 2003) and DMAC (Lu et al., 2004)) have been proposed to address the
overhead idle listening by synchronizing the nodes and implementing a duty cycle within
each slot.
Resorting to the above considerations, a class of MAC protocols was derived, named Synchronous Transmission Asynchronous Reception (STAR) which is particularly suited for a flat network topology and benefits from both WiseMAC and S-MAC schemes. More specifically, due
to the introduction of a duty-cycle, it joins the power saving capability together with the advantages provided by the offset scheduling, without excessive overhead signaling. According
to the STAR MAC protocol, each node might be either in an idle mode, in which it remains for
a time interval Tl (listening time), or in an energy saving sleeping state for a Ts (sleeping time).
The transitions between states are synchronous with a period frame equal to T f = Tl + Ts partitioned in two sub-intervals; as a consequence, a duty-cycle function can also be introduced:
d=
Tl
Tl + Ts
(1)
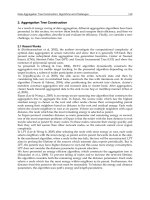
To provide the network with full communication capabilities, all the nodes need to be weakly
synchronized, meaning that they are aware at least of the awaking time of all their neighbors.
To this end, as Fig. 4 shows, a node sends a synchronization message (SYNC) frame by frame
to each of its neighbor nodes known to be in the listening mode (Synchronous Transmission),
whereas, during the set-up phase in which each node discovers the network topology, the control messages are asynchronously broadcasted. On the other hand, its neighbors periodically
awake and enter the listening state independently (Asynchronous Reception). The header of
the synchronization message contains the following fields: a unique node identifier, the message sequence number and the phase, or the time interval after which the sender claims to be
in the listening status waiting for both synchronization and data messages from its neighbors.
If the node is in the sleeping status, the phase φ is evaluated according to the following rule:
φ1 = τ − Tl
(2)
φ2 = τ + Ts
(3)
where τ is the time remaining to the next frame beginning. Conversely, if the mote is in the
listening status, φ is computed as:
In order to fully characterize the STAR MAC approach, the related energy cost normalized
can be evaluated as it follows:
Wireless Sensor Networks for On-field Agricultural Management Process
23
Tl
Ts
NODE 1
SYNC
YN
SYNC
YN
Tl
Tf
SYN
SYNC
SYNC
YN
t
SYNC
YN
SYNC
YN
Ts
NODE 2
Tl
Tf
SYNC t
YN
SYNC
YN
YN
Ts SYNC
NODE 3
t
Tf
Fig. 4. STAR MAC Protocol Synchronization Messages Exchange
C = crx dT f + csleep [ T f (1 − d) − NTpkt ] + NCtx
[mAh]
(4)
where csleep and crx represent the sleeping and the receiving costs [mA] and Ctx is the single
packet transmission costs [mAh], T f is the frame interval [s], d is the duty cycle, Tpkt is the
synchronization packet time length [s] and finally N is the number of neighbors. When the
following inequality is hold:
NTpkt
then:
C
(5)
Tf
crx dT f + csleep T f (1 − d) + NCtx
[mAh]
(6)
The protocol cost normalized to the synchronization time is finally:
NCtx
C
= crx d + csleep (1 − d) +
Tf
Tf
[mA]
(7)
As highlighted in Table 1, it usually happens that ctx
csleep
crx , where ctx = Ctx /Tpkt and
Tpkt is the packet transmission time [s] assumed equal to 100 ms as worst case. This means
that the major contribution to the overall cost is represented by the listening period that the
STAR MAC protocol tries to suitably minimize.
crx
12 mA
csleep
0.01 mA
Ctx
30 mAh
ctx
0.001 mA
Table 1. Power Consumption Parameters for the Considered Platform.
In Fig. 5(a) the normalized cost versus the number of neighbor nodes is shown for the S-MAC
and STAR MAC schemes. It is worth noticing that the performance of the proposed protocol
is better with respect to the existing approach for a number of neighbor nodes greater than 7.
In Fig. 5(b) the normalized costs of S-MAC and STAR MAC approaches are compared with
24
Wireless Sensor Networks: Application-Centric Design
0.7
0.7
STAR MAC
S−MAC
0.5
0.4
0.3
0.2
0.1
0
S−MAC
STAR MAC
0.6
Normalized Cost [mA]
Normalized Cost [mA]
0.6
0.5
0.4
0.3
0.2
0.1
1
2
3
4
5
6
7
Neighbour Nodes
8
9
10
11
(a) Normalized Cost vs. Neighbor Nodes
0
1
2
3
4
Duty Cycle [%]
5
6
(b) Normalized Cost vs. Duty Cycle Duration
Fig. 5. STAR MAC Performance
respect to the duty cycle duration for a number of neighbor nodes equal to 8. It is possible to
notice that for d < 3.5% the proposed protocol provide a significant gain.
Nevertheless, for densely deployed or high traffic loaded WSN, STAR MAC approach might
suffers the shortcoming of cost increasing due to the large number of unicasted messages. To
limit this effect, an enhanced approach, named STAR+, was introduced, aiming at minimizing
also the packet transmission cost. According to it, only one synchronization packet is multicasted to all the neigh- bor nodes belonging to a subset, i.e., such that they are jointly awake
for a time interval greater than Tl . This leads to an additional advantage, as the number
of neighbors increases allowing better performance with respect to scalability and a power
saving too. Besides, the synchronization overhead is reduced with a consequent collisions
lowering. Under this hypothesis the normalized cost might be expressed as:
C
KCtx
= crx d + csleep (1 − d) +
Tf
Tf
[mA]
(8)
where K is the number of subsets. Since K ≤ N, the normalized cost results to be remarkably
lowered, especially if number of nodes and duty-cycle get higher, even if the latter case is
inherently power consuming.
4.2 Network Layer Protocol
In order to evaluate the capability of the proposed MAC scheme in establishing effective endto-end communications within a WSN, a routing protocol was introduced and integrated according to the cross layer design principle (Shakkottai et al., 2003). In particular, we refer to
a proactive algorithm belonging to the class link-state protocol that enhance the capabilities
of the Link Estimation Parent Selection (LEPS) protocol. It is based on periodically information
needed for building and maintaining the local routing table, depicted in Table 2. However,
our approach resorts both to the signaling introduced by the MAC layer (i.e., synchronization
message) and by the Network layer (i.e., ping message), with the aim of minimizing the overhead and make the system more adaptive in a cross layer fashion. In particular, the parameters
transmitted along a MAC synchronization message, with period T f , are the following:
• next hop (NH) to reach the gateway, that is, the MAC address of the one hop neighbor;
Wireless Sensor Networks for On-field Agricultural Management Process
25
• distance (HC) to the gateway in terms of number of needed hops;
• phase (PH) that is the schedule time at which the neighbor enter in listening mode according to Equation (2) and Equation (3);
• link quality (LQ) estimation as the ratio of correctly received and the expected synchronization messages from a certain neighbor.
Target
Sink 1
NH HC
A
NA
B
NB
Sink 2
C
NC
D
ND
Table 2. Routing Table General Structure
PH
φA
φB
φC
φD
LQ
ηA
ηB
ηC
ηD
BL
BA
BB
BC
BD
CL
CA
CB
CC
CD
On the other hand, the parameters related to long-term phenomena are carried out by the
ping messages, with period Tp
T f , in order to avoid unnecessary control traffics and, thus,
reducing congestion. Particularly, they are:
• battery level (BL) (i.e., an estimation of the energy available at that node);
• congestion level (CL) in terms of the ratio between the number of packets present in the
local buffer and the maximum number of packets to be stored in.
Once, the routing table has been filled with these parameters, it is possible to derive the proper
metric by means of a weighted summation of them. It is worth mentioning that the routing
table might indicate more than one destination (sink) thanks to the ping messages that keep
trace of the intermediate nodes within the message header.
5. Software and End User Interface Design
The software implementation was developed, considering a node as both a single element
in charge of accomplishing prearranged tasks and as a part of a complex network in which
each component plays a crucial role in the network’s maintenance. As far as the former aspect
is concerned, several TinyOS modules were implemented for managing high and low power
states and for realizing a finite state machine, querying sensors at fixed intervals and achieving
anti-blocking procedures, in order to avoid software failure or deadlocks and provide a robust
stand alone system. On the other hand, the node has to interact with neighbors and provide
adequate connectivity to carry the messages through the network, regardless of the destination. Consequently, additional modules were developed according to a cross layer approach
that are in charge of managing STAR MAC and multihop protocols. Furthermore, other modules are responsible for handling and forwarding messages, coming from other nodes or from
the gateway itself. Messages are not only sensing (i.e., measures, battery level) but also control
and management messages (i.e., synchronization, node reset). As a result, a full interaction
between the final user and the WSN is guaranteed.
The final user may check the system status through graphical user interface (GUI) accessible
via web. After the log-in phase, the user can select the proper pilot site. For each site the
deployed WSN together with the gateway is schematically represented through an interactive
map. In addition to this, the related sensors display individual or aggregate time diagrams
26
Wireless Sensor Networks: Application-Centric Design
for each node with an adjustable time interval (Start/Stop) for the observation. System monitoring could be performed both at a high level with a user friendly GUI and at a low level by
means of message logging.
Fig. 6 shows some friendly Flash Player applications that, based on mathematical models, analyze the entire amount of data in a selectable period and provide ready-to-use information.
Fig. 6(a) specifically shows the aggregate data models for three macro-parameters, such as
vineyard water management, plant physiological activity and pest management. The application, using cross light colors for each parameter, points out normal (green), mild (yellow)
or heavy (red) stress conditions and provides suggestions to the farmer on how to apply pesticides or water in a certain part of the vineyard. Fig. 6(b) shows a graphical representation
of the soil moisture measurement. Soil moisture sensors positioned at different depths in the
vineyard make it possible to verify whether a summer rain runs off on the soil surface or
seeps into the earth and provokes beneficial effects on the plants: this can be appreciated with
a rapid look at the soil moisture aggregate report which, shows the moisture sensors at two
depths with the moisture differences colore in green tones. Fig. 6(c) highlights stress conditions on plants, due to dry soil and/or to hot weather thanks to the accurate trunk diametric
growth sensor that can follow each minimal variation in the trunk giving important information on plant living activity. Finally, Fig. 6(d) shows a vineyard map: the green spots are
wireless units, distributed in a vineyard of one hectare.
6. Real World Experiences
The WSN system described above was developed and deployed in three pilot sites and in a
greenhouse. Since 2005, an amount of 198 sensors and 50 nodes have continuously sent data
to a remote server. The collected data represents a unique database of information on grape
growth useful for investigating the differences between cultivation procedures, environments
and treatments.
6.1 Pilot Sites Description
The first pilot site was deployed in November 2005 on a sloped vineyard of the Montepaldi
farm in Chianti Area (Tuscany - Italy). The vineyard is a wide area where 13 nodes (including
the master node) with 24 sensors, running STAR MAC and dynamic routing protocols were
successfully deployed. The deployment took place in two different steps: during the first one,
6 nodes (nodes 9,10,14,15,16,17) were placed to perform an exhaustive one week test. The
most important result regards the multi-hop routing efficiency, estimated as:
MEU
(9)
Mex
where η MHop is the efficiency, MEU are the messages correctly received by the remote user and
Mex are the expected transmitted messages. For the gateway neighbors, η MHop is very high,
over 90%. However, even nodes far from the gateway (i.e., concerning an end-to-end multihop
path) show a message delivery rate (MDR) of over 80%. This means that the implemented
routing protocol does not affect communication reliability. After the second deployment, in
which nodes 11,12,13,18,19,20 were arranged, the increased number of collisions changed the
global efficiency, thus decreasing the messages that arrived to the end user, except for nodes
18,19,20, in which an upgraded firmware release was implemented. The related results are
detailed in Table 3.
η MHop =
GoodFood Project
Page 1 of 1
GoodFood
EU Integrated Project
Food Safety and Quality On-field Agricultural Management Process
Wireless Sensor Networks forMonitoring with Microsystems
Home
27
Logout
Site 1 - Montepaldi Farm
(a) Aggregate Data Models for Vineyard Water
Management, Plant Physiological Activity and
Pest Management
(b) Soil Moisture Aggregation Report: the upper map represent soil moisture @ 10 cm in the
soil and the lower map represents soil moisture
@ 35cm in the vineyard after a slipping rain
This site requires Macromedia Flash Player. Download it
GoodFood - EU Integrated Project © All rights reserved
This site requires Macromedia Flash Player. Download it
GoodFood - EU Integrated Project © All rights reserved
Powered by
C.S.I.A.F. Università degli Studi di Firenze
Powered by
C.S.I.A.F. Università degli Studi di Firenze
/>
/>
01/10/2009
29/09/2009
(c) Trunk Diametric Growth Diagram: daily and
nightly metabolic phases
(d) Distributed Wireless Nodes in a Vineyard
Fig. 6. Flash Player User Interface
This confirms the robustness of the network installed and the reliability of the adopted communications solution, also considering the power consumption issues: batteries were replaced
on March 11th 2006 in order to face the entire farming season. After that, eleven months passed
before the first battery replacement occurred on February 11th 2007, confirming our expectations and fully matching the user requirements. The overall Montepaldi system has been running unattended for one year and a half and is going to be a permanent pilot site. So far, nearly
2 million samples from the Montepaldi vineyard have been collected and stored in the server
at the University of Florence Information Services Centre (CSIAF), helping agronomist experts
improve wine quality through deeper insight on physical phenomena (such as weather and
soil) and the relationship with grape growth.
The second pilot site was deployed on a farm in the Chianti Classico with 10 nodes and 50
sensors at about 500 m above sea level on a stony hill area of 2.5 hectares. The environmental
28
Wireless Sensor Networks: Application-Centric Design
Location
MDR
Node 9
72.2%
Node 10
73.7%
Node 11
88.5%
Node 12
71.4%
Node 13
60.4%
Node 14
57.2%
Node 15
45.6%
Node 16
45.4%
Node 17
92.1%
Node 18
87.5%
Node 19
84.1%
Table 3. Message Delivery Rate for the Montepaldi Farm Pilot Site
variations of the the ”terroir” have been monitored since July 2007, producing one of the most
appreciated wines in the world.
Finally, the third WSN was installed in Southern France in the vineyard of Peach Rouge at
Gruissan. High sensor density was established to guarantee measurement redundancy and to
provide a deeper knowledge of the phenomena variation in an experimental vineyard where
micro-zonation has been applied and where water management experiments have been performed for studying plant reactions and grape quality.
6.2 Greenhouse
An additional deployment at the University of Florence Greenhouse was performed to let the
agronomist experts conduct experiments even in seasons like Fall and Winter, where plants
are quiescent, thus breaking free from the natural growth trend. This habitat also creates the
opportunity to run several experiments on the test plants, in order to evaluate their responses
under different stimuli using in situ sensors.
The greenhouse environmental features are completely different from those of the vineyard: as
a matter of fact, the multipath propagation effects become relevant, due to the indoor scenario
and the presence of a metal infrastructure. A highly dense node deployment, in terms of
both nodes and sensors, might imply an increased network traffic load. Nevertheless, the
same node firmware and hardware used in the vineyard are herein adopted; this leads to a
resulting star topology as far as end-to-end communications are concerned.
Furthermore, 6 nodes have been in the greenhouse since June 2005, and 30 sensors have constantly monitored air temperature and humidity, plants soil moisture and temperature, differential leaf temperature and trunk diametric growth. The sensing period is equal to 10 minutes, less than the climate/plant parameter variations, providing redundant data storage. The
WSN message delivery rate is extremely high: the efficiency is over 95%, showing that a low
number of messages are lost.
7. VineSense
The fruitful experience of the three pilot sites was gathered by a new Italian company, Netsens,
founded as a spinoff of the University of Florence. Netsens has designed a new monitoring
Wireless Sensor Networks for On-field Agricultural Management Process
29
system called VineSense based on WSN technology and oriented towards market and user
applications.
VineSense exalts the positive characteristics of the experimental system and overcomes the
problems encountered in past experiences, thus achieving an important position in the wireless monitoring market.
The first important outcome of the experimental system, enhanced by VineSense is the idea
of an end-to-end system. Sensors deployed in the field constantly monitor and send measurements to a remote server through the WSN. Data can be queried and analyzed by final users
thanks to the professional and user-friendly VineSense web interface. Qualified mathematic
models are applied to monitoring parameters and provide predictions on diseases and plant
growth, increasing agronomists’ knowledge and reducing costs while paving the road for new
vineyard management.
VineSense improves many aspects of the experimental system, both in electronics and
telecommunications.
The MAC and Routing protocol tested in the previous experimental system showed such important and significant results in terms of reliability that the same scheme was also adopted
in the VineSense system and minimal changes were introduced: the routing protocol is lighter
in terms of data exchange, building the route with different parameters, aimed at increasing
the message success rate, such as master node distance and received signal strength.
A more secure data encryption was adopted in data messages to protect customers from malicious sniffing or to discourage possible competitors from decrypting network data.
Furthermore, a unique key-lock sequence was also implemented on each wireless node to
prevent stealing, ensuring correct use with only genuine Netsens products and only in combination with its master node, which comes from the factory.
The new wireless nodes are smaller, more economical, more robust and suited for vineyard
operations with machines and tractors. The electronics are more fault-tolerant, easier to install and more energy efficient: only a 2200 mAh lithium battery for 2-3 years of continuous
running without human intervention. Radio coverage has been improved up to 350 m and
nodes deployment can be easily performed by end users who can rely on a smart installation
system with instantaneous radio coverage recognition. Some users have also experimented
with larger area coverage, measuring a point-to-point communication of about 600 m in the
line of sight.
Hypothetically, a VineSense system could be composed of up to 255 wireless nodes and more
than 2500 sensors, considering a full sensor set per node, but since it is a commercial system
these numbers are much more than necessary to cover farmers’ needs.
Sensors used in the VineSense system are low-cost, state-of-the-art devices designed by Netsens for guaranteeing the best accuracy-reliability-price ratio. The choice of Netsens to develop custom and reliable sensors for the VineSense system is not only strategic from a marketing point of view, since it frees VineSense from any kind of external problems, such as
external supplying, delays, greater costs and compliancy. It is also a consequence of the ”System Vision”, where VineSense is not only a wireless communication system product, but an
entire system with no ”black holes” inside so as to provide the customer with a complete
system with better support.
The VineSense wireless-sensor unit is shown in Fig. 7(a).
Recovery strategies and communication capabilities of the stand-alone GPRS gateway have
been improved: in fact, data received by wireless nodes are both forwarded in real-time to a
remote server and temporarily stored on board in case of abrupt disconnections; moreover,
30
Wireless Sensor Networks: Application-Centric Design
automatic reset and restart procedures avoid possible software deadlocks or GPRS network
failures. Finally, a high-gain antenna guarantees good GPRS coverage almost everywhere.
The GPRS gateway firmware has been implemented for remotely managing of the acquisition
settings, relieving users of the necessity of field maintenance.
The GPRS gateway communication has been greatly improved introducing new different
communication interfaces, such as Ethernet connection (RJ-45), USB data downloading and
the possibility of driving an external Wi-Fi communication system for short-range transmissions.
Since the beginning of 2010, the ”Always On” connection started to be fully used and it
boosted the VineSense system, enlarging its possible field of application: a complete bidirectional communication was established between the GPRS unit in the field and the remote
server at Netsens. The previous ”one way” data flow, from the vineyard to the internet, was
gone over by a new software release, able to send instantaneous messages from the VineSense
web interface to the field: the monitoring system was changed into the monitoring and control
system, sending automatic, scheduled or asynchronous commands to the gateway station or
to nodes, i.e. to open or close irrigation systems or simply to download a firmware upgrade.
In Fig. 7(b) the GPRS gateway with weather sensors is shown.
(a) VineSense Wireless Unit
(b) VineSense GPRS Gateway
with Weather Sensors
Fig. 7. VineSense Hardware Elements
The web interface is the last part of VineSense’s end-to-end: the great amount of data gathered
by the sensors and stored in the database needs a smart analysis tool to become useful and
usable. For this reason different tools are at the disposal of various kinds of users. On one
hand, some innovative tools such as control panels for real time monitoring or 2D chromatic
maps create a quick and easy approach to the interface. On the other hand, professional plots
and data filtering options allow experts or agronomists to study them more closely.
8. Agronomic Results
The use of VineSense in different scenarios with different agronomic aims has brought a large
amount of important results.
Wireless Sensor Networks for On-field Agricultural Management Process
31
When VineSense is adopted to monitor soil moisture positive effects can be obtained for plants
and saving water, thus optimizing irrigation schedules. Some examples of this application
can be found in systems installed in the Egyptian desert where agriculture is successful only
through wise irrigation management. In such a terroir, plants suffer continuous hydric stress
during daylight due to high air temperature, low air humidity and hot sandy soils with a low
water retention capacity. Water is essential for plant survival and growth, an irrigation delay
can be fatal for the seasonal harvest therefore, a reliable monitoring system is necessary. The
adoption of VineSense in this scenario immediately resulted in continuous monitoring of the
irrigating system, providing an early warning whenever pump failure occurred. On the other
hand, the possibility to measure soil moisture at different depths allows agronomists to decide
on the right amount of water to provide plants; depending on different day temperatures and
soil moisture, pipe schedules can be changed in order to reduce water waste and increase
water available for plants.
An example of different pipe schedules is shown in Fig. 8.
Fig. 8. Different Pipe Schedules in Accordance with Soil Moisture Levels
Originally, the irrigation system was opened once a day for 5 hours giving 20 liters per day
(schedule 1); since sandy soils reach saturation very rapidly most of this water was wasted
in deeper soil layers; afterwards irrigation schedules were changed (schedule 2), giving the
same amount of water in two or more times per day; the water remained in upper soil layers
at plant root level, reducing wastes and increasing the amount of available water for plants,
as highlighted by soil moisture at 60 cm (blue plot).
Another important application of the VineSense system uses the dendrometer to monitor plant
physiology. The trunk diametric sensor is a mechanical sensor with +/− 5 microns of accuracy; such an accurate sensor can appreciate stem micro variations occurring during day and
night, due to the xilematic flux inside the plant. Wireless nodes measure plant diameter every 15 minutes, an appropriate time interval for following these changes and for creating a
plot showing this trend. In normal weather conditions, common physiologic activity can be
recognized by agronomists the same as a doctor can do reading an electrocardiogram; when
air temperature increases and air humidity falls in combining low soil moisture levels, plants
change their activity in order to face water stress, preserve their grapes and especially them-
32
Wireless Sensor Networks: Application-Centric Design
selves. This changed behavior can be registered by the dendrometer and plotted in the VineSense interface, warning agronomists about incoming risks; as a consequence, new irrigation
schedules can be carried into effect.
Fig. 9 shows an example of a plant diametric trend versus air temperature.
Fig. 9. Plant Diametric Trend vs. Air Temperature
The blue plot represents the air temperature in 10 days, from 13th August until the 22nd August
2009 in Italy; the blue line becomes red when the temperature goes over a 35 degree threshold.
During the period in which the temperature is so high, plant stem variations are reduced due
to the lower amount of xilematic flux flowing in its vessels, a symptom of water leakage.
WSN in agriculture are also useful for creating new databases with historical data: storing
information highlighting peculiarities and differences of vineyards provides agronomists an
important archive for better understanding variations in plant production capabilities and
grape ripening. Deploying wireless nodes on plants in interesting areas increases the knowledge about a specific vineyard or a specific terroir, thus recording and proving the specificity
of a certain wine. I.E., the quality of important wines such CRU, coming from only one specific
vineyard, can be easily related to ”grape history”: data on air temperature and humidity, plant
stress, irrigation and rain occurring during the farming season can assess a quality growing
process, that can be declared to buyers.
Finally, VineSense can be used to reduce environmental impact thanks to a more optimized
management of pesticides in order to reach a sustainable viticulture. Since many of the most
virulent vine diseases can grow in wet leaf conditions, it is very important to monitor leaf
wetness in a continuous and distributed way. Sensors deployed in different parts of vineyards
are a key element for agronomists in monitoring risky conditions: since wetness can change
very rapidly during the night in a vineyard and it is not homogeneous in a field, a real time
distributed system is the right solution for identifying risky conditions and deciding when and
where to apply chemical treatments. As a result, chemicals can be used only when they are
strictly necessary and only in small parts of the vineyard where they are really needed, thus
reducing the number of treatments per year and decreasing the amount of active substances
sprayed in the field and in the environment. In some tests performed in 2009 in Chianti, the
amount of pesticides was reduced by 65% compared to the 2008 season.
Wireless Sensor Networks for On-field Agricultural Management Process
33
Leaf wetness sensors on nodes 2 and 3 measure different wetness conditions as shown in Fig.
10. The upper part of the vineyard is usually wetter (brown plot) than the lower part (blue
plot) and sometimes leaf wetness persists for many hours, increasing the risk of attacks on
plants.
Fig. 10. Different Leaf Wetness Conditions in a Small Vineyard
9. Conclusion
This paper deals with the design, optimization and development of a practical solution for
application to the agro-food chain monitoring and control. The overall system was addressed
in terms of the experienced platform, network issues related both to communication protocols
between nodes and gateway operations up to the suitable remote user interface. Every constitutive element of the system chain was described in detail in order to point out the features
and the remarkable advantages in terms of complexity reduction and usability.
To highlight the effectiveness and accurateness of the developed system, several case studies
were presented. Moreover, the encouraging and unprecedented results achieved by this approach and supported by several pilot sites into different vineyard in Italy and France were
shown.
The fruitful experience of some pilot sites was gathered by a new Italian company, Netsens,
founded as a spin off of the University of Florence. Netsens has designed a new monitoring
system called VineSense based on WSN technology and oriented towards market and user
applications. In order to point out the improvements of the new solution respect to the experimental one, the main features of VineSense were described. Moreover, some important
agronomic results achieved by the use of VineSense in different scenarios were sketched out,
thus emphasizing the positive effects of the WSN technology in the agricultural environment.
Nowadays, the application of the solution described in this paper is under investigation to the
more general field of environmental monitoring, due to its flexibility, scalability, adaptability
and self-reconfigurability.
34
Wireless Sensor Networks: Application-Centric Design
10. References
Blackmore, S. (1994). Precision Farming: An Introduction, Outlook on Agriculture Journal, Vol.
23, pp. 275-280.
Wang, N., Zhang, N. & Wang, M. (2006). Wireless sensors in agriculture and food industry Recent development and future perspective, Computers and Electronics in Agriculture
Journal, Vol. 50, pp. 114-120.
Akyildiz, I.F. & Xudong, W. (2005). A Survey on Wireless Mesh Networks, IEEE Communication Magazine, Vol. 43, pp. S23-S30.
Al-Karaki, J. & Kamal, A. (2004). Routing Techniques in Wireless Sensor Networks: a Survey,
IEEE Communication Magazine, Vol. 11, pp. 6-28.
Langendoen, K. & Halkes, G. (2004). Energy-Efficient Medium Access Control, The Embedded
Systems Handbook, pp. 2-30.
Mica2 Series, Avaiable on .
Mattoli, V., Mondini, A., Razeeb, K.M., Oflynn, B., Murphy, F., Bellis, S., Collodi, G., Manes,
A., Pennacchia, P., Mazzolai, B., & Dario, P. (2005). Development of a Programmable
Sensor Interface for Wireless Network Nodes for Intelligent Agricultural Applications, Proceedings of IE 2005, IEEE Computer and Communications Societies, Sydney,
pp. 1-6.
Sveda, M., Benes, P., Vrba, R. & Zezulka, F. (2005). Introduction to Industrial Sensor Networking, Handbook of Sensor Networks: Compact Wireless and Wired Sensing Systems,
pp. 10-24.
Jain, J.N. & Agrawala, A.K. (1990). Open Systems Interconnection: Its Architecture and Protocols,
Elsevier.
IEEE Standard 802.11 (1999). Wireless LAN Medium Access Control (MAC) and Physical Layer
(PHY) Specifications, IEEE Computer Society.
El-Hoiydi, A., Decotignie, J., Enz, C. & Le Roux, E. (2003). WiseMAC, an Ultra Low Power
MAC Protocol for the WiseNET Wireless Sensor Network, Proceedings of SENSYS
2003, Association for Computer Machinery, Los Angeles (CA), pp. 244-251.
Ye, W., Heidemann, J. & Estrin, D. (2002). An Energy-Efficient MAC Protocol for Wireless Sensor Networks, Proceedings of INFOCOM 2002, IEEE Computer and Communications
Societies, New York (NY), pp. 1567-1576.
Dam, T. & Langendoen, K. (2003). An Adaptive Energy-Efficient MAC Protocol for Wireless
Sensor Networks, Proceedings of SENSYS 2003, Association for Computer Machinery,
Los Angeles (CA), pp. 171-180.
Lu, G., Krishnamachari, B. & Raghavendra, C. (2004). Adaptive Energy-Efficient and LowLatency MAC for Data Gathering in Sensor Networks, Proceedings of WMAN 2004,
Institut fur Medien.Informatik, Ulm (Germany), pp. 2440-2443.
Shakkottai, S., Rappaport, T. & Karlsson, P. (2003). Cross-Layer Design for Wireless Networks,
IEEE Communication Magazine, Vol. 41, pp. 77-80.
Wildlife Assessment using Wireless Sensor Networks
35
3
0
Wildlife Assessment using
Wireless Sensor Networks
Harry Gros-Desormeaux, Philippe Hunel and Nicolas Vidot
LAMIA, Université des Antilles et de la Guyane,
Campus de Schœlcher, B.P. 7209, 97275 Schoelcher, French West Indies
France
1. Introduction
The endangered species always drew the attention of the scientific community since their disappearance would cause irreplaceable loss. To help these species to survive, their habitat is
protected by the laws of environmental protection. Sometimes this protection is not enough,
because their natural evolution is the main cause of their disappearance. However, to save
them, it is sometimes possible to transfer them elsewhere that should be similar to their previous habitat to avoid disturbing the balance of wildlife. To model a habitat, several parameters
must be of interest and are generally defined by experts. This is the case for the number of
singing birds which will be studied in this paper.
Today, advances in sensor technology enable the monitoring of species and their habitat at
a very low cost. Indeed, the increasing sophistication of wireless sensors bids opportunities
that enable new challenges in a lot of areas, including the surveillance one. Progress in their
miniaturization leads to micro-sensors of size of cubic millimeters which, used in large quantity, produce huge amounts of data. This paper promotes the use of sensors for monitoring
bird endangered in their habitat. Actual methods for counting endangered birds use mainly
human labor and because they are not really comprehensive leads to poor estimation. The
use of sensors deployed in critical environments can help the census of these species and even
generate new data on their customs.
Among the challenges that the use of the sensor technology enable, energy efficiency is the
most critical for these wireless networks since battery depletion totally disables a sensor. In
addition, designing algorithms for wireless networks stems from the distributed computer
science domain with limited devices. Memory space and computational power are often of a
magnitude less than miles than their desktop counterparts. This paper investigate the problem
and proposes to approximate the number of birds by geometric means derived in a graph
problem.
Our paper is organized as follows. First, Section 2 provides an overview of techniques generally used to estimate the locations of multiple sources with a unknown sensor network.
Section 4 details our heuristics used to count birds. Section 5 introduces a distributed algorithm for counting birds. Experimentation confirms the effectiveness of our counting systems
in Section 6. Then we conclude in Section 7 and gives an overview of our future work.
36
Wireless Sensor Networks: Application-Centric Design
2. Previous Work
Source localization is an area of interest that has been widely studied in these recent years.
A comprehensive review of incentives techniques and source localization has been written by
Krim and Viberg in (Krim & Viberg, 1996) and it is not difficult to understand that problem has
been of particular focus for military needs. Indeed, radar and sonars are a direct application
of source localization.
Several acoustic parameters such as bandwidth, distance sensors, reverberation and thus
change the way the location of the sources are handled. In addition, the algorithms of source
localization depends strongly on physics and rely on the sound characteristics of waveform to
calculate location sources. Waveform audio is known to be broadband (30Hz-15kHz) and sensors usually record the sound from near-field sources. The following presents some algorithms
of interest which satisfy these two properties. Near-fields algorithms like close-formed ones
(Smith. & Abel, 1987) use time delays between sensors location to estimate the source position. However, though they are computationally less expensive than maximum-likelihood
parametric algorithms (Chen et al., 2001a), they cannot handle efficiently multiple sources
(Chen et al., 2001b). Maximum-likelihood (ML) algorithms are inspired by the fact that source
location information is contained in the linear phase shift of the sensor data spectrum obtained through a discrete Fourier Transform applied to the wideband data. However, ML
techniques are dominated by low-cost suboptimal techniques like the well-known MUSIC algorithm (Schmidt, 1986) which leverages spectral calculus on signal and noise subspaces to
find sources locations.
Unlike these approaches, we do not use the acoustic properties of the song of the bird to find
its location. Indeed, we assume that our sensors are simple and only detect songs relevant to
the monitored specie. Further, our sensors are wireless and rely on battery power to function.
It is important to notice that our algorithms do not try to pinpoint birds, but rather estimate
the number of songbirds that inhabit a region. In our case, only approximate geometric information is sufficient to establish this estimate.
3. Recognizing the birdsong
The recognition process of birdsong is the first part of our counting systems. Today, it is true
that the performance levels made in the treatment of audio signals are high, but this requires
large memory and processing power of large size which could exclude limited capacity of
devices such as wireless sensors.
Recognition of species based on acoustic analysis has been widely studied in recent years
and usually falls within the scope of the classification field. This is particularly the case for
recognition of bird songs. Indeed, for a particular song, it is necessary to determine if it belongs
to a specie. For example, the work of Seppo Fagerlund (Fagerlund, 2007) uses support vector
machines to classify the different species of birds based on their songs. Similarly, Jim Cai
et al. (Cai et al., 2007) propose a method recognition based on neural networks to find the
membership of a song to a bird class. Our recognition process, inspired by the work of Rabiner
(Rabiner & Wilpon, 1979), leverages the same mechanics by means of a clustering algorithm
to classify the song.
Figure 1 gives an overview of our wireless counting system.
Wildlife Assessment using Wireless Sensor Networks
37
Fig. 1. The Counting System
Bird Species Recognition Using Clustering
Our classification method is twofold : a parameterization transformation process of the song
in a certain fingerprint, and clustering process to determine its membership.
The parametrization process uses the songs of the birds to create a series of coefficients that
describe the signal. Although various parameterization methods LPC, LPCC, PLP, dots
exist, we use the MFCC Mel Frequency Cepstral Coefficient because our analysis is limited to
a very limited vocabulary on limited devices. Indeed, Christopher Levy compared in (Lévy
et al., 2006) different parameterization methods on small systems such as mobile phones for
reduced vocabulary and have showed that the parameterization based on MFCC is much
more effective for such systems.
38
Wireless Sensor Networks: Application-Centric Design
Once the fingerprint is obtained from the parameterization process, it is added in a set with
other fingerprints, themselves derived from a database containing a large number of songs of
individuals known as the specie. Subsequently, a clustering algorithm (K-Means or EM) is
used on all the fingerprints to determine their similarity and to create one or more clusters in
which will be the bird cluster. For a given footprint, the problem is then to determine its membership to the bird cluster. If that’s the case, data location + Mote timestamp is stored in the
database for further processing counting algorithms. Our recognition results are compelling
because almost all birds are classified correctly in our case.
4. The Counting Algorithm
This section is devoted to our counting heuristics inspired by the triangulation detection used
by R. E. Bell to count owls in the forest (Bell, 1964). Our method differs essentially from the fact
that we do not use semi-directional devices but omni-directional wireless sensors to loosely
locate a birdsong. In our theoretical framework, all motes share the same characteristics building, which means they have the same (processing power, memory, battery, radius of detection,
etc). Optimizing routes in wireless sensors networks here are out of concern. We only focus
on the manner to detect birds in their habitat viewed as a 2D area. Further, we do not have
any assumptions on the number of birds, on their movements or even their customs.
More formally, let denote M = {m1 , . . . , mn } the set of all the motes which covers the habitat.
Each mote has the same detection radius r. All motes can report information to the base
station B which holds our counting algorithm, assuming that B is always reachable by every
mote. Let Ft : M → {0, 1}, the detection function which returns 1 if a mote mi detects a bird,
0 otherwise at time t. The base station stores the detection array Dt = [ Ft (m1 ), . . . , Ft (mn )]
which reveals the detection state of each mote at time t. Note that the base stores detection
arrays at a sampling rate determined empirically, that is, detection arrays Di are stored in a
data set D at the base B. Fig. 2 shows an example of motes placed on a 2D area.
Bird
Mote
Detection radius
Fig. 2. Motes, birds and the hard underlying unity Chart
We propose to count one bird for all the motes which trigger at time t and for which radius
of detection intersect mutually. We call such a set a Maximal Detection Set denoted MDS( N )
with N ⊂ M where N is the set of the motes which trigger at time t. The grayed area in
figure 2 is a MDS. Let’s denote such a subset W = {m ∈ M | ∀mi , m j ∈ M, r (mi ) ∧ r (m j )}.
Wildlife Assessment using Wireless Sensor Networks
39
Finding the Maximum Detection Set is similar to find a maximum clique (Bomze et al., 1999).
Let’s see why.
A unit disk graph G (V, E) is an intersection graph of disks of unit radius, that is, ∀ij ∈ E, the
unit circle of center i intersects the unit circle of center j. The set of each center of these circles
is called the model of the unit disk graph. This class of graph is well studied and is extensively
used in the field of ad hoc networks (Kuhn et al., 2008). Indeed, UDGs (Unit Disk Graphs) can
represent an ideal view of an ad hoc networks and provides strong theoretical result due to the
geometric properties of the model. For example, Clark and al. (Clark et al., 1990) show that
finding a maximal clique for an UDG is polynomial given its model. More recently, Raghavan
and Spinrad (Raghavan & Spinrad, 2003) have shown that it is even possible to compute the
maximum clique without the model in polynomial time.
Without loss of generality, let G (V, E) a graph where V is the set of the motes and E, the set
of edges where the edge ij exists if and only if the detection radius of mote i intersects the
detection radius of mote j. Clearly, G is a unit disk graph. Unfortunately, a clique in G only
gives motes which are pairwise adjacent and we are interested in motes which are mutually
adjacent, that is motes which intersect mutually. We propose to alter all triangles (clique of size
3) which do not have a mutual intersection in the graph i.e we remove one edge in the triangle.
As a consequence, all cliques of more than three vertices will have a mutual intersection.
Theorem 4.1. If a graph G (V, E) only has triangles formed from motes whose detection radius intersect mutually, then all motes forming a clique in G have detection radii intersecting mutually.
Proof. By definition, all clique of size three have detection radii which intersect mutually.
Now, assume that all motes clique of size n intersect mutually. Let choose such a clique that
we call S = {m1 , . . . , mn } and let’s add a new mote mn+1 to S. Assume that S + {mn+1 } form a
clique for which some motes do not intersect mutually. Clearly, mn+1 form at least two proper
intersections with S, and the detection radius of the mote mn+1 cannot intersect mutually at
least with two other radii detection. But, by definition, all triangles intersect mutually which
is a contradiction.
Reichling (Reichling, 1988) uses convex programming to find the common intersection of a set
of disks in O(k) steps where k is the number of constraints of the convex program. Moreover,
all the triangles in a graph can be computed in O(mn) steps where m is the number of edges
and n, the number of vertices. Thus, we can alter all triangles which do not have a common
intersection in O(kmn) steps. Several strategies could be used to alter a triangle. However,
removing the longest edge in a triangle seems to be the most relevant one since the number
of altered triangles would be reduced. Intuitively, a longest edge in a “bad” triangle is more
likely to be common to another “bad” triangle. Unfortunately, the underlying unit disk graph
can loose its nature since it might become a quasi-unit disk graph1 for which the maximum
clique problem is known to be NP-complete (Ceroi, 2002).
Algorithm 1 recursively constructs the maximum set of all motes which triggers at time t and
removes a MDS built from this set. For each MDS removed, the number of birds iterates.
This procedure is run for each detection array and the maximum number found over these
detection arrays is an estimation of the number of singing birds. This algorithm complexity is
bounded by the MDS search which consists in finding a clique in the unit disk graph underlying our network. Breu (Breu, 1996) has given an algorithm which find a maximum clique in a
unit disk graph with complexity O(n3.5 log n). However, the alteration of the underlying unit
disk graph leads to a NP-complete algorithm.
1
Model which takes into account non-circular detection area
40
Wireless Sensor Networks: Application-Centric Design
begin
L ← ∅;
foreach d ∈ D do
NumberOfBirds ← 0;
Construct the underlying altered unit disk graph G (V, E) from d;
while V = ∅ do
Search for a maximum clique in G;
Remove this clique from G;
NumberOfBirds ← NumberOfBirds + 1;
Add NumberOfBirds to L;
return maxl ∈ L l;
end
Algorithm 1: The Counting Heuristic
Refining the Counting Heuristic
In the following, we suggest a little enhancement of our scheme. Indeed, we partition successive detection arrays pairwise in order to refine our estimation of the number of birds.
Intuitively, the habitat is divided in such a manner that birds in a part could not have moved
to another one between two instants (for each couple of detection arrays). A threshold is empirically fixed for the flight speed of the birds such that no birds can fly over that value. This
leads to the decomposition of the environment in several sub-environments. Then, each subenvironment is processed with algorithm 1. For example, assume that we have 10 birds in an
area. Halve this area and put 5 birds in one part, and 5 in the counterpart. Now, assume that
the 5 birds in the first part sing together at time t, the other ones sing together at time t + 1
and these parts are too distant such that birds in one part can go in the other part between
the two time steps. In that case, algorithm 1 outputs 5 birds as estimate. Our next algorithm
halves the environment in two parts such that birds in two. As a consequence, we can apply
algorithm 1 on each part independently and take the sum of the estimates found on each part,
which gives 10 birds.
Data: A list of detection arrays D = D1 , . . . , Dm
Result: An estimation of the number of birds in the habitat
begin
L ← ∅;
while | D | > 0 do
Partition detection arrays Di and Di+1 respectively in X = { X1 , . . . , Xk } and
Y = {Y1 , . . . , Yk };
Z = ∅;
for i ← 1 to k do
Process Xi and Yi with algorithm 1 and put the maximum of the number of birds
counted in Z;
Add ∑z∈ Z z to L;
return maxl ∈ L l;
end
Algorithm 2: The Enhanced Counting Algorithm
Wildlife Assessment using Wireless Sensor Networks
41
For sake of clarity, in algorithm 2, the number of detection arrays is even and only two successive detection arrays are partitioned. The next section presents another way to count the
singing birds in their habitat. This next version is designed to be partially distributed on the
motes.
5. The Swarm Counting Protocol
Our next counting method can be seen as two levels, a local and a global one. At the local
level, motes cooperates sending information to count the number of singing birds in their
neighborhood. At the global level, motes aggregates data to find a more accurate estimation
of the number of singing birds in the habitat.
Like the technique previously described, we assume that the motes layout forms a unit disk
graph. First, motes have to estimate locally how many birds had sang. Then, they send this
data to the base station which derives from all the information the estimate for the number
of singing birds. In our scheme, motes all have a set of rules which are the following. They
are all in a passive state until some songs trigger them. When triggered, they switch to an
active state and tell to their neighbors2 that they detect a bird. Then they listen for their
neighborhood during a specified time. Finally, they deduce the number of singing birds in the
vicinity from their active answering neighbors, and send this number to the base station.
Local Counting
Our local counting is somewhat similar to the one in section 4. It leverages the trilateration technique to estimate a number of birds in the vicinity. All motes know their neighbors’
topology and are in an initial passive state when they are waiting for signals (bird songs).
Whenever a mote is triggered , it sends a signal to its neighbors and listen for whose which
were triggered too. If two or more neighbors have an intersecting detection area, we assume
that only one bird is counted for these motes. In figure 3, the black mote hears a bird song,
asks its neighbors if they heard too and waits for their reply. Remark that the number of birds
counted is the number of neighbors which are independent mutually in each neighborhood,
i.e the cardinal of the maximum independent set3 in the graph induced by the neighbors.
Global Counting
Now, assume that all motes have counted the birds in their vicinity and have sent their local
count to the base station. Now, all these information have to be aggregated accordingly to
find an estimate of the number of singing birds at this instant. Because, the neighborhood was
used to derive the local counting, obviously, motes which are neighbors will influence each
other in the counting process. So, summing up their local count can lead to an over-estimate
of the number of singing birds. Note that is also the case for motes which are at distance 2,
that is neighbors of neighbors in the unit disk graph, since they can share common neighbors.
Therefore, only motes which are more than distant 2 each other will sum up their count. Our
estimation will be the maximum number of birds which could be counted over aggregated
nodes in the underlying graph.
In figure 4, the black nodes are at distant 3. So a global counting of singing birds could be
four. Remark that such a counting has to be done for all set of nodes which are at more than
distance 2 each other. If such a technique seems to lead to a combinatorial explosion of the
2
3
As previously, neighbors are adjacent nodes in the unit disk graph
The largest set of vertices which are not pairwise adjacent
42
Wireless Sensor Networks: Application-Centric Design
Fig. 3. Motes collaboration at the local level
set of motes which can be aggregated, the underlying graph has some nice properties which
allows to find the estimate in linear time.
More formally, let N (i ) define the neighbors of a mote i, that is
∀i ∈ V,
and
N (i ) = { j ∈ V |
∀ A ⊂ V,
N ( A) =
Let G2+ (V, E2+ ) define the graph where
∀i, j ∈ V 2 ,
ij ∈ E}
N (i )
i∈ A
ij ∈ E2+ iff j ∈ N ( N (i ))\i
The graph G2+ is the graph of all motes which are at most 2-distant between them. Let S(.)
denote the mapping which maps a vertex v ∈ V to the number of birds counted locally. Let
C be the set of all independent set in graph G2+ . Our estimation is the sum of birds counted
locally for each motes derived from the maximum weighted independent set of G2+ , i.e
max ∑ S(v)
Lemma 5.1. G2+ is a chordal graph.
c∈C v∈c
Proof. Proof Remark that in G2+ , all vertices are simplicial4 . Thus, there exists a perfect elimination ordering on its vertices and de facto G2+ is chordal.
4
Vertices for which neighbors induce a clique in the graph.
Wildlife Assessment using Wireless Sensor Networks
43
Neighbor
Detection radius
Mote
Fig. 4. Example of underlying unit disk graph in local and global detection
Chordal graphs are graph for which vertices do not induce cycles without chord of size more
or equal to four. They are perfect graphs and well discussed in (Golumbic, 1980). It is also well
known that finding a maximum weighted independent set in chordal graph is linear (Leung,
1984). Thus, our later algorithm finds its estimation of the number of birds in linear time given
G2+ .
Let’s see why and how our algorithm is not so sensible to noise and encompasses non circular
detection area. One of the most interesting features of swarm computing (Blum & Merkle,
2008) is that nodes (swarm entities) create mechanisms which tend to be resilient to disruption and failure. Similarly, our last counting technique leverages the swarm intelligence since
motes collaborates each other to derive their local count. The more the motes are, better the
estimate is. There are two cases where inconsistencies could appear :
1. Motes can have a different status from what it would be. For example, a mote could
stay in a passive state while it would have heard “a bird song”. However, neighbor
motes tend to negate this last effect. Conversely, motes could “wake up” while no birds
have sung. This latter case is somewhat less frequent and is easier to correct since this
mote could be a one-vertex connected component in the underlying graph, fact which
is prone to be an erratic behavior of the mote.
2. Objects can occlude bird songs, that is detection area is no more circular. In that case,
the occluded motes would stay in a passive state. Fortunately, the swarm could correct
this drawback by multiplicity : other closer motes could hear the birds too.