Wireless Sensor Networks Part 2 pot
Bạn đang xem bản rút gọn của tài liệu. Xem và tải ngay bản đầy đủ của tài liệu tại đây (2.02 MB, 25 trang )
18
Wireless Sensor Networks
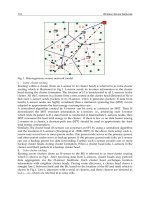
so that SNGF has available candidates to choose from. The last mile process is provided to
support the three communication semantics mentioned before. Delay estimation is the
mechanism by which a node determines whether or not congestion has occurred. And
beacon exchange provides geographic location of the neighbors so that SNGF can do
geographic based routing. Table 1 shows a classification of routing protocols based on the
application.
Protocol
Application
Query
Event
Based
Driven
√
√
SPIN
Directed Diffusion
Shah et al.
Rumor Routing
√
CADR
√
COUGAR
√
ACQIRE
√
GBR
√
O(1)-Reception Routing Protocol
√
EMPR
√
LEACH
√
EAD
√
TinyDB
√
PEGASIS
√
TEEN
√
APTEEN
UCR
√
BCDCP
√
GAF
√
MECN
√
GEAR
√
GOAFR
√
MBR
√
GMREE
√
Zhao et al. Randomly Shifted Anchors:
√
Chang et al
Kalpakis et al.
√
Minimum Cost Forwarding
√
SAR
√
Energy-Aware QoS Routing Protocol
EADGeneral
√
SPEED
√
GET
Table 1. Classification of Routing Protocols based on the Applications
Periodic
√
√
√
√
√
√
√
√
Literature Review of MAC, Routing and Cross Layer Design Protocols for WSN
19
4. Literature Review of Cross Layer design in WSN
Many researchers studied the necessity and possibility of taking advantages of cross layer
design to improve the power efficiency and system throughput of Wireless sensor network.
(Safwat et al. 2003) proposed Optimal Cross-Layer Designs for Energy-efficient Wireless Ad
hoc and Sensor Networks . They propose Energy-Constrained Path Selection (ECPS)
scheme and Energy-Efficient Load Assignment (E2LA). ECPS is a novel energy-efficient
scheme for wireless ad hoc and sensor networks. it utilizes cross-layer interactions between
the network layer and MAC sublayer. The main objective of the ECPS is to maximize the
probability of sending a packet to its destination in at most n transmissions. To achieve this
objective, ECPS employs probabilistic dynamic programming (PDP) techniques assigning a
unit reward if the favorable event (reaching the destination in n or less transmissions)
occurs, and assigns no reward otherwise. Maximizing the expected reward is equivalent to
maximizing the probability that the packet reaches the destination in at most n
transmissions. Ahmed Safwat et. al, find the probability of success at an intermediate node i
right before the tth transmission ft(i):
1
f t (i ) max p f ( j )
j k t k
k
iD
otherwise
(2)
where D is the destination node and j is the next hop towards the destination D. Any
energy-aware route that contains D and the distance between D and the source node is less
or equal to n can be used as input to ECPS. The MAC sub-layer provides the network layer
with the information pertaining to successfully receiving CTS or an ACK frame, or failure to
receive one. Then ECPS chooses the route that will minimize the probability of error
The objective of the E2LA scheme is to distribute the routing load among a set Z of Energyaware routes. Packets are allotted to routes based on their willing to save energy. Similar to
ECPS, E2LA employs probabilistic dynamic programming techniques and utilize cross-layer
interactions between the network and MAC layers. At the MAC layer, each node computes
the probability of successfully transmitting packets in α attempt. E2LA assign loads
according to four distinct reward schemes (Safwat et al. 2003).
(Venkitasubramaniam et al. 2003) propose a novel distribution medium access control
scheme called opportunistic ALOHA (O-ALOHA) for reachback in sensor network with
mobile agent. The proposed scheme based on the principle of cross layer design that
integrates physical layer characteristics with medium access control. In the O-ALOHA
scheme, each sensor node transmits its information with a probability that is a function of its
channel state (propagation channel gain). This function called transmission control is then
designed assuming that orthogonal CDMA is employed to transmit information. In
designing the O-ALOHA scheme they consider a network with n sensors communicate with
a mobile agent over a common channel. It is assumed that all the sensor nodes have data to
transmit when the mobile agent is in the vicinity of the network. Time is slotted into
intervals with equal length equal to the time required to transmit a packet. The network is
assumed to operate in time division duplex (TDD) mode. At the beginning of each slot, the
collection agent transmits a beacon. The beacon is used by each sensor to estimate the
propagation channel gain from the collection agent to it which is the same as the channel
gain from the sensor to the collection agent. It is assumed that the channel estimation is
20
Wireless Sensor Networks
perfect. The propagation channel gain from sensor i to the collection agent during slot t
which is
P R2
i( t ) 2 T it 2
ri d
(3)
Where R2it : is Rayleigh Distribution, and PT is the transmission power of each sensor, and ri
is the radial distance of sensor i , and d is the distance from collecting agent and sensor
node. During the data transmission period, each sensor transmits its information with a
probability S(i(t)) where S(.) is a function that maps the channel state to a probability. Two
transmission controls are proposed to map from the channel gain to the probability;
Location independent transmission control (LIT) and Location aware transmission control
(LAT). In LIT, the decision to transmit a packet is made by observing channel state γ alone,
while in LAT, every sensor makes an estimate of its radial distance and the decision to
transmit is a function of both the channel state γ and the location of sensor.
(Sichitiu 2004) proposed a deterministic schedule based energy conservation scheme. In the
proposed approach, time synchronized sensors form on-off schedules that enable the
sensors to be awake only when necessary. The energy conservation is achieved by making
the sensor node go to sleeping mode. The proposed approach is suitable for periodic
applications only, where data are generated periodically at deterministic time. The proposed
approach requires the cooperation of both the routing and MAC layers. The on-off schedule
is built according to the route determined by routing protocol. The proposed approach
consists of two phases; the Setup and reconfiguration phase and the steady state phase. In
the setup and reconfiguration phase, a route is selected from the node originating the flow
to the base station then the schedules are setup along the chosen route. In the steady phase,
the nodes use the schedule established in the setup and configuration phase to forward the
data to the base station. In this phase, there will be three types of actions at each node;
Sample action which is taking data sample from environment, Transmit action to transmit
data, and Receive action to receive data. The actions at each node along with the time when
each action will take place are stored in the schedule table of each node. The node can be
awake ate the time of each action and go to sleep otherwise.
(Li-Chun & Chung-Wei 2004) proposed Cross layer Design of Clustering architecture for
wireless Sensor Networks. The proposed scheme is called Power On With Elected Rotation
(POWER). The objective of the POWER is to determine the optimal number of clusters from
the cross-layer aspects of power saving and coverage performance simultaneously. The
basic concept of the POWER is to select a representation sensor node in each cluster to
transmit the sensing information in the coverage area of the sensor node. The representative
sensor node in a cluster rotated from all the sensor nodes in each cluster. In the POWER
scheme, the scheduling procedure is rotated many rounds. In each round, there are two
phases; the construction table phase (CTP), to construct the rotation table and the rotational
representative phase (RRP) to transmit data. In CTP, all sensor nodes employ the MAC
protocol and the first sensor node accessing the channel become the initiator node, then the
initiator node detects other neighboring node and form s the cluster. RRP starts after
constructing the rotation table. RRP is divided into many sRPs (Sub-Rotated Period). In each
sRP, one node will be a representative node and all other nodes in the cluster will be in
sleeping mode.
Literature Review of MAC, Routing and Cross Layer Design Protocols for WSN
Protocol
Layers
Approach
ECPS
MAC,
Network
E2LA
MAC,
Network
MAC
CROSS
MAC,
Network
Mathematical
Model:
probabilistic
dynamic
programming
Mathematical
Model:
probabilistic
dynamic
programming
Heuristic
O-Aloha
Physical,
MAC
Physical,
MAC,
Network
ALL
layers
POWER
Weilian Su
Shunguang
Cui
SenseSleep Trees
(SS-Trees)
Game
Theoretic
Approach
In
Yeup
Kong
Cross
Layer
Scheduling
Cross
Layer
design for
cluster
formulateon
Heuristic
Evaluation
method
Experiment
Application
Network
Topology
Random
(Static)
21
Cross layer Objective
Maximization
of
probability of sending
packet to its D at n
transmission
Performance
metrics
Energy
Experiment
Random
(Static)
Minimize Energy:Multiple
simultaneous routes
Load distribution
Energy
Simulation
Hardware
Implementation
(MICAZ)
Simulation
Random
(Static)
Maximize
Duration
Energy
Random
Maximize throughput
Throughput
Uniform
(Static)
Optimize number of
cluster
Energy
Link Quality
Packet
Received
Network
lifetime
SENMA
Heuristic
Sleep
Framework
(optimization
Agent)
Modeling as
optimization
problem
Experiment
al (MICAZ)
Random
Optimize
performance of WSN
Analytical
Random
Maximize
lifetime
Heuristic
Simulation
Meshbased
Maximizing Network
lifetime,
and
monitoring coverage
Applicat
ion,
Physical
Physical,
MAC,
Network
MAC,
Network
Game Theory
Analytical
Random
Minimize
distortion
total
Mathematical
Analytical
Random
Maximize
lifetime
Network
Heuristic
Simulation
Periodic
Random
Maximize
lifetime
network
Network
lifetime
MAC,
Physical,
Network
Heuristic
Simulation
Periodic
Uniform
distribution
Maximize
lifetime
network
Network
lifetime
Routing,
MAC,
Link
layer
MAC,
Network
Surveillance
network
Network
lifetime
Energy
consumed
Distortion
coverage
Table 2. Summary of Cross layer Protocols for W
(Rick et al. 2005) proposes a cross-layer sleep-scheduling-based organization approach,
called Sense-Sleep Trees (SS-trees). The proposed approach aims to harmonize the various
engineering issues and provides a method of increasing monitoring coverage and
operational lifetime of mesh-based WSNs engaged in wide-area surveillance applications.
An iterative algorithm is suggested to determine the feasible SS-tree structure. All the SS
trees are rooted at the sink. Based on the computed SS-trees, optimal sleep schedules and
traffic engineering measures can be devised to balance sensing requirements, network
communication constraints, and energy efficiency. For channel access a simple singlechannel CSMA MAC with implicit acknowledgements (IACKs) is selected. In SS-trees
approach, the WSN's life cycle goes through many stages. After the initial deployment of
nodes, the WSN will enter the network initialization stage, in which the sink gathers
network connectivity information from sensor nodes, compute the SS-trees, and disseminate
22
Wireless Sensor Networks
the sleep schedules to every sensor node. Then the WSN will enter the operation stage, in
which the nodes will alternate between Active and sleep stages. During long periods when
sensing services are not needed the entire WSN will enter the Hibernation mode to conserve
energy. The SS-trees must be computed with minimizing number of shared nodes (nodes
belonging to multiple SS-trees), minimizing co-SS tree neighbors of each node, and
minimizing the cost of forwarding messages between the data sink and each node. Rick W.
Ha et al proposes a greedy algorithm to compute the SS-trees. The proposed algorithm
follows a greedy depth-first approach that constructs the SS-trees from the bottom up on a
branch-by-branch basis. After computing the SS-trees, an optimal sleep schedule that
maximizes energy efficiency must be determined. The length of the active and sleep period
will increase the data delay. The proposed SS-Tree design streamlines the routing
procedures by restricting individual sensor nodes to only maintain local connectivity
information of its immediate 1-hop neighbors.
(Shuguang et al. 2005) emphasize that the energy efficiency must be supported across all
layers of the protocol stack through a cross-layer design. They analyze energy-efficient joint
routing, scheduling, and link adaptation strategies that maximize the network lifetime. They
propose variable-length TDMA schemes where the slot length is optimally assigned
according to the routing requirement while minimizing the energy consumption across the
network. They show that the optimization problems can be transferred into or
approximated by convex problems that can be solved using known techniques. They show
that link adaptation be able to further improve the energy efficiency when jointly designed
with MAC and routing. In addition to reduce energy consumption, Link adaptation may
reduce transmission time in relay nodes by using higher constellation sizes such as the extra
circuit energy consumption is reduced.
(Weilian and Tat 2006) propose a cross layer design and optimization framework, and the
concept of using an optimization agent (OA) to provide the exchange and control of
information between the various protocol layers to improve performance in wireless sensor
network. The architecture of the proposed framework consists of a proposed optimization
agent (OA) which facilitates interaction between various protocol layers by serving as a
database where essential information such as node identification number, hop count, energy
level, and link status are maintained. (Weilian and Tat 2006) conduct the performance
measurements to study the effects of interference and transmission range for a group of
wireless sensors. The results of their performance measurements help to facilitate the design
and development of the OA. The OA can be used to trigger an increase in transmit power to
overcome the effects of mobility or channel impairments due to fading when it detects a
degradation due in BER. Alternatively, it can reduce the transmit power to conserve energy
to prolong its lifetime operations in the absence of mobility or channel fading. The OA can
also be used to provide QoS provisioning for different types of traffic. This can be done by
tagging different priority traffic with different transmit power levels.
(Changsu et al. 2006) proposed an energy efficient cross-layer MAC protocol for WSN. It is
named MAC-CROSS. In the proposed protocol, the routing information at the network layer
is utilized for the MAC layer such that it can maximize sleep duration of each node. in
MAC-CROSS protocol the nodes are categorized into three types: Communicating Parties
(CP) which refers to any node currently participating in the actual data transmission,
Upcoming Communicating Parties (UP) which refers to any node to be involved in the
actual data transmission, and Third Parties (TP) which refers to any node are not included
Literature Review of MAC, Routing and Cross Layer Design Protocols for WSN
23
on a routing path. The UP nodes are asked to wake up while other TP nodes can remain in
their sleep modes. The RTS/CTS control frames are modified in the MAC-CROSS protocol.
The modification is needed to inform a node that its state is changed to UP or TP in the
corresponding listen/sleep period. a new field; Final_destination_Addr, is added to the
RTS. On the other hand, a new field; UP_Addr is added to the CTS and it informs which
node is UP to its neighbors. When a node B receives an RTS from another node A including
the final destination address of the sink, B's routing agent refers to the routing table for
getting the UP (node C) and informs back to its own MAC. The MAC agent of Node B then
transmits CTS packet including the UP information. After receiving the CTS packets from
node B, C changes its state to UP and another neighbor nodes change their states to TP and
will go to sleep.
Table 2 shows summary of cross-layer design protocols for WSN.
5. Conclusion
In this chapter, we present a summary for MAC, Routing, and Cross layer Design protocols
for WSN. In section 0, a survey of MAC protocols for WSN is presented. The routing
protocols for WSN are discussed in section 0. A classification of the routing protocols
according to the application is presented in section 3. Section 0 presents a summary of cross
layer design protocols for WSN. A summary of cross layer design protocols at the end of
section 4.
6. References
Ian F. Akylidiz, W. Su, Y. Sankarasubramaniam, and E. Cayirci (2002). A survey on sensor
networks. IEEE Personal Communications Magazine, August.
The working group for WLAN standards 1999). IEEE 802.11 standards, Part 11: Wireless
Medium Access Control (MAC) and physical layer (PHY) specifications. Technical
report, IEEE
Sureh S. and Cauligi S. Raghavendra 1998), “PAMAS: Power aware multi-access protocol
with signalling for ad hoc networks,” ACM Comput. Commun. Rev., vol. 28, no. 3,
July 1998, pp. 5–26,.
Wei Ye, John Heidemann, and Deborah Estrin, Fellow 2004), “Medium Access Control With
Coordinated Adaptive Sleeping for Wireless Sensor Networks”, IEEE/ACM
Transactions on Networking, Vol 12, No. 3, June 2004, pp. 493-506,.
Chansu Suh, Young-Bae Ko. (2005), "A traffic Aware, Energy Efficient MAC Protocol for
Wireless Sensor Networks", IEEE International Symposium on Circuits and Systems,
2005. ISCAS 2005. pp.2975 - 2978 Vol. 3 , 23-26 May 2005
Peng Lin, Chunming Qiao and Xin Wang (2004) “Medium Access Control With A Dynamic
Duty Cycle For Sensor Networks,” in WCNC, Mar 2004.
Tijs van Dam and Koen Langendoen (2003), "An adaptive Energy-Efficient MAC Protocol
for Wireless Sensor Networks," in ACM Sensys’03, Nov. 2003.
Saad Biaz, Yawen Dai Barowski (2004), "GANGS: an Energy Efficient MAC Protocol for
Sensor Networks", ACMSE'04 April 2-3.
Kemal Akkaya and Mohamed Younis (2005), "A Survey of Routing Protocols in Wireless
Sensor Networks, " in the Elsevier Ad Hoc Network Journal, 2005 vol. 3/3 pp. 325-349.
24
Wireless Sensor Networks
Sandra. M. Hedetniemi and Stephen. T. Hedetniemi (1988), “A survey of gossiping and
broadcasting in communication networks,” Networks, Vol. 18, No. 4, 1988, pp. 319349,
Chalermek Intanagonwiwat, Ramesh Govindan and Deborah Estrin (2000), "Directed
diffusion: A scalable and robust communication paradigm for sensor networks", in
the Proceedings of the 6th Annual ACM/IEEE International Conference on Mobile
Computing and Networking (MobiCom'00), Boston, MA, August 2000.
David Braginsky and Deborah Estrin (2002), "Rumor Routing Algorithm for Sensor
Networks," in the Proceedings of the First Workshop on Sensor Networks and
Applications (WSNA), Atlanta, GA, October 2002.
Li Xia, Xi Chen, and Xiaohong Guan Xiac (2005), A New Gradient-Based Routing Protocol in
Wireless Sensor Networks Embedded Software and Systems, Springer Berlin, Heidelberg,
2005.
Abdelmalik Bachir, Dominique Barthel, Martin Heusse, and Andrzej Duda (2007), "O(1)Reception routing for sensor networks," Computer Communications Volume 30 ,
Issue 13, (2007), pp. 2603-2614.
Yunfeng Chen, and Nidal Nasser (2006), “Energy-Balancing Multipath Routing Protocol for
Wireless Sensor Networks,” in the Proc. of the third International Conference on
Quality of Service in Heterogeneous Wired/Wireless Network, Waterloo, Ontario,
Canada, August 7-9, 2006.
Wendi Heinzelman, Anantha Chandrakasan, and Hari Balakrishnan (2002), “An
Application-Specific Protocol Architecture for Wireless Microsensor Networks,”
IEEE On Wireless Communications Trans., vol. 1, No. 4, Oct. 2002, pp. 660-670.
Azzedine Boukerche, Xuzhen. Cheng, Joseh. Linus (2005), “A Performance Evaluation of a
Novel Energy-Aware Data-Centric Routing Algorithm in Wireless Sensor
Networks”, Wireless Networks 11, 2005, pp.619–635,
T. AL-khdour, U. Baroudi (2007), “ A Generalized Energy-Aware Data Centric Routing For
Wireless Sensor Network”, in the Proc. of The 2007 IEEE International Conference
on Signal Processing and Communications (ICSPC 2007) , Dubai, United Arab of
Emirates (UAE), Nov. 24–27.
T. AL-khdour, U. Baroudi (2009), “A Generalized Energy-Efficient Time-Based
Communication Protocol for Wireless Sensor Networks”, Special issue of International
Journal of Internet Protocols (IJIPT), Vol. 4, No. 2-2009.
Samuel R. Madden Madden, Michael J. Franklin And Joseph M. Hellerstein, And Wei Hong
(2005) , “TinyDB: An Acquisitional Query Processing System for Sensor Networks”,
ACM Transaction on Database Systems, Vol. 30, No 1, March 2005, Pages 122-173.
Guihai Chen, Chengfa Li , Mao Ye, and Jie Wu, (2007) “An Unequal Cluster-Based Routing
Strategy in Wireless Sensor Networks ,” Wireless Networks (JS) , April 2007.
Younis M., Youssef M. and Arisha K. (2002), “Energy-Aware Routing in Cluster-Based
Sensor Networks”, in the Proceedings of the 10th IEEE/ACM International
Symposium on Modeling, Analysis and Simulation of Computer and
Telecommunication Systems (MASCOTS2002), Fort Worth, TX, October 2002.
Muruganathan, S.D.; Ma, D.C.F.; Bhasin, R.I.; Fapojuwo, A.O. (2005), "A Centralized EnergyEfficient Routing Protocol for Wireless Sensor Networks," IEEE Radio
Communication, March 2005, pp. S8-S13.
Literature Review of MAC, Routing and Cross Layer Design Protocols for WSN
25
Ya Xu, John Heidemann, and Deborah Estrin (2001), "Geography-informed energy
conservation for ad hoc routing," in the Proceedings of the 7th Annual ACM/IEEE
International Conference on Mobile Computing and Networking (MobiCom’01),
Rome, Italy, July 2001.
Yan Yu, Ramesh Govindan, and Deborah Estrin (2001), “Geographical and Energy-Aware
Routing: A Recursive Data Dissemination Protocol for Wireless Sensor Networks,”
UCLA Computer Science Department Technical Report, UCLA-CSD TR-01-0023,
May 2001.
Foad. Lotfifar, Hadi. Shahhoseini (2006), “A mesh-Based Routing Protocol for Wireless AdHoc Sensor Networks,” in the Proc. of International Wireless Communication and
Mobile Computing Conference (IWCMC'06), Vancouver, British Columbia, Canda,
July 3-6, 2006.
Juan A. Sanchez, Pwdro M. Ruiz, and Ivan Stojmenovic (2007), "Energy-efficient geographic
multicast routing for Sensor and Actuator Networks," Computer Communications 30
(2007) pp. 2519–2531
Gang Zhao, Xianggian Liu, and Min-Tue Sun (2007), "Energy-Aware Geographic Routing
for Sensor Networks with Randomly Shifted Anchors," in the Proc. of Wireless
Communications and Networking Conference WCNC 2007, 11-15 March 2007, pp.
3454-3459
Sundar Subramanian, Sanjay Shakkottai and Piyush Gupta (2007), "On Optimal Geographic
Routing in Wireless Networks with Holes and Non-Uniform Traffic," in the Proc. of
26th IEEE International Conference on Computer Communications. INFOCOM
2007, May 2007, pp. 1019-1027
Jae-Hwan. Chang, Lendros and Tassiulas (2004), "Maximum Lifetime Routing in Wireless
Sensor Networks," IEEE/ACM Transactions on Networking (TON) archive
Volume 12 , Issue 4 (August 2004) ,pages: 609 - 619
Konstantinos Kalpakis, Koustuv Dasgupta and Parag Namjoshi (2004) , “Maximum Lifetime
Data Gathering and Aggregation in Wireless Sensor Networks,” in the Proceedings
of IEEE International Conference on Networking (NETWORKS '02), Atlanta, GA,
August 2002.
Tian He, John A Stankovic, Chenyang Lu, and Tarek Abdelzaher (2003), “SPEED: A stateless
protocol for real-time communication in sensor networks,” in the Proceedings of
International Conference on Distributed Computing Systems, Providence, RI, May 2003.
Safwati. A., Hassanein. H., Mouftah. H. (2003),” Optimal Cross-Layer Designs for EnergyEfficient Wireless Ad hoc and Sensor Networks”, in the Proceedings of the IEEE
International Conference of Performance, Computing, and Communications 9-11
April 2003 Page(s):123 – 128
Venkitasubramaniam P., Adireddy S., Lang Tong (2003), “Opportunistic ALOHA and cross
layer design for sensor networks” , Military Communications Conference, 2003.
MILCOM 2003. IEEE Volume 1, 13-16 Oct. 2003 Page(s):705 - 710
Sichitiu M.L. (2004), “Cross-Layer Scheduling for Power Efficiency in Wireless Sensor
Networks” ,INFOCOM 2004. Twenty-third Annual Joint Conference of the IEEE
Computer and Communications Societies , Volume 3, 2004 Page(s):1740 - 1750
Li-Chun Wang, Chung-Wei Wang (2004), “A Cross-layer Design of Clustering Architecture for
Wireless Sensor Networks”, in the Proceedings of the IEEE International Conference on
Networking, Sensing & Control Tapel, Taiwan, March 21-23, 2004, Page(s): 547-552
26
Wireless Sensor Networks
Rick W. Ha, Pin-Han Ho and X. Sherman Shen (2005), “Cross-Layer Application-Specific
Wireless Sensor Network Design with Single-Channel CSMA MAC over Sense-Sleep
Trees”, Elsevier Journal: Computer Communications Special Issue on Energy Efficient
Scheduling and MAC for Sensor Networks, WPANs,WLANs, and WMANs, 2005
Shuguang Cui, Madan R. , Goldsmith A. , Lall S. (2005), “Joint routing, MAC, and link layer
optimization in sensor networks with energy constraints “ IEEE International
Conference on Communications, ICC 2005 ,Volume 2, 16-20 May 2005 Page(s):725 - 729
Su. W., T.L. Lim (2006), “Cross-Layer Design and Optimization for Wireless Sensor
Networks,” Proceedings of the Seventh ACIS International Conference on Software
Engineering, Artificial Intelligence, Networking, and Parallel/Distributed
Computing, SNPD June 2006 Page(s):278 – 284
Changsu Suh, Young-Bae Ko, and Dong-Min Son (2006) , “An Energy Efficient Cross-Layer
MAC Protocol for Wireless Sensor Networks”, APWeb 2006, LNCS 3842, pp. 410–
419, 2006.
Low-power Sensor Interfacing and MEMS for Wireless Sensor Networks
27
2
0
Low-power Sensor Interfacing and
MEMS for Wireless Sensor Networks
J.A. Michaelsen, J.E. Ramstad, D.T. Wisland and O. Søråsen
Nanoelectronic Systems Group, Department of Informatics, University of Oslo
Norway
1. Introduction
The need for low-power and miniaturized electronics is prominent in wireless sensor network
(WSN) nodes—small sensor nodes containing sensors, signal processing electronics, and a
radio link. The demand for long battery life of such systems, especially if used in biomedical
implants or in autonomous installations, forces the development of new circuit topologies
optimized for this application area. Through a combination of efficient circuit topologies and
intelligent control systems, keeping the radio idle when signal transmission is not needed, the
radio link budget may be dramatically reduced. However, due to the demands for continuously
monitoring of the sensor in many critical applications, the sensor front-end, analog-to-digital
converter (ADC), and the control logic handling the radio up/down-link may not be turned off,
and for systems with long intervals between transmissions, the energy consumed by these parts
will have a large impact on battery life. In this chapter, we focus on Frequency ∆Σ Modulator
(FDSM) based ADCs because of their suitability in WSN applications. Using FDSM based
converters, both sensors with analog and frequency modulated outputs may be conveniently
interfaced and converted to a digital representation with very modest energy requirements.
Microelectromechanical systems (MEMS) integrated on-die with CMOS circuitry enables very
compact WSN nodes. MEMS structures are used for realizing a wide range of sensors, and form
vital components in radio circuits, such as mixers, filters, mixer-filters, delay lines, varactors,
inductors, and oscillators. In this chapter a MEMS oscillator will be used to replace Voltage
Controlled Oscillators (VCOs). The MEMS oscillator is made using a post-CMOS process.
Before the die is packaged, the CMOS die is etched in order to release the MEMS structures.
The top metal layers in the CMOS process acts as a mask to prevent CMOS circuitry from being
etched in addition to be used as a mask to define the MEMS structures. The resulting MEMS
structure consists of a metal-dielectric stack where its thickness is determined by the number
of metal layers available in the CMOS process. In this chapter, we will use a deep sub-micron
CMOS process to illustrate the possibility for combining MEMS and CMOS in a small die area.
The MEMS oscillator is to be used as a frontend for the FDSM.
FDSM and MEMS integrated in CMOS is a versatile platform for miniaturized low-power WSN
nodes. In this chapter we illustrate the benefits of this approach using simulation, showing the
potential for efficient miniaturized solutions.
28
Wireless Sensor Networks
2. Background
Within the international research community and industry, large research and development
efforts are taking place within the area of Wireless Sensor Networks (WSN) (Raghunathan et al.,
2006). Wireless sensor nodes are desirable in a wide range of applications. From a research
perspective, power consumption and size are main parameters where improvements are
needed. In this chapter we will focus on methods and concepts for low-voltage and low-power
circuits for sensor interfacing in applications where the power budget is constrained, along with
MEMS structures suitable for on-die CMOS integration. These technologies enable wireless
sensor network nodes (WSNNs) with a very compact size capable of being powered with a
depletable energy source due to its potential for low voltage and low power consumption.
Sensor
ADC
DSP
TX
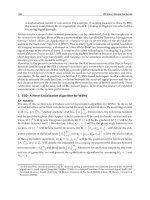
Fig. 1. Wireless sensor network node
The key components of a wireless sensor node are: 1) The sensor performing the actual measurement (pressure, light, sound, etc.), producing a small analog voltage or current. 2) An
analog-to-digital (A/D) converter (ADC) converting and amplifying the weak analog sensor
output to a digital representation. 3) A digital signal processing system, performing local computations on the aquired data to ready it for transmission, and for deciding when to transmit.
4) A radio transceiver for communicating the measurements. This is depicted in figure 1. The
sensor readout circuitry, namely the ADC and processing logic, must continuously monitor the
sensor readings in order to detect changes of interest and activate the transceiver only when
needed to conserve power. For digital CMOS circuitry, an efficient way of saving power is to
reduce the supply voltage, resulting in subthreshold operation of MOSFET devices, as their
conductive channel will only be weakly inverted (Chen et al., 2002). In standard nanometer
CMOS technology, safe operation is possible with supply voltages down to approximately
200mV (Wang & Chadrakasan, 2005). Conventional analog circuit topologies are not able
to operate on these ultra low supply voltages, especially with the additional constraint of
a scarce power budget (Annema et al., 2005). As a result, the ADCs currently represents a
critical bottleneck in low-voltage and low-power systems, accentuating the need for new design
methodologies and circuit topologies.
The sensor readout circuit must satisfy certain specifications like sufficient gain, low distortion
and sufficient signal-to-quantization-noise ratio (SQNR). When studying existing Nyquistrate ADCs, it is obvious that the analog precision is reduced as the power supply voltage
is lowered (Chatterjee et al., 2005). This is mainly due to non-ideal properties of the active
and passive elements, and process variations. In order to increase the SQNR, oversampled
converters employing noise shaping ∆Σ modulators are used, trading bandwidth for higher
SQNR (Norsworthy et al., 1996). ADCs are implemented either using continuous-time (CT) or
Switched Capacitor (SC) components for realizing the necessary analog filter functions. SC
realizations have generally been preferred for CMOS implementations as the method does
not rely on absolute component values which are difficult to achieve without post-fabrication
trimming. During the last few years, the power supply has moved down to 1 V in state-of-the
art technologies making it hard to implement switches with sufficient conduction required
for SC-filters. As a result, current SC realizations switch the opamp, eliminating the need
Low-power Sensor Interfacing and MEMS for Wireless Sensor Networks
29
for CMOS switches in the signal path. This method is referred to as the Switched Opamp
technique (Sauerbrey et al., 2002). As a result, the most important building block for both
CT and SC based ∆Σ modulators are the opamp, which is also the limiting component with
respect to conversion speed and signal-to-noise and distortion ratio (SINAD). As mentioned
earlier, the sensor readout circuitry in a battery operated wireless sensor node should allow for
operation far below 1V to facilitate low power consumption. This requirement eliminates both
conventional CT and SC ∆Σ modulators as these approaches require large amounts of power
at low supply voltages to attain reasonable performance.
Several low-power ADC topologies adapted for sensor interfacing have been reported in the
last few years (Yang & Sarpeshkar, 2005; Kim & Cho, 2006; Wismar et al., 2007; Taillefer &
Roberts, 2007). Among them, some are utilizing the time-domain instead of the amplitudedomain to reduce the sensitivity to technology and power supply scaling (Kim & Cho, 2006;
Wismar et al., 2007; Taillefer & Roberts, 2007).
The non-feedback modulator for A/D conversion was introduced in Høvin et al. (1995); Høvin
et al. (1997). In contrast to earlier published ∆Σ based ADCs, this approach does not require
a global feedback to achieve noise shaping giving new and additional freedom in practical
applications. This property is particularly useful when the converter is interfacing a sensor
(Øysted & Wisland, 2005). The non-feedback ∆Σ modulator has two important properties
which make it very suitable for low-voltage sensor interfacing. First, the topology has no global
feedback which opens up for increasing the speed and resolution compared to conventional
methods. Second, and most important, the analog input voltage is converted to an accumulated
phase representing the integral of the input signal, thus moving the accuracy requirements
from the strictly limited voltage domain, to the time domain, which is unaffected by the supply
voltage. The conversion from analog input voltage to accumulated phase is performed using a
Voltage Controlled Oscillator (VCO). As this solution uses frequency as an intermediate value,
the non-feedback ADC using a VCO for integration is normally referred to as a Frequency
Delta Sigma Modulator (FDSM).
Until recently, the FDSM has mainly been used for converting frequency modulated sensor
signals with no particular focus on low supply voltage. In Wismar et al. (2006), an FDSM
based ADC, fabricated in 90 nm CMOS technology, is reported to operate properly down to
a supply voltage of 200 mV with a SINAD of 44.2 dB in the bandwidth from 20 Hz to 20 kHz
(the audio band). The measured power consumption is 0.44 µW. The implementation is based
on subthreshold MOSFET devices with the bulk-node exploited as input terminal for the signal
to be converted.
At the RF front-end in WSN nodes, bulky off-chip components are usually used to meet the RF
performance requirements. Such components are typically external inductors, crystals, SAW
filters, oscillators, and ceramic filters (Nguyen, 2005). Micromachined components have been
shown to potentially replace many of these bulky off-chip components with better performance,
smaller size and lower power consumption. The topic of combining MEMS directly with CMOS
has been of great interest in the past years (Fedder et al., 2008). The direct integration of MEMS
with CMOS reduces parasitics, reduces the packaging complexity and the need for external
components becomes less prominent. It turns out that integrating MEMS after the CMOS die
has been produced has been most successful which is proven by Carnegie Mellon University
(Chen et al., 2005; Fedder & Mukherjee, 2008), National Tsing Hua University (Dai et al., 2005),
University of Florida (Qu & Xie, 2007) and University of Oslo (Soeraasen & Ramstad, 2008;
Ramstad et al., 2009). The concept of CMOS-MEMS is maturing and seems to be versatile and
30
Wireless Sensor Networks
offer the flexibility of possibly replacing RF-front end components or sensors, both relevant in
the context of WSNN.
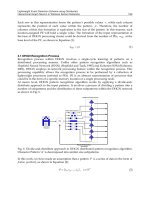
3. Frequency Delta-Sigma Modulators
An FDSM based converter (Høvin et al., 1997) can conveniently be used in WSNNs for converting frequency modulated signals to a quantized and discrete bitstream, where the quantization
noise is shaped away from the signal band. Overall, this results in frequency-to-digital (F/D)
conversion with equivalent ∆Σ noise shaping.
eq
d·
dt
+
· dτ
···
···
Fig. 2. FDSM overview
In the time domain, the input to the modulator, a frequency modulated (FM) signal, is xfm (t) =
cos[θ (t)], where the instantaneous phase is,
θ (t) = 2π
t
0
(1)
f c + f d · x (τ ) dτ
f d is the maximal deviation from the carrier frequency, f c , while x (τ ) represents the physical
quantity we are measuring; assumed to be limited to ±1. The integral of the input signal and
a constant bias is now represented by the phase, θ (t). The cosine function wraps the phase
every 2π, effectively performing modulo integration. By using a counter, triggered by the
zero-crossings of the xfm signal, the integral of the input signal is quantized to a digital value
which in turn is sampled at regular intervals, Ts = f s−1 . A digital representation of the input,
x, is recovered by differentiating the quantized phase signal. This is depicted in figure 3(a).
Register
Clk
n
xfm
n
Register
Counter
−
n
y1
+
Clk
(a) multi-bit
xfm
D
Q
D
Q
DFF
DFF
CK
CK
Clk
(b) single-bit (DFF)
Fig. 3. First order FDSM topologies
y1
Low-power Sensor Interfacing and MEMS for Wireless Sensor Networks
60
·· ····
· · ········ ·· ···· ·
· · ··· ·
· ·
··
· · · ·
SQNR (dB)
50
40
·
·
31
·
30
20
0.005
0.01
0.05
fc / fs
0.1
Fig. 4. Theoretical performance (solid line) and time-domain simulated performance (dots) as a
function of carrier frequency and sampling frequency ratio
An important property is that quantization noise occurs after the integration, resulting in first
order noise shaping of the quantization noise sequence, while the input signal is not altered.
This is illustrated in figure 2, where eq represents the quantization noise. Second order noise
shaping can be obtained by integrating the quantization error from the first order FDSM. While
the second order system requires a higher circuit complexity which incurs an increase in power
consumption, it can be shown that the increase in performance in some cases outweighs the
additional requirements (Michaelsen & Wisland, 2008).
The FDSM is inherently an oversampled system, meaning that the output bitrate, f s , is much
higher than the bandwidth of the input signal, f b . Quantization noise is suppressed in the
signal band through noise shaping. In the case of first order converters, the quantization noise
will be shaped with a slope of 20 dB/decade.
If the number of zero-crossings of the FM signal during Ts is less than two, it is possible to
realize the structure in figure 3(a) with only two D-flipflops (DFFs), and an XOR-gate used
for subtraction, as illustrated in figure 3(b). Due to its simple implementation, the first order
single-bit FDSM is a viable choice for WSNN applications because of its potential for low power
consumption and low voltage operating requirements (Wismar et al., 2007). In this case, the
resolution of the converter is given by (Høvin et al., 1997)
SQNRdB = 20 log10
√
2 fd
fs
− 10 log10
π2
36
2 fb
fs
3
(2)
However, in cases where f s / f c
1, the actual performance may be better than predicted
by equation 2. As illustrated in figure 4, this discrepancy can be significant. In this plot, f s
was held constant at 20 MHz, with f d = f c · 10 %, and f b = 19 kHz. The solid line represents
the performance predicted by equation 2 while the dots indicate the performance from a
difference equation simulation of the converter. The underlying assumption in equation 2 is
that the quantization noise sequence is a white noise sequence. However, this assumption
in not accurate, and it is possible to exploit pattern noise valleys for significantly improving
performance (Høvin et al., 2001).
32
Wireless Sensor Networks
Before further processing of the digital sensor signal in the WSNN, it is usually desirable to
have an output frequency that is equal to, or slightly higher than, 2 f b . To achieve this the output
bitstream is decimated by first bandlimiting the signal using a low-pass filter. This removes the
out-of-band noise to avoid aliasing. After low-pass filtering, only every N-th sample is kept,
where N = f s/2 f b . During and after decimation, each sample must be represented by more bits
to avoid quantization noise being a limiting factor. The decimation usually requires a significant
amount of computation. This task is therefore done in stages, where computationally efficient
filters run at the input frequency, while more accurate filters run at lower frequencies. The first
stage is usually a sincm -filter, where m is the order of the filter, named after its (sin( x )/x )m
shaped frequency response. This class of filter has a straight forward hardware implementation
(Hogenauer, 1981; Gerosa & Neviani, 2004) capable of high frequency operation. It can be
shown that a sinc L+1 filter is sufficient for an order L ∆Σ modulator (Schreier & Temes, 2004).
At later stages, more complex filters can be used to correct for the non-ideal features of the sinc
filter such as passband droop (Altera Corporation, 2007).
The frontend of the FDSM—be it a VCO in the case of an ADC, or a device which directly
converts some physical quantity to a frequency modulated signal—will to some extent have
a non-linear transfer function. A non-linear FM source will in turn give rise to harmonic
distortion present in the output signal. Although quantization noise is shaped away from
the signal band, harmonic distortion will not be suppressed as it is impossible for the F/D
converter to distinguish between what is the actual signal and what is noise and distortion.
This non-linearity deteriorates the effective resolution of the measurement system. However,
several digital post-processing schemes and error correction systems have been devised that
are able to recover linearity to some extent (Balestrieri et al., 2005). Care must be taken when
designing the post-processing system so that aliasing of values and missing output codes does
not present a problem. Another issue with the FDSM frontend is phase noise, also referred to as
jitter. This noise will directly add to the input signal and therefore not undergo noise shaping;
raising the noise floor at the output. 1/f noise has shown to be particularly problematic, and
careful attention to issues related to noise is critical when designing the oscillator circuit. This
is especially challenging in deep sub-micron CMOS technologies.
4. Using a MEMS resonator as a VCO
4.1 The micromechanical resonator
A resonator is a component which is able to mimic full circuit functions such as filtering, mixing,
line delays, and frequency locking. The resonator is a mechanical element that vibrates back
and forth where the displacement of the micromechanical element generates a time varying
capacitance which in turn results in an ac current at the output node. The maximum output
current occurs when stimulating the resonator with an input ac voltage with a frequency equal
to the resonance frequency of the resonator. The micromechanical resonator can be represented
as an LCR circuit (see figure 5) where the equations describing these passive components are
related to physical parameters such as mass, damping, and stiffness (Senturia, 2001; Bannon
et al., 2000).
Figure 5 is a simple LRC circuit which can be described as,
ă
Vi = q(t) L x + q(t) R x + q(t)
1
Cx
(3)
where L x , R x and Cx are the passive element values for a maximum displacement x of the
resonator. Vi and Vo are the input and output voltages as shown in figure 5. q(t) is the charge
Low-power Sensor Interfacing and MEMS for Wireless Sensor Networks
Lx
33
Rx
Cx
Vi
Vo
Fig. 5. A simple LCR circuit
on the capacitor which depends on the time t. By using the relationship between the output
and the input (H (t) = Vo /Vi ) from the circuit of figure 5 and by using q = Cx V results in the
derivation of the resonance frequency of this system:
f0 =
1
2π
1
L x Cx
(4)
From the transfer function, the maximum throughput exists when the reactances of the inductor
and the capacitor is equal to each other and opposite, thus this defines the resonance frequency
for this micromechanical system. For RF front-end components and oscillators, it is desirable
to have a good transfer of the signal through the component. A good throughput is possible by
having a good Q-factor which is described by,
Q=
ω0 L x
Rx
(5)
where equation 5 is derived from the transfer function of figure 5 and ω0 is the resonance
frequency of the resonator (ω0 = 2π f 0 ). A large Q-factor is usually desirable to get good
resonator performance. As explained in section 4.5, the resulting MEMS structures consists of a
laminate of metal and dielectric, so the resulting Q-factor will be limited mostly by intrinsic
material loss and gas damping which will be discussed later. A top view of a micromechanical
resonator is shown in figure 6.
Layout view
VP
In
x
y
Out
=
Equivalent passive components
in a schematic view
In
Out
Lx
Cx
Rx
Stationary structure
or anchor
Movable structure
Fig. 6. The resonator analogy
Figure 6 shows a long and thin cantilever beam (fixed at one end, free to move at the other
end) with two electrodes next to it. The left electrode is the input electrode while the right
electrode is the output electrode. The gray areas indicate stationary elements (the anchor and
34
Wireless Sensor Networks
the electrodes) while the blue area indicates a part which is able to move freely (the resonator).
The thin and long cantilever beam moves back and forth laterally above the silicon substrate
towards the two electrodes in the x-direction. At the resonance frequency of this resonator, the
maximum vibration towards the electrode is x. The thickness of the beam is not shown here as
this is a top view. The VP signal applied to the beam itself is a high DC voltage which is used
to cancel unwanted frequency terms and to amplify the signal of the resonator. By separating
the VP signal from the input and output ac signals, the VP signal will not be superimposed on
either of the two signals. The gap g between the resonator and the electrodes is an important
parameter which will decide vital aspects of the resonator as will be shown later.
4.2 The electromechanical analogy
4.2.1 The electromechanical coupling coefficient
The micromechanical resonator is attracted due to electrostatic forces creating a capacitive
coupling between the resonator and the input electrode (Kaajakari et al., 2005). A large electrode
area that covers the resonator is desirable where the capacitance C is described as,
C=
ε 0 Wr We
g
(6)
where ε 0 is the permittivity in air, Wr is the resonator width (vertical thickness, not visible in
figure 6), We is the electrode length, and g is the gap between the resonator and the electrode.
The capacitance equation is related to the electrostatic force equation (F). The electrostatic force
F is derived from the potential energy equation U = 1 2 CV 2 which results in:
/
F=
dU
1 dC 2
=
V
dx
2 dx
(7)
where V is the signal voltage. dC dx is the capacitance change due to a small change in the gap
/
size g because the resonator bends towards the electrode with a displacement x. The force is
proportional to the square of the voltage V which will introduce a cos(2ωt) term (the derivation
of this is not shown here). The cos(2ωt) term will introduce oscillation at ω = ω0/2 , half the
resonance frequency. In order to avoid this nonlinear relationship, a polarization voltage VP
is applied to the beam. When splitting V into VP + v · cos(ωt) the resulting electrostatic force
becomes,
dC
f = VP
v
(8)
dx
Equation 8 describes the relationship between the force f and the voltage v (small signal values)
that now has a linear relationship. It is now possible to derive the coefficient known as η:
η = VP
dC
ε Wr We
≈ VP 0 2
dx
g
(9)
η is a coefficient which describes how well the signal from the electrode is transferred to the
resonator. It is an equation that is a result of the electrostatic force equation so that the force f
has a linear relationship to the voltage v. A larger η results in a larger signal of the resonator. It
is desirable with a large electrode area (Ael = Wr We ) and a small gap g. Because η is inversely
proportional to the square of the gap between the electrode and resonator, it is desirable to
have an extremely small gap size. Both the electrode area Ael and the gap size g are limited
by process constraints. Notice that equation 9 is a simplified equation of η as the derivation
of the capacitance C with respect on the gap g is done by assuming that the gap is the same
throughout the y-axis of the resonator (throughout the resonator length L).
Low-power Sensor Interfacing and MEMS for Wireless Sensor Networks
35
4.2.2 Resonator output current
The output current due to the capacitive coupling explained in section 4.2.1 can be written as:
io = VP
dv
dC
dC
+C
≈ VP
dt
dt
dt
(10)
The output current in equation 10 consists of two parts: One part which is amplified with
the polarization voltage VP , and one part which consists of the (small) sinusoidal voltage v.
Equation 10 was derived by using io = d dt (C · V ) (Bannon et al., 2000). It is possible to further
/
/
simplify this equation by neglecting the C dv dt part because the voltage VP is much larger than
v:
dC dx
≈ ηω0 x
(11)
io = VP
dx dt
Equation 11 was derived by using the relationship dx dt = ω0 x. By using VP , the output current
/
io can be amplified as shown in equation 11. However, when increasing VP , ω0 will be reduced
while the displacement x increases. This means that the current will have an exponential-like
increase as VP is increased and not a linear increase of io which could be expected. The fact
that the operational (resonance) frequency of the resonator decreases when VP is increased is
due to an effect known as "spring-softening" which will be discussed later (Bannon et al., 2000).
This spring-softening effect will be utilized in order to use the micromechanical resonator as a
voltage-controlled oscillator (VCO).
4.2.3 The LCR equivalents
By using the principle of electromechanical conversion as explained in section 4.2.1, it is
possible to derive formulas for L x , Cx and R x .
Lx
=
Cx
=
Rx
=
meff
η2
η2
kr
(12)
(13)
kr meff
Qη 2
(14)
where kr is the effective spring stiffness and meff is the effective mass of the resonator. Q
is the Q-factor of the resonator which is inverse proportional to the total damping of the
micromechanical resonator. All three LCR components are dependent on the square of η.
This indicates a square dependence of the electrode area Ael and a g4 dependence of the gap
between the resonator and the electrode. The electrical equivalents of the components are not
straightforward to interpret due to complicated relationships between the mass, stiffness and
damping of the resonator, as well as complicated relationship due to the electrostatic force.
4.3 The resonance frequency and its implications
4.3.1 The nominal resonance frequency
The natural frequency of the resonator with no voltage applied is given by equation 15 below
(Senturia, 2001):
1
k
f 0(eff ) =
Λn
(15)
2π
m
36
Wireless Sensor Networks
where k is the static beam stiffness and m is the static beam mass of the micromechanical system.
Λn is a constant depending on mode number. A mode is a certain frequency in which the
resonator will have a maximum vibration amplitude. A micromechanical resonator may have
several modes at distinct frequencies. Λn has different values for different modes. For example,
Λ1 =1.0302 for mode 1, Λ2 =40.460 for mode 2, Λ3 =317.219 for mode 3 etc. The resonator is
operated in the first mode (Λ1 ). Both k and m depends on the geometry and structural material
of the resonator. The values for Λn used here is valid only for the cantilever beam architecture,
other types of resonators will have different values of Λn .
4.3.2 The effective resonance frequency and Q-factor
The movable parts of the resonator will all vibrate back and forth with the resonance frequency
ω0 . The tip of the beam will have a longer distance to move and will thus have a higher velocity
´
v compared to the part of the cantilever beam which is closer to the anchor. Because the kinetic
´
energy (Ek = 1 2 meff v2 ) must be the same throughout the beam when it vibrates, the effective
/
mass along the beam in the y-direction in figure 6 will vary. The effective mass is defined as
meff where the largest value appears close to the anchor while the smallest value appears at
the tip of the beam. The derivation of meff is not shown here but can be developed by using
the equation for kinetic energy. By using equation 15 and rearranging, the mechanical spring
stiffness can be defined as:
k m (y) = 2π f 0(eff )
2
meff (y)
(16)
Equation 16 shows the pure mechanical spring stiffness of the beam when it vibrates. k m (y)
varies along the beam in the y-direction with a maximum value close to the anchor and a
minimum value close to the tip of the beam. However, when applying a DC voltage VP to
the beam, the total spring stiffness of the beam will be reduced. The resulting effective spring
stiffness value kr is reduced due to an electric spring value k e . Because of this fact, the resonance
frequency of the cantilever beam will be reduced as described in the following equation:
f 0 = f 0(eff )
1−
ke
km
(17)
where the relationship ke/km determines the amount of reduction of the original nominal
resonance frequency f 0(eff ) . The effective spring stiffness kr is defined as:
(18)
kr = km − ke
where kr is known as the effective beam stiffness. kr is the result of subtracting the electrical
spring stiffness k e from the effective mechanical spring stiffness k m (spring-softening). The
effective beam stiffness is more precisely defined as,
kr = 2π f 0(eff )
2
meff (y) −
We2
We1
2
VP
ε 0 Wr dy
[ g(y )]3
(19)
where the second term of equation 19 describes the electrical spring stiffness at a specific
location y centered on an infinitesimal length of the electrode dy . The k e part consists of
integrating from the start of the electrode (We1 ) to the end of the electrode (We2 ). The variable
part of the k e equation is the gap which varies along the y-axis throughout the beam length. The
Low-power Sensor Interfacing and MEMS for Wireless Sensor Networks
37
2
k e equation is derived from the potential energy equation U = 1 2 CVP . The gap as a function
/
of y can be described as (Bannon et al., 2000):
1 2
g(y) = g0 − VP ε 0 Wr
2
We2
We1
Xmode (y)
1
dy
k m (y )[ g(y )]2 Xmode (y )
(20)
where g0 is the static electrode-to-resonator gap with VP = 0. Xmode is an equation that describes
the shape of how the cantilever beam bends. The second term describes the displacement
of the resonator towards the electrode at various locations of y. As can be seen in equation
18, if k e becomes equal to k m , the resonance frequency should become zero. However, before
that would occur, the resonator will enter an unstable state which will pull the beam towards
the electrode instead. This effect is known as the "pull-in" effect. Due to the reduction of
the original natural frequency of the resonator, the Q-factor will also be reduced in a similar
manner. The Q-factor is mainly affected by four factors: Anchor loss, environmental (viscous
gas) damping, thermoelastic damping or internal (material) energy loss. The topic of damping
mechanisms for MEMS resonators is not trivial, therefore it is typical to do crude estimates for
the nominal Q-factor as a starting point for analysis (Bannon et al., 2000).
Qeff = Qnom
1−
ke
km
(21)
From equation 17 and equation 21 we can conclude that when increasing the VP value, both
the resonance frequency and the Q-factor of the resonator are reduced. For oscillators, a high
Q-factor is desirable, therefore it is important to also include this reduction of the Q-factor for
correct modeling.
4.4 Nonlinear behavior
As described by equation 17, the oscillation frequency is tuned by using VP . In order to get a
good tuneability of the MEMS resonator, it is designed to be soft so that it can operate at low
voltages and at the same time have a reasonable tuning range. However, when a beam is too
soft, non-linear effects become more dominant. We can classify two different types of resonator
non-linearities (Kaajakari et al., 2005; 2004):
• Mechanical non-linearity: Typically non-elasticity due to geometrical and material effects
• Capacitive non-linearity: Introduced due to an inverse relationship between the displacement and the ”parallel” plate capacitance
Mechanical non-linearity will be more prominent in other resonator architectures such as
the clamped-clamped beam, we will therefore focus on the capacitive non-linearities for this
analysis. In order to develop an understanding of the introduction of the capacitive nonlinearity, we must take a look at the equation describing the motion of the resonator:
ă
meff x + b x + kr x = F (t)
(22)
Equation 22 describes the equation of movement of the resonator due to an external force. This
equation is basically the same as equation 3 where the external force is the electrostatic force.
The equation of movement is related to the effective mass meff , the damping b (which is inverse
proportional to Q), and the effective spring stiffness kr . In this equation kr has a mechanical
38
Wireless Sensor Networks
term k m and an electrical term k e as described earlier. For a case where k e is linear, the motion
of the amplitude becomes:
FQeff
X0 =
(23)
kr
Equation 23 shows the displacement of the tip of the beam at resonance. However, when
the resonator has a low mechanical stiffness k m , and is at the same time operated with large
VP values, the linear k e model becomes inaccurate. Therefore the following equation is used
instead:
(24)
k e ( x ) = k e0 1 + k e1 x + k e2 x2 + ...k en x n
From equation 24, we can see that the spring stiffness consists of higher order terms that all are
related to the displacement x (Kaajakari et al., 2005). The k e0 term is the first term and is linear.
k e1 and k e2 are square and cubic electrical spring coefficients respectively:
k e0 = −
2
VP C0
3
2
, k e1 =
,k = 2
2
2g e2
g
g
(25)
The k e ( x ) terms contribute to reducing or increasing the frequency depending on which term
that dominates. When operating the resonator with high vibration amplitudes, the square and
cubic spring stiffness terms will become more dominant. Because the amplitude-frequency
curve no longer becomes a single valued function, the oscillation may become chaotic once the
amplitude is larger than a critical value known as xc . The maximum usable vibration value is
extracted from the largest value that appears before a bifurcation (hysteresis of the curve). The
bifurcation amplitude and critical amplitude are respectively (Kaajakari et al., 2005):
xb =
√
where
κ=
1
3Q|κ |
, xc =
2
√
3 3Q|κ |
5k2 k2
3k e2 k e0
− e1 2e0
8k
12k
(26)
(27)
Figure 7 is an example of how κ will affect the response out from the resonator. κ1 is the lowest
value and κ3 is the largest value. In this example, κ is positive and contributes to increase in
the resonance frequency as well as tilting the curve to the left. κ1 is the lowest value and shows
less tilting of the curve. When κ is too large (see κ3 ), the curve enters a state of hysteresis. At
the point when the hysteresis starts, the bifurcation amplitude xb is reached. For any curve
with a hysteresis, the maximum usable amplitude of vibration is xc as shown in figure 7b. xc is
always larger than xb and ultimately sets the limit for the maximum vibration amplitude as
well as it sets the maximum output current from the resonator. Because κ is a factor which will
contribute to a modified resonance frequency due to the spring stiffness non-linearities, the
new resonance frequency is therefore expressed as,
2
ω0(effective) = ω0 1 + κX0
(28)
From equations 27 and 28 we can see that κ will either increase (resonator becomes more stiff)
the operational resonance frequency or decrease the resonance frequency. The resonator used
here will have a positive κ, thus the capacitive non-linearities will contribute to stiffen the
Low-power Sensor Interfacing and MEMS for Wireless Sensor Networks
39
8
10
x = maximum
κ
c
1
amplitude when
the response
shows hysteresis
κ
2
x = Hysteresis
κ3
8
b
point
Response
Response
Increasing
hysteresis
effect
10
7
10
7
10
−0.5
−0.4
−0.3
−0.2
−0.1
0
0.1
Frequency offset
0.2
0.3
0.4
−0.2
0.5
−0.15
−0.1
(a) Increasing κ
−0.05
0
0.05
Frequency offset
0.1
0.15
0.2
(b) Hysteresis for κ3
Fig. 7. Bifurcation and critical bifurcation
resonator. Because κ contributes to ”stiffen” the output response, more VP must be applied than
first estimated in equation 17. By using equation 26 and 27, an expression for the maximum
output current possible from the resonator is developed:
imax = ηω0 xc
o
(29)
imax sets the limit for how much current that can be registered at the output electrode before
o
bifurcation. The difference between equation 10 and equation 29 is that the maximum current
is limited by the critical vibration xc instead. It is also possible to define the maximum energy
stored in the resonator by using xc in a similar manner.
max
Estored =
1
k x2
2 0 c
(30)
where k0 is a linear spring constant (k0 = k m − k e0 ). The maximum energy stored also determines the energy dissipation out from the resonator which is,
Pdissipated = R x i2 =
o
max
ω0 Estored
Q
(31)
In order to understand the stability of the resonance frequency, the phase-noise of the system
can be evaluated. This is possible by using Leeson’s equation to model the phase-noise-tocarrier ratio in an ideal oscillator:
L(∆ f ) = 10log
kT Q
max
πEstored f 0
f0
2Q∆ f
1+
2
(32)
where k is Boltzmann’s constant and T is the absolute temperature (Shao et al., 2008). It is
common to relate equation 32 to equation 31 and also add a buffer noise source from the
amplifier following the resonator as given by (Kaajakari et al., 2004):
L(∆ω ) =
2kT
Pdissipated
ω0
2Q∆ω
buffer
2
+
PN
2Pdissipated
(33)
40
Wireless Sensor Networks
buffer
where PN
is buffer noise from an amplifier source. This value can be set to −155 dBm √ Hz
/
4n V/√
(or vn =
for a 50Ω system). The equation for phase noise will be shown in a practical
Hz
example in section 5.2.
4.5 Integration of MEMS in CMOS
There are three main methods of integrating MEMS in a CMOS process: 1. Insert the MEMS
before the CMOS is made. 2. Insert the MEMS in between CMOS process steps. 3. Insert the
MEMS after the CMOS has been made. In this demonstration, we will focus on the third step
where the MEMS is made after the CMOS has been made which is known as post-CMOS. We
will not go into the details of the process here for the sake of simplicity.
Silicon substrate
Metal layers 1 to 4
Metal layer 5
MEMS resonator structure
(stack of metal-dielectric from M1 to M5)
Metal layer 6 or 7;
shielding layer
Dielectric layers
CMOS circuitry
Remaining dielectric layers
after the first etch step
S
Vias
S
Silicon substrate
(a)
(b)
S
CMOS shielded by
the top metal layer
Released MEMS resonator
Resulting silicons profile
after the third etch step
S2
E2
(c)
(d)
Fig. 8. The CMOS-MEMS process steps
The CMOS-MEMS process demonstrated here is inspired by previous work done at some
universities (Ramstad, 2007; Fedder & Mukherjee, 2005; Sun et al., 2009). For low-power
applications it is interesting to try to integrate MEMS in a deep sub-micron CMOS process.
Figure 8 shows the process steps that have been used for a general deep sub-micron CMOS
process. The steps a) to d) consist of the following:
a) The wafer before etching
b) Anisotropic etching of the dielectric
c) Etching of silicon using DRIE
d) Isotropic release-etch of silicon
This list shows the steps performed in order to etch and release MEMS structure(s). From figure
8 it can be seen that the top metal layer will act as a mask and define the MEMS structures. The
MEMS resonator and electrodes consist of a stack of metals and dielectrics from metal layer 1 to
metal layer 5. Areas that are not to be etched must be protected by a top metal layer (i.e. metal
layer 6 or 7). The cross-section reveals that the CMOS must be placed a certain distance away
from the open areas where the MEMS structures are etched and defined. The thickness of the
resulting MEMS structure depends on the amount of metal layers that are used. The thickness
of the metal-dielectric stack influences the smallest possible gap between a resonator and an
Low-power Sensor Interfacing and MEMS for Wireless Sensor Networks
41
electrode. There are also rules which define the smallest possible width of a structure and the
largest possible width of a structure. There are more CMOS-MEMS rules than discussed here,
but these are some of the most important ones when combining CMOS and MEMS on-chip by
making MEMS structures from the metal layers offered by a general CMOS process.
4.6 The oscillator circuit
The MEMS resonator described in section 4.1 is made using a conventional 90 nm CMOS
process using the same process steps as described in section 4.5. By putting the micromechanical
resonator in a feedback loop with an amplifier, we get the basic oscillator circuit as shown in
figure 9 below:
VDD
Amplifier
A
Vout
B
Resonator
B
R
VP
Fig. 9. Basic oscillator circuit
An oscillator is defined as a circuit that produces a periodic output signal at a fixed frequency.
The resonator is the element in the circuit which defines the resonance frequency while the
amplifier is the active element which sustains oscillation. The bias voltage VP applied to
the resonator is used to tune the frequency of this voltage-controllable oscillator. In this
demonstration, the Q-factor of the resulting metal-dielectric MEMS structure is lower compared
to state-of-the-art MEMS and will contribute to increase the motional impedance R x which
is seen in series with the amplifier. The low Q-factor will also lead to a large phase-noise.
Both these two factors are not critical here as this is a demonstration to show MEMS directly
combined with CMOS processing that could lead to future interesting applications. Even
though R x is large, the amplifier will be able to initiate and sustain oscillation. In order for the
oscillator to start up the impedance from the amplifier has to be negative and at least three
times larger than the total impedance that is in series with the amplifier. The total impedance
consists of parasitics in the circuit plus the motional impedance from the resonator. More
details of how to start up and sustain oscillation is not described here but can be investigated
further in reference (Ramstad, 2007; Vittoz et al., 1998). In figure 9, element A is realized as a
Pierce Amplifier, element R is realized as the resonator described in section 4.1, while the two
B elements are buffers to amplify the signal for the following FDSM stage.
5. System simulation
In order to investigate the viability of our proposed system, and to discover potential problems,
we devised a simulation model of the system. In this section, we first present our simulation of
the full FDSM and MEMS system. We then go on to describe our experiment, and finally we
discuss the simulation results.
42
Wireless Sensor Networks
5.1 Method
As the output frequency of the MEMS oscillator in this case is low, a first-order oversampled
FDSM as the F/D converter is appropriate. A detailed simulation model would be too computationally demanding to be of practical use. It would also require a mechanical simulation for
the MEMS part in co-simulation with the electrical FDSM netlist. We therefore implemented the
simulation model using Verilog-A (Accellera Organization, Inc., 2008) building blocks running
on a commercial SPICE simulator. An outline of the simulation model is depicted in figure
10. The output from this model is a sampled single-bit bitstream, y[n]. The bitstream was
then decimated to a stream of output words, which were finally post-processed to compensate
for the non-linearity of the MEMS resonator. In the following subsections we describe the
components of our simulation model in more detail.
Oscillator model
Input
source
VP → VC
mapping
VCO
D
Q
D
Q
DFF
CK
y[n]
DFF
CK
Sampling
clock
Fig. 10. Simulation model outline
5.1.1 The oscillator circuit
The modeling of the resonator has mostly been done by using analytical scripts from the
equations described in section 4. Due to the non-linearity of the MEMS resonator for large
values of VP , the need for a more sophisticated simulation tool became apparent. By using a
Finite Element Method (FEM) software tool, an accurate simulation of the resonance frequency
and beam displacement as a function of the VP voltage is performed. The results from the
FEM simulations are back annotated into the analytical script in order to develop correct RLC
equivalents, resonator output current as well as a correct model of the phase-noise. The total
VCO model is then described by using Verilog-A. The VCO model is in itself a linear VCO.
The non-linearity (arising from the MEMS resonator) is applied as a pre-distortion of the input
signal, mapping the tuning voltage, VP , to a VCO control voltage, VC , using a table_model
construct in Verilog-A code. This gives the designer, flexibility and makes it easy to switch
between different VCO characteristics.
Figure 11 shows the implementation of the MEMS resonator where this cantilever beam is
100µm long, 1µm wide and a few microns thick. This is a resonator which is easy to tune
in frequency because its mechanical stiffness is rather low. A fixed-fixed beam would allow
a higher operational frequency, but is in turn more difficult to tune. A different resonator
architecture as a tunable MEMS resonator can be developed, however in this chapter we focus
on a simple MEMS architecture in order to point out the non-linearity problem and the resulting
phase-noise of this CMOS-MEMS resonator.
The amplifier in the oscillator circuit is a Pierce amplifier which is a single-ended solution. The
Pierce amplifier is a simple topology that has low stray reactances and little need for biasing
resistors which would lead to more noise. By tuning the bias current in the Pierce amplifier,
the gain (or equivalent negative impedance) increases. The MEMS resonator is typically the