Báo cáo hóa học: " Research Article Color-Based Image Retrieval Using Perceptually Modified Hausdorff Distance" ppt
Bạn đang xem bản rút gọn của tài liệu. Xem và tải ngay bản đầy đủ của tài liệu tại đây (8.86 MB, 10 trang )
Hindawi Publishing Corporation
EURASIP Journal on Image and Video Processing
Volume 2008, Article ID 263071, 10 pages
doi:10.1155/2008/263071
Research Article
Color-Based Image Retrieval Using Perceptually Modified
Hausdorff Distance
Bo Gun Park, Kyoung Mu Lee, and Sang Uk Lee
Department of Electrical Engineering, ASRI, Seoul National University, Seoul 151-742, South Korea
Correspondence should be addressed to Kyoung Mu Lee,
Received 31 July 2007; Accepted 22 November 2007
Recommended by Alain Tremeau
In most content-based image retrieval systems, the color information is extensively used for its simplicity and generality. Due
to its compactness in characterizing the global information, a uniform quantization of colors, or a histogram, has been the most
commonly used color descriptor. However, a cluster-based representation, or a signature, has been proven to be more compact and
theoretically sound than a histogram for increasing the discriminatory power and reducing the gap between human perception
and computer-aided retrieval system. Despite of these advantages, only few papers have broached dissimilarity measure based on
the cluster-based nonuniform quantization of colors. In this paper, we extract the perceptual representation of an original color
image, a statistical signature by modifying general color signature, which consists of a set of points with statistical volume. Also
we present a novel dissimilarity measure for a statistical signature called Perceptually Modified Hausdorff Distance (PMHD) that
is based on the Hausdorff distance. In the result, the proposed retrieval system views an image as a statistical signature, and uses
the PMHD as the metric between statistical signatures. The precision versus recall results show that the proposed dissimilarity
measure generally outperforms all other dissimilarity measures on an unmodified commercial image database.
Copyright © 2008 Bo Gun Park et al. This is an open access article distributed under the Creative Commons Attribution License,
which permits unrestricted use, distribution, and reproduction in any medium, provided the original work is properly cited.
1. INTRODUCTION
With an explosive growth of digital image collections, con-
tent-based image retrieval (CBIR) has been emerged as one
of the most active and challenging problems in computer vi-
sion as well as multimedia applications. Content-based im-
age retrieval differs from the traditional text-based image re-
trieval in that images would be indexed by the visual fea-
tures, such as color, texture, and shape [1–3].Inordertore-
flect the human perception precisely, there have been lots of
image retrieval systems, which are based on the query-by-
example scheme, including QBIC [4], PhotoBook [5], Visu-
alSEEK [6], and MARS [7]. Actually, low-level visual con-
tentsdonotproperlycapturehumanperceptualconcepts,
so closing the gap between them is still one of the ongoing
problems. However, a series of psychophysical experiments
reported that there is a significant correlation between visual
features and semantically relevant information [8]. Based on
these findings, many techniques have been introduced to im-
prove the perceptual visual features and dissimilarity mea-
sures, which enable to achieve semantically correct retrieval
performances [1, 9–14].
Among variety of visual features, color information is the
most frequently used visual characteristic. Color histogram
(or fixed-binning histogram) is widely employed as a color
descriptor due to its simplicity of implementation and in-
sensitivity to similarity transformation [9, 15]. However, in
some cases, these simple histogram-based indexing meth-
ods fail to match perceptual (dis)similarity [16]. Moreover,
since the color histogram is sensitive to the variation in color
distribution, the performances of these methods usually de-
pend severely on the quantization process in color space.
To overcome these drawbacks, a clustering-based representa-
tion,signature (or adaptive-binning color histogram)hasbeen
proposed [12–14, 16–21]. Based on the psychophysical fact
that at the first perception stage the human visual system
identifies the dominant colors and cannot simultaneously
perceive a large number of colors [12], cluster-based tech-
niques generally extract dominant colors and their propor-
tions to describe the overall color information. Also, a signa-
ture represents a set of clusters compactly in a color space and
the distribution of color features. Therefore, it can reduce the
complexity of representation and the cost of retrieval pro-
cess.
2 EURASIP Journal on Image and Video Processing
Once two sets of visual features, represented by a his-
togram or a signature, are given, we need to determine how
similar one is from the other. A number of different dis-
similarity measures have been proposed in various areas of
computer vision. Specifically for histograms, Jeffrey diver-
gence, histogram intersection, and χ
2
-statistics have been
known to work successfully. However, these dissimilarity
measures cannot be directly applied to signatures. As alter-
natives to these metrics, Rubner and Tomasi [16] proposed
a novel dissimilarity measure for matching signatures, the
Earth Mover’s distance (EMD), which was able to overcome
most of the drawbacks in histogram-based dissimilarity mea-
sures and handle the partial matching between two images.
Dorado and izquierdo [17] also used the EMD as a metric to
compare fuzzy color signatures. However, the computational
complexity of the EMD is very high compared to other dis-
similarity measures. Leow and Li [19] proposed a new dis-
similarity measure called weighted correlation (WC) for sig-
natures, which is more reliable than Euclidean distance and
computationally more efficient than EMD. Generally, WC
produced better performance than that of EMD, however in
some cases, it showed worse results than those of the Jeffrey
divergence (JD) [22]. Mojsilovi
´
c et al. [12] introduced per-
ceptual color distance metric, optimal color composition dis-
tance (OCCD), which is based on the optimal mapping be-
tween the dominant color components with area percentage
of two images.
In this paper, we extract the compact representation of an
original color image, a statistical signature by modifying gen-
eral color signature, which consists of the representative color
features and their statistical volume. Then a novel dissimi-
larity measure for matching statistical signatures is proposed
based on the Hausdorff distance. The Hausdorff distance is
an effective metric for the dissimilarity measure between two
sets of points [23–25], that is also robust to the outliers and
geometric variations in certain degree. Recently, it has been
applied to video indexing and retrieval [26]. However, it was
simply designed for color histogram model. To overcome this
drawback, we propose a new perceptually modified Haus-
dorff distance (PMHD) as a measure of dissimilarity between
statistical signatures, that is consistent with human percep-
tion. Moreover, to cope with the partial matching problem,
a partial PMHD metric is designed by incorporating outlier
detection scheme. The experimental results on a real image
database show that the proposed metric outperforms other
conventional dissimilarity measures.
This paper is organized as follows. In Section 2, we in-
troduce a statistical signature as a color descriptor. Section 3
proposes a novel dissimilarity measure, PMHD, and partial
PMHD for partial matching. Then, Section 4 presents the ex-
perimental results and discussions on the effectiveness of the
proposed metric. Finally, conclusions are drawn in Section 5.
2. A COLOR IMAGE DESCRIPTOR:
A STATISTICAL SIGNATURE
In order to retrieve visually similar images to a query image
using color information, a proper color descriptor for the im-
ages should be designed. Recently, it has been proven that a
signature can describe the color distribution more efficiently
than a color histogram [16, 17, 19]. And a signature is ap-
propriate for describing each image independently of other
images in an image database.
In this paper, we represent an original color image by a
statistical signature defined as
S
=
s
i
, w
i
, Σ
i
|
i = 1, , N
,
(1)
where N is the number of clusters, s
i
is the mean feature vec-
tor of ith cluster, w
i
is the number of the features that belong
to ith cluster, and Σ
i
is the covariance matrix of ith cluster.
Vari et y of d ifferent clustering methods can be used to con-
struct a statistical signature from a color image. In this paper,
we used k-means algorithm [27] to cluster color features in
CIELab color space.
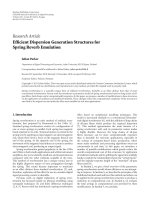
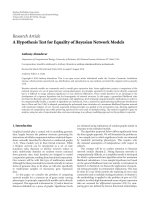
Figure 1 shows two sample images quantized by using
the proposed statistical signature. We could observe that not
much perceptual color degradation has occurred, regardless
of a great amount of representation data reduction in color
space by the clustering.
3. A NOVEL DISSIMILARITY MEASURE FOR
A STATISTICAL SIGNATURE
3.1. Hausdorff distance
It has been shown that the Hausdorff distance (HD) is an ef-
fective metric for the dissimilarity measure between two sets
of points in a number of computer vision literatures [23–
25, 28], while insensitive to the variations and noise.
In this section, we briefly describe the HD. More details
can be found in [23–25, 28]. Given two finite point sets, P
1
=
{
p
1
1
, , p
1
N
} and P
2
={p
2
1
, , p
2
M
}, the HD is defined as
D
H
=
P
1
, P
2
=
Max
d
H
P
1
, P
2
, d
H
P
2
, P
1
,(2)
where
d
H
(P
1,
P
2
) = max
p
1
∈P
1
min
p
2
∈P
2
p
1
− p
2
,(3)
and the function d
H
is the directed HD between two point
sets.
3.2. Perceptually modified Hausdorff distance
In this paper, we propose a novel dissimilarity, called percep-
tually modified Hausdorff distance (PMHD) measure based
on HD for comparison of statistical signatures.
Given two statistical signatures, S
1
={(s
1
i
, w
1
i
, Σ
1
i
) | i =
1, , N} and S
2
={(s
2
j
, w
2
j
, Σ
2
j
) | j = 1, , M},anoveldis-
similarity measure between two statistical signatures is de-
fined by
D
H
S
1
, S
2
= Max
d
H
S
1
, S
2
, d
H
S
2
, S
1
,(4)
where d
H
(S
1
, S
2
)andd
H
(S
2
, S
1
) are directed Hausdorff dis-
tances between two statistical signatures.
Bo Gun Park et al. 3
(a) (b) (c)
Figure 1: Sample images quantized using k-means clustering: (a) original image with 256 758 colors, and quantized images based on a
random signature with (b) 10 colors, and (c) 30 colors.
The directed Hausdorff distance is defined as
d
H
S
1
, S
2
=
i
w
1
i
× min
j
d
s
1
i
, s
2
j
/min
w
1
i
, w
2
j
i
w
1
i
,
(5)
where d
s
1
i
, s
2
j
is the distance between two color features, s
1
i
and s
2
j
in S
1
and S
2
, respectively. In this paper, we consider
three different distances for d
s
1
i
, s
2
j
: the Euclidean distance,
the CIE94 color difference, and the Mahalanobis distance.
In order to guarantee that the distance is perceptually uni-
form, the CIE94 color difference equation is used instead of
the Euclidean distance in CIELab color space [29, 30]. While
the Euclidean distance and the CIE94 simply measure the
geometric distance between two feature vectors in the Eu-
clidean coordinates without considering the distribution of
color features, the Mahalanobis distance explicitly considers
the distribution of color features after clustering process [31].
Three distances are defined as follows.
(i) Euclidean distance:
d
E
s
1
i
, s
2
j
=
3
k=1
s
1
i
(k) − s
2
j
(k)
2
,
(6)
where s
1
i
(k)ands
2
i
(k) are the kth elements of s
1
i
and s
2
i
,
respectively.
(ii) CIE94 color difference:
d
CIE94
s
1
i
, s
2
j
=
ΔL
∗
k
L
S
L
2
+
ΔC
∗
k
C
S
C
2
+
ΔH
∗
k
H
S
H
2
1/2
,
S
L
= 1, S
C
= 1+0.045ΔC
∗
, S
H
= 1+0.015ΔC
∗
,
k
L
= k
C
= k
H
= 1,
(7)
where ΔL
∗
, ΔC
∗
,andΔH
∗
are the differences in light-
ness, chroma, and hue between s
1
i
and s
2
j
.
(iii) Mahalanobis distance:
d
M
s
1
i
, s
2
j
=
s
2
j
− s
1
i
T
1
−1
Σ
i
s
2
j
− s
1
i
. (8)
Note that in order to take into account the size of clus-
ters in matching, we penalize the distance between two color
feature vectors by the minimum of their corresponding sizes
as in (5). This reflects the fact that color features with a large
size influence more the perceptual similarity between images
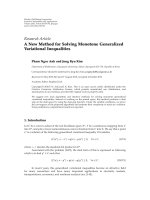
than the smaller ones [12]. Let us consider an example as in
Figure 2(a). There are two pairs of feature vectors denoted
by circles centered at the mean feature vectors. The radius of
each circle represents the size of the corresponding feature.
If we compute only the geometric distance without consid-
ering the size of two feature vectors, two distances d
1
and d
2
will be equal. However, perceptually d
2
must be smaller than
d
1
. Another example is given in Figure 2(b), where three fea-
ture vectors are shown. Again, if we consider only the geo-
metric distance, d
1
will be smaller than d
2
.However,infact,
perceptual d
2
is smaller than d
1
.
Thus, by combining the set theoretical metric and per-
ceptual notion in the dissimilarity measure, the proposed
PMHD becomes relatively insensitive to the variations of
mean color features in a signature, and consistent with hu-
man perception.
3.3. Partial PMHD metric for partial matching
In certain cases, a user may have a partial information of the
target images as the query, or wants to extract all the images
including partial information of the query. In these cases,
conventional techniques with global descriptor are not ap-
propriate. Like a color histogram, a signature is also a global
descriptor of a whole image. So, the direct application of the
HD as in (4) cannot cope with occlusion and clutter in im-
age retrieval or object recognition [16, 28, 32]. In order to
handle partial matching, Huttenlocher et al. [23] proposed
a partial HD based on ranking, which measures the differ-
ence between portions of point sets. Also, Azencott et al. [25]
further modified the rank-based partial HD by order statis-
tics. But, these distances were shown to be sensitive to the
parameter changes. In order to address these problems, Sim
et al. [28] proposed two robust HD measures, M-HD and
LTS-HD, based on the robust statistics such as M-estimation
and least trimmed square (LTS). Unfortunately, they are not
appropriate for image retrieval system because they are com-
putationally too complex to search a large database.
4 EURASIP Journal on Image and Video Processing
s
i
s
j
s
i
s
j
d
1
d
2
(a)
s
i
s
j
s
k
d
1
d
2
(b)
Figure 2: An example of perceptual dissimilarity based on the densities of two color features.
In this paper, in order to remedy the partial matching
problem, we detect and exclude the outliers first by an outlier
test function, and then apply the proposed PMHD to the re-
maining feature points. Let us define the outlier test function
by
f (i)
=
⎧
⎪
⎪
⎨
⎪
⎪
⎩
1, min
j
d
s
1
i
, s
2
j
min
w
1
i
, w
2
j
<Dth,
0, otherwise,
(9)
where Dth is a prespecific threshold for the outlier detection.
The above function indicates that s
1
i
is inlier if f (i) = 1, oth-
erwise outlier.
Now let us define two directed Hausdorff distances with
and without outliers by
d
a
H
(S
1
, S
2
) =
i
w
1
i
× min
j
d
s
1
i
, s
2
j
/min
w
1
i
, w
2
j
i
w
1
i
,
d
p
H
(S
1
, S
2
) =
i
w
1
i
× min
j
d
s
1
i
, s
2
j
/min
w
1
i
, w
2
j
×
f (i)
i
w
1
i
× f (i)
,
(10)
respectively.
Then the new modified directed partial PMHD is ob-
tained by
d
H
S
1
, S
2
=
⎧
⎪
⎪
⎨
⎪
⎪
⎩
d
a
H
S
1
, S
2
,
i
w
1
i
× f (i)
i
w
1
i
>Pth,
d
b
H
S
1
, S
2
, otherwise,
(11)
where Pth is a prespecific threshold for the control of a fac-
tion of information loss.
4. EXPERIMENTAL RESULTS
4.1. The database and queries
To evaluate the retrieval precision and recall performance of
the proposed retrieval system, several experiments have been
conducted on a real database. We used 5200 images selected
from commercially available Corel color image database
without any modification. There are 52 semantic categories,
each of them containing 100 images. Among those, we have
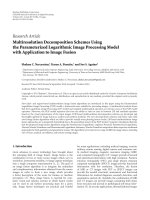
chosen four sets of data including Cheetah, Eagle, Pyramids,
and Royal guards as the query. Some example images in the
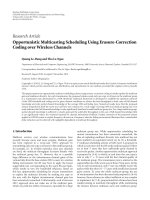
queries are shown in Figure 3.WenoteinFigure 3 that since
the original categorization of images was not based on the
color information, substantial amount of variations in color
still exist even in the same category. Nonetheless, in this
experiment, we used all images in these four categories as
queries. We computed a precision and recall pair to all query
categories, which is commonly used as the retrieval perfor-
mance measurement [33]. The precision P and recall R are
defined as
P
=
r
n
, R
=
r
m
,
(12)
where r is the number of retrieved relevant images, n is the
total number of retrieved images, and m is the total num-
ber of relevant images in the whole database. The precision P
measures the accuracy of the retrieval and the recall R mea-
sures the effectiveness of the retrieval performance.
4.2. Retrieval results for queries
The performance of the proposed PMHD was compared
with five well-known dissimilarity measures, including his-
togram intersection (HI), χ
2
-statistics, Jeffrey divergence (JD),
and quadratic form (QF) distance, for the fixed binning his-
togram, and EMD for the signature.
Let H
1
and H
2
represent two color histograms or signa-
tures. Then, these five dissimilarity measures are defined as
follows.
(1) Histogram intersection (HI) [34]:
d
H
1
, H
2
= 1 −
i
min
h
1
i
, h
2
i
i
h
2
i
,
(13)
where h
j
i
is the number of elements in the ith bin of H
j
Bo Gun Park et al. 5
(a)
(b)
(c)
(d)
Figure 3: Example query images from four categories in the Corel database. (a) Eagle, (b) Cheetah, (c) Pyramids, and (d) Royal guards.
(2) χ
2
-statistics :
d
H
1
, H
2
=
i
h
1
i
− m
i
2
m
i
,
(14)
where m
i
= (h
1
i
+ h
2
i
)/2.
(3) Jeffrey divergence (JD) [22]:
d
H
1
, H
2
=
i
h
1
i
log
h
1
i
m
i
+ h
2
i
log
h
2
i
m
i
,
(15)
where again m
i
= (h
1
i
+ h
2
i
)/2
6 EURASIP Journal on Image and Video Processing
(4) Quadratic form (QF) distance [4, 35]:
d
H
1
, H
2
=
H
1
− H
2
T
A
H
1
− H
2
,
(16)
where A is a similarity matrix that encodes the cross-
bin relationships based on the perceptual similarity of
the representative colors of the bins.
(5) EMD [16, 36]:
d
H
1
, H
2
=
i,j
g
ij
d
ij
i,j
g
ij
,
(17)
where d
ij
denotes the dissimilarity between the ith and
jth bins, and g
ij
is the optimal flow between two distri-
butions. The total cost
i,j
g
ij
d
ij
is minimized subject
to the constraints,
g
ij
≥ 0,
i
g
ij
≤ h
2
j
,
j
g
ij
≤ h
1
i
,
i,j
g
ij
= min
i
h
1
i
,
j
h
2
j
.
(18)
As reported in [36], EMD yielded a very good retrieval
performance for the small sample size, while JD and χ
2
per-
formed very well for the larger sample sizes. Leow and Li [19]
proposed the novel dissimilarity measure, weighted correla-
tion (WC) which can be used to compare two histograms
with different binnings. In the image retrieval, the perfor-
mance of WC was comparable to other dissimilarity mea-
sures, but not good as JD. Therefore, in this paper, we evalu-
ated only the performance of JD.
In order to represent a color image as a fixed histogram
representation, the RGB color space was uniformly parti-
tioned into 10
× 10 × 10 = 1000 color bins. And a color was
quantized to the mean centroid of the cubic bin. While, as
mentioned in Section 2, a statistical signature was extracted
by applying K-means clustering. To compare the perfor-
mance of the signature-based dissimilarity with other fixed
histogram-based ones, the quantization level was matched by
clustering a color image into only 10 color feature clusters.
The mean color quantization error of the 10
× 10 × 10 -bin
histogram is 5.99 CIE94 units and that of quantized image-
based on a statistical signature containing 10 color feature
vectors was 5.26 CIE94 units. It is noted that the difference
between two quantized image errors are smaller than the per-
ceptibility threshold of 2.2 CIE94 units [37], where two col-
ors are perceptually indistinguishable [19]. The performance
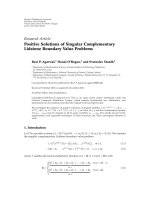
of retrieval results of the proposed metric and other dissim-
ilarity measures are summarized by the precision-recall in
Figure 4. It is noted that the proposed PMHD dissimilarity
measure significantly outperformed other dissimilarity mea-
suresforallqueryimages.TheperformanceofPMHDis,
on average, 20–30% higher than the second highest preci-
sion rate over the meaningful recall values. And the perfor-
mance of PMHD with Euclidean distance is almost the same
as that of PMHD with CIE94, and usually performed best in
the image retrieval. It is somewhat surprisingly noted that
EMD performed poorer than other dissimilarity measures
in all query categories except “Eagle.” This is not coincident
Table 1: The best parameters for partial matching: (Dth, Pth).
Query
Distances
Mahalanobis Euclidean CIE94
Eagle (50,0.6) (50,0.7) (50,0.8)
Cheetah (80,0.8) (90,0.9) (90,0.9)
Pyramids (100,0.7) (50,0.6) (30,0.6)
Royal guards (30,0.6) (100,0.9) (40,0.6)
with the results reported in [16, 36], where EMD performed
very well for the small sample sizes and compact represen-
tation but not so well for large sample sizes and wide repre-
sentation. As indicated in [19], the image size, the number
of color features in a signature, and the ground distance may
degrade the whole performance of EMD. However, as men-
tioned before, we only used a signature with 10 color features
in this experiment, which is a very compact representation.
We note that the large image size of 98 304 pixels or so and
the Euclidean ground distance may severely degrade the per-
formance of EMD.
4.3. Dependency on the number of
color features in a signatures
In general, the quantization level of a color space, that is, the
number of clusters in a signature or the number of bins in the
fixed histogram, has an important effect on the overall image
retrieval performance. In order to investigate the effect of the
level of quantization, we examined the performance of the
proposed method according to the number of color features
in a signature. In this experiment, two quantization levels of
10 and 30 are compared. In addition, the results showed that
the mean color error of 30 color features case was 3.38 CIE94
units, which was much smaller than 5.26 CIE94 units, that of
the statistical signature with 10 color features. Figures 1(b)
and 1(c) show two sample quantized images of Figure 1(a) by
10 and 30 colors, respectively. It is noted that the quantized
image with 30 color features is almost indistinguishable from
the original image that contains 256 758 color features.
Figure 5 plots the precision-recall curves of the image re-
trieval results according to the number of color features in
a signature. We compared the retrieval performance of the
proposed PMHD with EMD, since EMD was the only dissim-
ilarity measure applicable to signatures. The precision rate of
EMD did not vary significantly as the number of color fea-
tures of a signature increased, as depicted in Figure 5. How-
ever, the precision rates of PHMD (especially with the Eu-
clidean and CIE94 distances) with 30 color features became
higher than that of PMHD with 10 color features. From this
result, we can expect that the performance of the proposed
PMHD gets better as the quantization error decreases. More-
over, this implies that PMHD performs especially well for the
large sample sizes as well as the compact representation.
4.4. Partial matching
In order to assess the performance of the proposed partial
PMHD, the same four queries in Figure 3 have been used.
Bo Gun Park et al. 7
1009181716151413121111
Recall (%)
0
5
10
15
20
25
30
35
40
45
50
55
60
Precision (%)
PMHD (Mahalanobis)
PMHD (Euclidean)
PMHD (CIE94)
EMD
JD
χ
2
statistics
QF
HI
(a)
1009181716151413121111
Recall (%)
0
5
10
15
20
25
30
Precision (%)
PMHD (Mahalanobis)
PMHD (Euclidean)
PMHD (CIE94)
EMD
JD
χ
2
statistics
QF
HI
(b)
1009181716151413121111
Recall (%)
0
5
10
15
20
25
30
35
40
45
50
55
60
Precision (%)
PMHD (Mahalanobis)
PMHD (Euclidean)
PMHD (CIE94)
EMD
JD
χ
2
statistics
QF
HI
(c)
1009181716151413121111
Recall (%)
0
10
20
30
40
50
60
70
80
90
100
Precision (%)
PMHD (Mahalanobis)
PMHD (Euclidean)
PMHD (CIE94)
EMD
JD
χ
2
statistics
QF
HI
(d)
Figure 4: Precision-recall curves for various dissimilarity measures on four query categories: (a) Eagle, (b) Cheetah, (c) Pyramids, and (d)
Royal guards.
The precision-recall performance has been obtained by vary-
ing two parameters, Dth and Pth. Figure 6 plots the best per-
formances and the used parameters are shown in Ta bl e 1.
It is noted that although the differences between retrieval
performances of two metrics were not significantly large, at
most 10% in the case of Eagle, the performance of the partial
PMHD mostly outperformed that of full PMHD.
There are some problems in employing the partial
PMHD. First, as can be noted in Table 1 ,itisdifficult to get
appropriate parameters automatically that can be adopted to
all queries. The values of parameters severely depend on the
type of query. Second, the performance of the partial PMHD
can be more worse than that of the PMHD in high recall rate,
as shown in Figure 6(a). Moreover, the complexity of the par-
tial PMHD is a little high compared to that of the PMHD.
Thus, in order to exploit the advantages of the partial PMHD
for CBIR, these drawbacks should be made up for properly.
5. CONCLUSION
In this paper, we proposed a novel dissimilarity measure for
color signatures, perceptually modified Hausdorff distance
8 EURASIP Journal on Image and Video Processing
1009181716151413121111
Recall (%)
0
5
10
15
20
25
30
35
40
45
50
55
60
Precision (%)
PMHD (Mahalanobis, 30)
PMHD (Euclidean, 30)
PMHD (CIE94, 30)
EMD (30)
PMHD (Mahalanobis, 10)
PMHD (Euclidean, 10)
PMHD (CIE94, 10)
EMD (10)
(a)
1009181716151413121111
Recall (%)
0
5
10
15
20
25
30
Precision (%)
PMHD (Mahalanobis, 30)
PMHD (Euclidean, 30)
PMHD (CIE94, 30)
EMD (30)
PMHD (Mahalanobis, 10)
PMHD (Euclidean, 10)
PMHD (CIE94, 10)
EMD (10)
(b)
1009181716151413121111
Recall (%)
0
5
10
15
20
25
30
35
40
45
50
55
60
Precision (%)
PMHD (Mahalanobis, 30)
PMHD (Euclidean, 30)
PMHD (CIE94, 30)
EMD (30)
PMHD (Mahalanobis, 10)
PMHD (Euclidean, 10)
PMHD (CIE94, 10)
EMD (10)
(c)
1009181716151413121111
Recall (%)
0
10
20
30
40
50
60
70
80
90
100
Precision (%)
PMHD (Mahalanobis, 30)
PMHD (Euclidean, 30)
PMHD (CIE94, 30)
EMD (30)
PMHD (Mahalanobis, 10)
PMHD (Euclidean, 10)
PMHD (CIE94, 10)
EMD (10)
(d)
Figure 5: Comparison of the retrieval performance for varying the number of color features in a signature: (a) Eagle, (b) Cheetah, (c)
Pyramids, and (d) Royal guards.
(PMHD) based on Hausdorff distance. PMHD is insensi-
tive to the characteristics changes of mean color features in a
signature, and theoretically sound for incorporating human
perception in the metric. Also, in order to deal with partial
matching, the partial PMHD was defined, which explicitly
removed outlier using the outlier detection function.
The extensive experimental results on a real database
showed that the proposed PMHD outperformed other con-
ventional dissimilarity measures. The retrieval performance
of the PMHD is, on average, 20–30% higher than the second
highest one in precision rate. Also the performance of the
partial PMHD was tested on the same database. Although
there were some unresolved problems including high com-
plexity and finding optimal parameters, the performance of
the partial PMHD mostly outperformed that of PMHD and
showed great potential for general CBIR applications.
In this paper, we have used only the color information
for the signature. However, recent studies showed that com-
bining multiple cues including color, texture, scale, and rele-
vance feedback can improve the results drastically and close
the semantic gap. Thus, combining these multiple informa-
tion in a multiresolution framework will be our future work.
Bo Gun Park et al. 9
10091817161514131211131
Recall (%)
0
10
20
30
40
50
60
70
80
90
Precision (%)
Mahalanobis (full)
Euclidean (full)
CIE94 (full)
Mahalanobis (partial)
Euclidean (partial)
CIE94 (partial)
(a)
10091817161514131211131
Recall (%)
0
5
10
15
20
25
30
35
40
Precision (%)
Mahalanobis (full)
Euclidean (full)
CIE94 (full)
Mahalanobis (partial)
Euclidean (partial)
CIE94 (partial)
(b)
10091817161514131211131
Recall (%)
0
10
20
30
40
50
60
70
Precision (%)
Mahalanobis (full)
Euclidean (full)
CIE94 (full)
Mahalanobis (partial)
Euclidean (partial)
CIE94 (partial)
(c)
10091817161514131211131
Recall (%)
0
10
20
30
40
50
60
70
80
Precision (%)
Mahalanobis (full)
Euclidean (full)
CIE94 (full)
Mahalanobis (partial)
Euclidean (partial)
CIE94 (partial)
(d)
Figure 6: Precision-recall curves for the partial matching: (a) Eagle, (b) Cheetah, (c) Pyramids, and (d) Royal guards.
ACKNOWLEDGMENTS
This work was supported in part by the ITRC program by
Ministry of Information and Communication and in part
by Defense Acquisition Program Administration and Agency
for Defense Development, Korea, through the Image Infor-
mation Research Center under Contract no. UD070007AD.
REFERENCES
[1] Y. Rui, T. S. Huang, and S F. Chang, “Image retrieval: current
techniques, promising directions, and open issues,” Journal
of Visual Communication and Image Representation, vol. 10,
no. 1, pp. 39–62, 1999.
[2] W.Y.MaandH.J.Zhang,Content-Based Image Indexing and
Retrieval, Handbook of Multimedia Computing, CRC Press,
Boca Raton, Fla, USA, 1999.
[3] B. Ionescu, P. Lambert, D. Coquin, and V. Buzuloiu, “Color-
based content retrieval of animation movies: a study,” in Pro-
ceedings of the International Workshop on Content-Based Mul-
timedia Indexing (CBMI ’07), pp. 295–302, Talence, France,
June 2007.
[4] M. Flickner, H. Sawhney, W. Niblack, et al., “Query by image
and video content: the QBIC system,” Computer,vol.28,no.9,
pp. 23–32, 1995.
10 EURASIP Journal on Image and Video Processing
[5] A. Pentland, R. W. Picard, and S. Sclaroff, “Photobook:
content-based manipulation of image databases,” Interna-
tional Journal of Computer Vision, vol. 18, no. 3, pp. 233–254,
1996.
[6] J. R. Smith and S F. Chang, “VisualSEEk: a fully automated
content-based image query system,” in Proceedings of the 4th
ACM International Conference on Multimedia (MULTIME-
DIA ’96), pp. 87–98, Boston, Mass, USA, November 1996.
[7] Y. Rui, T. S. Huang, and S. Mehrotra, “Content-based image
retrieval with relevance feedback in MARS,” in Proceedings of
the International Conference on Image Processing (ICIP ’97),
vol. 2, pp. 815–818, Santa Barbara, Calif, USA, October 1997.
[8] B. E. Rogowitz, T. Frese, J. R. Smith, C. A. Bouman, and E. B.
Kalin, “Perceptual image similarity experiments,” in Human
Vision and Electronic Imaging III, vol. 3299 of Proceedings of
SPIE, pp. 576–590, San Jose, Calif, USA, January 1998.
[9] A. W. M. Smeulders, M. Worring, S. Santini, A. Gupta, and
R. Jain, “Content-based image retrieval at the end of the early
years,” IEEE Transactions on Pattern Analysis and Machine In-
telligence, vol. 22, no. 12, pp. 1349–1380, 2000.
[10] T. Wang, Y. Rui, and J G. Sun, “Constraint based region
matching for image retrieval,” International Journal of Com-
puter Vision, vol. 56, no. 1-2, pp. 37–45, 2004.
[11] K. Tieu and P. Viola, “Boosting image retrieval,” International
Journal of Computer Vision, vol. 56, no. 1-2, pp. 17–36, 2004.
[12] A. Mojsilovi
´
c, J. Hu, and E. Soljanin, “Extraction of percep-
tually important colors and similarity measurement for image
matching, retrieval, and analysis,” IEEE Transactions on Image
Processing, vol. 11, no. 11, pp. 1238–1248, 2002.
[13] J. Chen, T. N. Pappas, A. Mojsilovi
´
c,andB.E.Rogowitz,
“Adaptive perceptual color-texture image segmentation,” IEEE
Transactions on Image Processing, vol. 14, no. 10, pp. 1524–
1536, 2005.
[14] X. Huang, S. Zhang, G. Wang, and H. Wang, “A new image
retrieval method based on optimal color matching,” in Pro-
ceedings of the International Conference on Image Processing,
Computer Vision & Pattern Recognition (IPCV ’06), vol. 1, pp.
276–281, Las Vegas, Nev, USA, June 2006.
[15] G. Qiu and K M. Lam, “Frequency layered color indexing
for content-based image retrieval,” IEEE Transactions on Im-
age Processing, vol. 12, no. 1, pp. 102–113, 2003.
[16] Y. Rubner and C. Tomasi, Perceptual Metrics for Image
Database Navigation, Kluwer Academic Publishers, Norwell,
Mass, USA, 2001.
[17] A. Dorado and E. Izquierdo, “Fuzzy color signatures,” in Pro-
ceedings of the International Conference on Image Processing
(ICIP ’02), vol. 1, pp. 433–436, Rochester, NY, USA, September
2002.
[18] X. Wan and C C. Jay Kuo, “A new approach to image retrieval
with hierarchical color clustering,” IEEE Transactions on Cir-
cuits and Systems for Video Technology, vol. 8, no. 5, pp. 628–
643, 1998.
[19] W. K. Leow and R. Li, “The analysis and applications of
adaptive-binning color histograms,” Computer Vision and Im-
age Understanding, vol. 94, no. 1–3, pp. 67–91, 2004.
[20] C. Theoharatos, G. Economou, S. Fotopoulos, and N. A.
Laskaris, “Color-based image retrieval using vector quantiza-
tion and multivariate graph matching,” in Proceedings of the
IEEE International Conference on Image Processing (ICIP ’05),
vol. 1, pp. 537–540, Genova, Italy, September 2005.
[21] J. Sun, X. Zhang, J. Cui, and L. Zhou, “Image retrieval based on
color distribution entropy,”
Pattern Recognit i on Letters, vol. 27,
no. 10, pp. 1122–1126, 2006.
[22] J. Puzicha, T. Hofmann, and J. M. Buhmann, “Non-parametric
similarity measures for unsupervised texture segmentation
and image retrieval,” in Proceedings of the IEEE Computer So-
ciety Conference on Computer Vision and Pattern Recognition
(CVPR ’97), pp. 267–272, San Juan, Puerto Rico, June 1997.
[23]D.P.Huttenlocher,G.A.Klanderman,andW.J.Ruck-
lidge, “Comparing images using the Hausdorff distance,” IEEE
Transactions on Pattern Analysis and Machine Intelligence,
vol. 15, no. 9, pp. 850–863, 1993.
[24] M P. Dubuisson and A. K. Jain, “A modified Hausdorff dis-
tance for object matching,” in Proceedings of the 12th IAPR In-
ternational Conference on Pattern Recognition, Conference A:
Computer Vision & Image Processing (ICPR ’94), vol. 1, pp.
566–568, Jerusalem, Israel, October 1994.
[25] R. Azencott, F. Durbin, and J. Paumard, “Multiscale identifi-
cation of building in compressed large aerial scenes,” in Pro-
ceedings of 13th International Conference on Pattern Recogni-
tion (ICPR ’96), vol. 3, pp. 974–978, Vienna, Austria, August
1996.
[26] S. H. Kim and R H. Park, “A novel approach to video se-
quence matching using color and edge features with the mod-
ified Hausdorff distance,” in Proceedings of the International
Symposium on Circuits and Systems (ISCAS ’04), vol. 2, pp. 57–
60, Vancouver, Canada, May 2004.
[27] R.O.Duda,P.E.Hart,andD.G.Stork,Pattern Classification,
John Wiley & Sons, New York, NY, USA, 2001.
[28] D G. Sim, O K. Kwon, and R H. Park, “Object matching
algorithms using robust Hausdorff distance measures,” IEEE
Transactions on Image Processing, vol. 8, no. 3, pp. 425–429,
1999.
[29] K. N. Plataniotis and A. N. Venetsanopoulos, Color Image Pro-
cessing and Applications, Springer, New York, NY, USA, 2000.
[30] M. Melgosa, “Testing CIELAB-based color-difference formu-
las,” Color Research & Application, vol. 25, no. 1, pp. 49–55,
2000.
[31] F. H. Imai, N. Tsumura, and Y. Miyake, “Perceptual color dif-
ference metric for complex images based on Mahalanobis dis-
tance,” Journal of Electronic Imaging, vol. 10, no. 2, pp. 385–
393, 2001.
[32] V. Gouet and N. Boujemaa, “About optimal use of color points
of interest for content-based image retrieval,” Research Report
RR-4439, INRIA Rocquencourt, Paris, France, April 2002.
[33] A. Del Bimbo, Visual Information Retrieval,MorganKauf-
mann, San Francisco, Calif, USA, 1999.
[34] M. J. Swain and D. H. Ballard, “Color indexing,” International
Journal of Computer Vision, vol. 7, no. 1, pp. 11–32, 1991.
[35] J. Hafner, H. S. Sawhney, W. Equitz, M. Flickner, and W.
Niblack, “Efficient color histogram indexing for quadratic
form distance functions,” IEEE Transactions on Pattern Anal-
ysis and Machine Intelligence, vol. 17, no. 7, pp. 729–736, 1995.
[36] J. Puzicha, J. M. Buhmann, Y. Rubner, and C. Tomasi, “Em-
pirical evaluation of dissimilarity measures for color and tex-
ture,” in Proceedings of the 7th IEEE International Conference on
Computer Vision (ICCV ’99), vol. 2, pp. 1165–1172, Kerkyra,
Greece, September 1999.
[37] T. Song and R. Luo, “Testing color-difference formulae on
complex images using a CRT monitor,” in Proceedings of the
8th IS&T/SID Color Imaging Conference (IS&T ’00), pp. 44–
48, Scottsdale, Ariz, USA, November 2000.