Báo cáo hóa học: " Research Article Quantification and Standardized Description of Color Vision Deficiency Caused by Anomalous Trichromats—Part I: Simulation and " docx
Bạn đang xem bản rút gọn của tài liệu. Xem và tải ngay bản đầy đủ của tài liệu tại đây (842.85 KB, 9 trang )
Hindawi Publishing Corporation
EURASIP Journal on Image and Video Processing
Volume 2008, Article ID 487618, 9 pages
doi:10.1155/2008/487618
Research Article
Quantification and Standardized Description of
Color Vision Deficiency Caused by Anomalous
Trichromats—Part I: Simulation and Measurement
Seungji Yang,
1
Yong Man Ro,
1
Edward K. Wong,
2
and Jin-Hak Lee
3
1
Image and Video Systems Lab, Information and Communications University, Munji 119, Yuseong, Daejeon 305-732, South Korea
2
Department of Ophthalmology, University of California at Irvine, Irvine, CA 92697-4375, USA
3
Department of Ophthalmology, Seoul National University Hospital, 28 Yongon-Dong, Chongno-Gu, Seoul 110-744, South Korea
Correspondence should be addressed to Yong Man Ro,
Received 8 October 2007; Revised 14 December 2007; Accepted 22 December 2007
Recommended by Alain Tremeau
The MPEG-21 Multimedia Framework allows visually impaired users to have an improved access to visual content by enabling
content adaptation techniques such as color compensation. However, one important issue is the method to create and interpret
the standardized CVD descriptions when making the use of generic color vision tests. In Part I of our study to tackle the issue,
we present a novel computerized hue test (CHT) to examine and quantify CVD, which allows reproducing and manipulating test
colors for the purposes of computer simulation and analysis of CVD. Both objective evaluation via color difference measurement
and subjective evaluation via clinical experiment showed that the CHT works well as a color vision test: it is highly correlated with
the Farnsworth-Munsell 100 Hue (FM100H) test and allows for a more elaborate and correct color reproduction than the FM100H
test.
Copyright © 2008 Seungji Yang et al. This is an open access article distributed under the Creative Commons Attribution License,
which permits unrestricted use, distribution, and reproduction in any medium, provided the original work is properly cited.
1. INTRODUCTION
Today, the use of color display in the multimedia-enabled
devices is very common. Portable multimedia devices even
allow real-time displays of high-quality color information.
As such, with the proliferation of color displays, it becomes
more important for ordinary people to perceive colors cor-
rectly. Color displays create no problems for normal people,
although color perception might be slightly different among
different people with a different normal color vision. Mean-
while, color displays do cause problems for people with color
vision deficiency (CVD). For these people, the use of rich col-
ors may lead to confusion. It may even result in misinterpret-
ing information that colors are carrying because people with
CVD may suffer from inability to discriminate among differ-
ent colors. The problem even gets worse in cases where color
is the only visual clue to recognize something important.
Up to 8% of the world’s male population exhibits a type
of CVD. More than 80% of them has one form of anoma-
lous trichromacy, which demonstrates a milder and variable
severity than those with dichromacy [1]. It is known that
there is no satisfactory cure for CVD and this condition is
lifelong. However, there has been a little consideration about
any assistance to people with CVD in color perception.
Recently, universal multimedia access (UMA) has be-
come an emerging trend in the world of multimedia commu-
nication. A UMA system adapts rich multimedia content to
various constraints imposed by users, devices, and networks,
providing the best possible multimedia experience to a par-
ticular user, anytime and anywhere. Meanwhile, the recently
developed MPEG-21 multimedia framework facilitates the
realization of UMA systems in an interoperable manner [2].
Among other tools that enable seamless access to multime-
dia, the MPEG-21 multimedia framework provides a norma-
tive description of CVD. In this way, visually impaired users
can have improved access to visual content through content
adaptation, more specifically by means of color compensa-
tion. In this context, the color compensation process can be
guided and optimized by the CVD description standardized
by the MPEG-21 [2, 3].
However, to suitably accommodate color compensa-
tion using the CVD description provided by the MPEG-21
2 EURASIP Journal on Image and Video Processing
multimedia framework, two important issues should be re-
solved. The first issue consists of matching CVD characteris-
tics to the MPEG-21 CVD description, while the second issue
consists of the design of a content adaptation scheme that is
harmonized with the MPEG-21 CVD description. In this pa-
per, in order to tackle these two issues, we present a compre-
hensive study that examines CVD through a computerized
color vision test (referred to as CHT), utilizes color compen-
sation techniques through anomalous cone modeling, and
quantifies color vision defects using a new computerized hue
test (CHT) with color compensation.
The major contribution of Part I of our study is the devel-
opment of a reproducible, computer-based color vision test,
called the CHT. The fundamental idea behind the CHT stems
from generic color arrangement tests such as the Farnsworth-
Munsell 100-Hue (referred to as FM100H) test. One ma-
jor difference is the fact that the CHT is a reproducible and
computer-based test, which allows easy manipulation of test
colors for the purposes of simulation and analysis of anoma-
lies in color vision. In Part I of our study, we have also com-
pared the efficiency of the CHT to the FM100H test. A com-
puter simulation is used to study the variation of color de-
fects according to the spectral cone shift. Finally, in Part II
of our study, we will discuss a color compensation scheme
for anomalous trichromats. This color compensation scheme
operates according to the deficiency degree standardized by
the MPEG-21 multimedia framework.
2. RELATED WORK: CONVENTIONAL COLOR
VISION TESTS
In order to examine anomalies in color vision, many clinical
color vision tests were developed several decades ago. In gen-
eral, two major test methodologies have been developed: one
is related to the colors reflected from a colored object, while
the other is related to the colors emitted from a solid light
source. The tests using reflected light are subdivided into two
types: one type is the pseudoisochromatic plate tests such as
the Ishihara test [4, 5] and the Hardy-Rand-Rittler (HRR)
test [6], while the other type is the color arrangement testing
such as the Farnsworth Panel D-15 test and the FM100H test
[7–9]. The test using emitted colors includes several types of
anomaloscopes developed by Jyrki [10].
Among all of the tests, the FM100H test is known to be
one of the most accurate tests showing high sensitivity to find
color defects at an early stage and to determine the degrees
of severity. The FM100H test has the subject place 85 differ-
ent color caps in a specific order. The color caps are divided
into four groups, each of which comprises 22, 21, 21, and 21
color caps, respectively. The type of CVD and its severity de-
gree are determined by the location of the caps after testing.
This would demonstrate the confusion of the subject’s color
perception and the total error score of the caps arranged by
the subject according to the hue [11, 12].
However, it takes a long time to perform the FM100H
test. An analysis of the results is difficult when testing a large
number of subjects. In addition, lighting conditions can af-
fect the test results unless these conditions are carefully con-
trolled to give a fixed and stable radiation. The color caps can
be discolored or changed due to contamination over time.
Due to these problems, although the FM100H test is known
to be the most accurate clinical test, it has been less com-
monly used than many other tests.
Several studies have been done to simplify the analysis
of the results of the FM100H test [6, 11, 13]. In this study,
we present an alternative approach by considering a comput-
erized color vision test. Color vision testing using the com-
puter has a number of important advantages. In using the
computer and monitor after calibration, any color can be eas-
ilyreproducedaswellaschangedforspecificpurposes.The
test and resulting data can be easily managed, analyzed, and
shared. Modifications and improvements of the test method
are also possible if necessary.
3. COMPUTERIZED HUE TEST FOR COLOR
VISION DEFICIENCY
3.1. Color vision deficiency
A significant number of studies have been conducted to
understand human color perception and cone fundamen-
tals [14–20]. Normal color vision has three cones whose
peak sensitivities lie in the long-wavelength (L), middle-
wavelength (M), and short-wavelength (S) bands of the vis-
ible spectrum [1, 19]. Meanwhile, CVD arises from two
causes: (1) complete lack of a cone pigment or (2) alteration
of one of the three cone pigments. The former is known as
dichromacy, and the latter is known as anomalous trichro-
macy. There is an extreme case, called achromatopsia, where
no cone is present in the eyes. Anomalous trichromacy is
known to have various causes [1].Themostfrequentone
is the shifting of cone spectral sensitivity from the normal
position [1, 15, 17, 21]. Anomalous trichromats have three
classes of cone pigments, but the peak sensitivity wavelengths
of two of these classes lie closer together. Depending on
the type of shifted cone, anomalous trichromacy is divided
into protanomalous (having a shifted L cone), deuteranoma-
lous (having a shifted M cone), and tritanomalous (having a
shifted S cone) trichromacy. The protanomalous and deuter-
anomalous trichromats are X-chromosome-linked, genetic,
anomalous trichromats, while the tritanomalous trichromats
aremostlyacquired.Duetoabnormalconecharacteristics,
people with CVD may have great difficulty with color dis-
crimination.
3.2. Implementation of the computerized hue test
The CHT is a kind of color arrangement test. It is designed
to display several color caps with different colors on a black
background on the monitor. The subject arranges the ran-
domized color caps in order of hue. Thereby, the color stim-
ulus arrays of the CHT resemble those of the conventional
FM100H test. They consist of 85 color caps that are ranked
according to the perceptual difference between adjacent col-
ors.
In order to ensure uniform color differences in visual per-
ception, the HSV (hue-saturation-value) color space is em-
ployed. The HSV space allows dividing a stimulus into two
Seungji Yang et al. 3
chromatic components of H (hue) and S (saturation), and
one achromatic component, that is luminance, of V (value).
The S and V parameter values have the range of 0 to 1, and
the H parameter has the range of 0
◦
to 360
◦
.
In the CHT, only the hue value is variable while lumi-
nance and saturation values are fixed [15–18]. The satura-
tion of the color caps is 0.24, the value of the color caps is
0.58, and the luminance of the background is 0 (zero). The
angular size of a color cap is 1
◦
, where color caps on the mon-
itor are displayed at 60 cm (normal arms length) away from
the subject’s eye. This is analogous to that of the FM100H
test. The difference of the hue values of any two adjacent col-
ors is the same for all color caps. To facilitate the subject’s
concentration on testing, the whole test procedure is divided
into four short steps: 22 color caps with hue values from 0
◦
to 90
◦
in the first step, 21 color caps with hue values from
90
◦
to 180
◦
in the second step, 21 color caps with hue values
from 180
◦
to 270
◦
in the third step, and 21 color caps with
hue values from 270
◦
to 360
◦
in the fourth step.
The CHT is performed on a computer display monitor.
As such, color vision testing through a display device is de-
pendent on visual characteristics of individuals as well as
spectral characteristics of the display device. Different dis-
play devices often produce different characteristics of the
same color. Thus, an important requirement for computer-
ized color vision testing is that the test monitor should be
calibrated before each test. The CHT must be performed on
a calibrated monitor device.
The severity degree of color deficiency is quantitatively
measured by using the total error score (TES), which is anal-
ogous to conventional FM100H testing. The TES is a mea-
sure of the accuracy of a subject in arranging the color caps
to form a gradual transition in hue between the two anchor
caps. A high number of misplacements result in a large TES
[1].
3.3. Anomalous color vision simulation on
the computerized hue test
A monitor device has its own spectral characteristics. The
color that one perceives is different according to the spec-
tral characteristics of the monitor. In this section, we simu-
late colors emitted from the monitor especially in the anoma-
lous trichromacy point of view. The computer simulation of
dichromacy color perception was developed by Brettel et al.
[22], Vienot and Brettel [23], and Rigden [24]. However,
there has been no literature about the simulation of anoma-
lous color perception. In this paper, we develop the computer
simulation of the anomalous color spectra. Furthermore, the
simulation of anomalous color spectra is utilized to develop
the color compensation method.
Given the CHT, we expect that anomalous trichromats
will produce a lower score than do normal trichromats. To
objectively measure the visual difference among caps of the
CHT, anomalous color vision is visualized on the CHT by
projecting stimuli of all the color caps into the visual per-
ception of anomalous trichromacy. This process is referred
to as simulation. In order to do so, let us first define c
i
to
be the ith color cap of the CHT. This can also be written as
c
i
={h
i
, s
i
, v
i
}. Then, a set of the 85 color caps, denoted as C,
can be written as follows:
C
=
c
1
, c
2
, c
3
, , c
85
,(1)
where the hue difference between any adjacent two color caps
is approximately 4
◦
(= 360
◦
/85), and where saturation and
luminance values are the same for all color caps.
Then, each color cap in the HSV color space is converted
to a corresponding cap in the RGB color space. The color cap
in the RGB space is written as follows:
c
i
=
r
i
, g
i
, b
i
=
h
i
, s
i
, v
i
. (2)
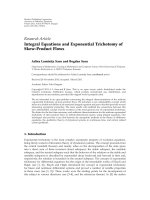
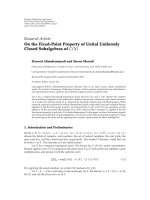
Given a color cap in the RGB space, the simulation is
performed as shown in Figure 1. First, the original color in
the RGB space is projected into color in the anomalous LMS
space that presents a color stimulus on the space of L, M,and
S cones. This can be done by using an anomalous color trans-
formation matrix, called T
anomalous
that can be specified to
T
protan
and T
deutan
for protanomalous and deuteranomalous,
respectively. Next, the color in the anomalous LMS space is
converted back to any defective color in the RGB color space
by using a normal color transformation matrix called T
normal
.
The resulting color shows how the original color is perceived
by a particular anomalous trichromat.
In order to calculate T
normal
, the spectral sensitivity of
normal L, M,andS cones regarding color emitted from RGB
phosphors in a color monitor can be defined as
L
normal
R
= k
L
E
R
(λ)L(λ)dλ,
L
normal
G
= k
L
E
G
(λ)L(λ)dλ,
L
normal
B
= k
L
E
B
(λ)L(λ)dλ,
M
normal
R
= k
M
E
R
(λ)M(λ)dλ,
M
normal
G
= k
M
E
G
(λ)M(λ)dλ,
M
normal
B
= k
M
E
B
(λ)M(λ)dλ ,
S
normal
R
= k
S
E
R
(λ)S(λ)dλ,
S
normal
G
= k
S
E
G
(λ)S(λ)dλ,
S
normal
B
= k
S
E
B
(λ)S(λ)dλ ,
(3)
where E
R
(λ), E
G
(λ), and E
B
(λ)areR, G,andB primary emis-
sion functions of the color monitor device, respectively, and
L(λ), M(λ), and S(λ)arespectralL, M,andS cone response
functions of the normal subject, respectively. The color mon-
itor is assumed to be calibrated, thus having ideal emission
functions so that the neutral point of the LMS cone response
is purely white. Then, we can compute the k of the param-
eters such that the following condition is satisfied:
L =
M =
S = 1[25].
The T
normal
means the spectral response of normal LMS
cones about RGB colors. So the values from (3)compriseco-
4 EURASIP Journal on Image and Video Processing
Original color in
RGB space
RGB to LMS conversion
Defective color
in LMS space
LMS to RGB conversion
Simulated color
in RGB space
T
anomalous
[T
normal
]
−1
Figure 1: Procedure of anomalous color perception.
efficients for T
normal
as follows:
T
normal
=
⎡
⎢
⎣
L
normal
R
L
normal
G
L
normal
B
M
normal
R
M
normal
G
M
normal
B
S
normal
R
S
normal
G
S
normal
B
⎤
⎥
⎦
. (4)
By using the matrix T
normal
, the RGB value of the ith color
cap displayed through the monitor can be transformed into
an LMS value as follows:
⎡
⎢
⎣
l
i
m
i
s
i
⎤
⎥
⎦
=
T
normal
·
⎡
⎢
⎣
r
i
g
i
b
i
⎤
⎥
⎦
=
⎡
⎢
⎣
L
normal
R
L
normal
G
L
normal
B
M
normal
R
M
normal
G
M
normal
B
S
normal
R
S
normal
G
S
normal
B
⎤
⎥
⎦
·
⎡
⎢
⎣
r
i
g
i
b
i
⎤
⎥
⎦
.
(5)
Since protanomaly is characterized by an anomalous L
cone, its spectral cone sensitivity should be affected by the
shift amount of the protanomalous L cone. Thus, the spectral
cone response of a protanomalous L cone can be obtained by
L
protan
R
(Δλ) = k
L
E
R
(λ)L
(λ, Δλ)dλ,
L
protan
G
(Δλ) = k
L
E
G
(λ)L
(λ, Δλ)dλ,
L
protan
B
(Δλ) = k
L
E
B
(λ)L
(λ, Δλ)dλ ,
(6)
where L
(λ, Δλ) is a protanomalous L cone shifted by Δλ
from the normal position.
As ever, deuteranomalous spectral cone sensitivity should
be affected by the shift amount of the deuteranomalous M
cone. Therefore, the spectral cone response of a deutera-
nomalous M cone can be obtained by
M
deutan
R
(Δλ) = k
M
E
R
(λ)M
(λ, Δλ)dλ,
M
deutan
G
(Δλ) = k
M
E
G
(λ)M
(λ, Δλ)dλ,
M
deutan
B
(Δλ) = k
M
E
B
(λ)M
(λ, Δλ)dλ ,
(7)
where M
(λ, Δλ) is a deuteranomalous M cone shifted by Δλ
from the normal position.
Given the protanomalous L cone sensitivity, the conver-
sion matrix (T
protan
) for the protanomaly that shows the LMS
cone response of RGB colors can be defined as
T
protan
(Δλ) =
⎡
⎢
⎣
L
protan
R
(Δλ) L
protan
G
(Δλ) L
protan
B
(Δλ)
M
normal
R
M
normal
G
M
normal
B
S
normal
R
S
normal
G
S
normal
B
⎤
⎥
⎦
. (8)
Similarly, given the deuteranomalous M cone sensitivity,
the conversion matrix (T
deutan
) for the deuteranomaly can be
defined as
T
deutan
(Δλ) =
⎡
⎢
⎣
L
normal
R
L
normal
G
L
normal
B
M
deutan
R
(Δλ) M
deutan
G
(Δλ) M
deutan
B
(Δλ)
S
normal
R
S
normal
G
S
normal
B
⎤
⎥
⎦
.
(9)
By using the T
protan
, the RGB value of the ith color cap is
transformed to the protanomalous LMS value, referred to as
c
protan
i
={l
protan
i
, m
i
, s
i
}, as follows:
⎡
⎢
⎣
l
protan
i
m
i
s
i
⎤
⎥
⎦
=
T
protan
(Δλ)·
⎡
⎢
⎣
r
i
g
i
b
i
⎤
⎥
⎦
=
⎡
⎢
⎣
L
protan
R
(Δλ) L
protan
G
(Δλ) L
protan
B
(Δλ)
M
normal
R
M
normal
G
M
normal
B
S
normal
R
S
normal
G
S
normal
B
⎤
⎥
⎦
·
⎡
⎢
⎣
r
i
g
i
b
i
⎤
⎥
⎦
.
(10)
By using the T
deutan
, the RGB value of the ith color cap is
transformed to the deuteranomalous LMS value, referred to
as c
deutan
i
={l
i
, m
deutan
i
, s
i
}, as follows:
⎡
⎢
⎣
l
i
m
deutan
i
s
i
⎤
⎥
⎦
=
T
deutan
(Δλ)·
⎡
⎢
⎣
r
i
g
i
b
i
⎤
⎥
⎦
=
⎡
⎢
⎣
L
normal
R
L
normal
G
L
normal
B
M
deutan
R
(Δλ) M
deutan
G
(Δλ) M
deutan
B
(Δλ)
S
normal
R
S
normal
G
S
normal
B
⎤
⎥
⎦
·
⎡
⎢
⎣
r
i
g
i
b
i
⎤
⎥
⎦
.
(11)
Consequently, c
protan
i
={r
protan
i
, g
protan
i
, b
protan
i
}, the color
perceived by the protanomalous, can be simulated as follows:
⎡
⎢
⎣
r
protan
i
g
protan
i
b
protan
i
⎤
⎥
⎦
=
⎡
⎢
⎣
L
normal
R
L
normal
G
L
normal
B
M
normal
R
M
normal
G
M
normal
B
S
normal
R
S
normal
G
S
normal
B
⎤
⎥
⎦
−1
·
⎡
⎢
⎣
l
protan
i
m
i
s
i
⎤
⎥
⎦
,
(12)
Seungji Yang et al. 5
where the protanomalous LMS value, c
protan
i
={l
protan
i
,
m
i
, s
i
}, is converted into any defective color in the RGB color
space by using the inverse conversion matrix [T
normal
]
−1
.
Consequently, c
deutan
i
={r
deutan
i
, g
deutan
i
, b
deutan
i
}, the color
perceived by the deuteranomalous, can be simulated as fol-
lows:
⎡
⎢
⎣
r
deutan
i
g
deutan
i
b
deutan
i
⎤
⎥
⎦
=
⎡
⎢
⎣
L
normal
R
L
normal
G
L
normal
B
M
normal
R
M
normal
G
M
normal
B
S
normal
R
S
normal
G
S
normal
B
⎤
⎥
⎦
−1
·
⎡
⎢
⎣
l
i
m
deutan
i
s
i
⎤
⎥
⎦
,
(13)
where the deuteranomalous LMS value, c
deutan
i
=
{
l
i
, m
deutan
i
, s
i
}, is converted into any defective color in
the RGB color space by using the inverse conversion matrix
[T
normal
]
−1
.
4. EXPERIMENT
For the experiments, colors for the test were produced on a
personal computer equipped with a Matrox G550 graphics
card with a fixed resolution of 1024
× 768 pixels and a fixed
color depth of 24 bits of true colors. The test monitor (Sam-
sung SyncMaster 950 series) has a screen refresh rate of 75
times per second. Its color temperature was approximately
set to a value of 9000
∼9700 K, which is equivalent to day-
light color. The monitor was also adjusted to 90% of contrast
and 80% of brightness in a dark room.
The experiment is composed of two parts: one is the mea-
sure of color defects by simulation of colors on the CHT in
view of anomalous trichromacy, and the other is the mea-
sure of color defects by clinical testing on the CHT on the
subject. From the simulation, we projected to observe defects
on color discrimination according to the shift amount of the
abnormal cones.
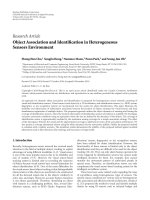
4.1. Objective measure of CVD by simulation
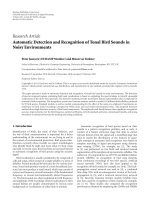
A computer simulation has been performed with 85 color
caps in the CHT. Figure 2 illustrates the result of the simula-
tion. Figure 2(a) depicts the gamut of color caps simulated
for the protanomalous subject. The protanomalous gamut
becomes much smaller than in the normal subject. It means
that anomalous trichromats with a severe deficiency degree
have a smaller color gamut that causes defective color per-
ception. Likewise, Figure 2(b) depicts the gamut of color caps
simulated from the view of deuteranomalous subjects. Sim-
ilar to the protanomalous case, the deuteranomalous gamut
becomes much smaller than in the normal subject as well.
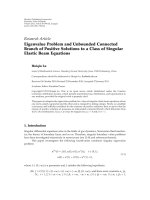
To verify the color confusion line that arises from anoma-
lous trichromacy, we simulate the hue values of 85 caps in
the CHT. Figure 3 shows the hue simulation of anomalous
trichromacy for the 85 color caps in the CHT. The hue val-
ues are normalized from 0.0 to 1.0. The main confusion lines
of the protanomalous subject are approximately 0.1882 and
0.7414, while the main confusion lines of the deuteranoma-
lous subject are approximately 0.1647 and 0.6705. From the
simulation results, we see that the colors around the two con-
fusion lines, which would be assumed to be perceived by
the subjects who have an anomalous trichromacy, have lit-
tle variation in hue. This means that the subjects who have
an anomalous trichromacy have suffered from differentiat-
ing among colors near the confusion lines. It should also
be noted that the confusion lines are broader as the shift
amount of the abnormal cone increases, meaning that big-
ger shift amount of the abnormal cone leads to more confu-
sion among colors around the confusion lines. These results
demonstrate that computer simulation would work well.
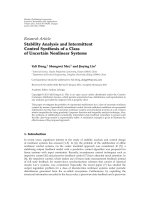
We also measured the difference of colors between the
normal cap and its simulated cap with various deficiency de-
grees. The color difference is an objective measure of dif-
ference between two colors in human color perception. The
measured color difference represents defective color percep-
tion of the subjects who have an anomalous trichromacy.
Based on the color differences, we can expect how an anoma-
lous trichromat would suffer from differentiating between
two colors. In order to measure the color difference in de-
ficiency degree, the spectral shift of abnormal cones, which
are known to have a value from 2 to 20 nm [1], has been ap-
plied. We use a popular color difference metric, the 1976 CIE
L
∗
a
∗
b
∗
color difference, where the nonlinear relationship for
L
∗
, a
∗
,andb
∗
is intended to mimic the logarithmic response
of the human eye. In order to accommodate the color dif-
ference to different spectral cone shifts, the color difference
metric has been changed for the protanomalous cone shift
(Δλ) to the following:
D
protan
i
(Δλ)
=
L
∗
i
−L
∗protan
i
(Δλ)
2
+
a
∗
i
−a
∗protan
i
(Δλ)
2
+
b
∗
i
−b
∗protan
i
(Δλ)
2
,
(14)
where
{L
∗
i
, g
∗
i
, b
∗
i
} is a L
∗
a
∗
b
∗
value of the ith color
cap that is the same as
{r
i
, g
i
, b
i
} in the RGB space,
and
{L
∗protan
i
, a
∗protan
i
, b
∗protan
i
} is a simulated L
∗
a
∗
b
∗
value for anomalous trichromacy, which is the same as
{r
protan
i
, g
protan
i
, b
protan
i
} in the RGB space.
Similarly, the color difference for deuteranomalous cone
shift (Δλ)ismeasuredas
D
deutan
i
(Δλ)
=
L
∗
i
−L
∗deutan
i
(Δλ)
2
+
a
∗
i
−a
∗deutan
i
(Δλ)
2
+
b
∗
i
−b
∗deutan
i
(Δλ)
2
,
(15)
where
{L
∗deutan
i
, a
∗deutan
i
, b
∗deutan
i
} is a simulated L
∗
a
∗
b
∗
value for anomalous trichromacy, which is the same as
{r
deutan
i
, g
deutan
i
, b
deutan
i
} in the RGB space.
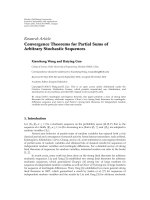
Figure 4 shows the average color difference between nor-
mal caps and associated simulated caps of the CHT. It was
observed that the smaller the ability of a subject to differenti-
ate between two colors, the higher the color difference existed
between the stimulations. The color difference is linearly
proportional to the spectral cone shift in both protanoma-
lous and deuteranomalous cases. This basically means, as ex-
pected, that the higher the spectral cone shift, the smaller the
ability of a subject to differentiate among colors.
6 EURASIP Journal on Image and Video Processing
0.25 0.27 0.29 0.31 0.33 0.35
0.37
x
= X/(X + Y + Z)
Original color cap in the CHT
Simulated color cap for protan (2 nm shifted)
Simulated color cap for protan (18nm shifted)
0.25
0.27
0.29
0.31
0.33
0.35
0.37
0.39
y = Y/(X + Y + Z)
(a) Gamut for protan
0.25 0.27 0.29 0.31 0.33 0.35
0.37
x
= X/(X + Y + Z)
Original color cap in the CHT
Simulated color cap for deutan (2nm shifted)
Simulated color cap for deutan (18 nm shifted)
0.25
0.27
0.29
0.31
0.33
0.35
0.37
0.39
y = Y/(X + Y + Z)
(b) Gamut for deutan
Figure 2: Gamut of 85 color caps of the CHT. (Note that the dots show the cap color position in x-y color space.)
00.10.20.30.40.50.60.70.80.91
Hue
Confusion line
(0.1882)
Confusion line
(0.7417)
0
0.1
0.2
0.3
0.4
0.5
0.6
0.7
0.8
0.9
1
Simulated hue for protan
2nm
4nm
6nm
8nm
10 nm
12 nm
14 nm
16 nm
18 nm
Normal
Confusing region
Confusing region
(a) Simulated hue for protan
00.10.20.30.40.50.60.70.80.91
Hue
Confusion line
(0.1647)
Confusion line
(0.6705)
0
0.1
0.2
0.3
0.4
0.5
0.6
0.7
0.8
0.9
1
Simulated hue for deutan
2nm
4nm
6nm
8nm
10 nm
12 nm
14 nm
16 nm
18 nm
Normal
Confusing region
Confusing region
(b) Simulated hue for deutan
Figure 3: Simulated hue of anomalous trichromacy versus normal hue value for the 85 color caps in the CHT.
4.2. Subjective measure of CVD by clinical testing
In the clinical experiment on the CHT, the subject selects
color caps displayed on the monitor screen and puts them
in order according to hue. Given a set of ordered color caps
by a subject, the TES is computed. The test time is limited to
2 minutes per test to obtain consistency in test results for all
subjects. The subjects perform the test 60 cm (normal arms
length) away from the monitor screen. Exclusion factors [26]
that may affect color vision include the following: subjects
who have central nervous system diseases, those who take
medicines that may affect vision, those who have any or-
ganic ophthalmologic diseases that may influence color vi-
sion, those who are under 10 years of age, and those who
cannot cooperate well in doing the test. The corrected Snellen
visual acuities of the subjects measured better than 20/25. In
all tests, the subjects were informed about the test procedure
from a tester, and then they twice performed the FM100H
test and CHT, repeating the original test one week later. Af-
ter the TES of each test was obtained, the average accord-
ing to each test method was calculated and the difference was
evaluated. The reproducibility of the color vision test was de-
termined by the coefficient of variation of the test, and the
correlation between the two tests was acquired through the
Spearman regression analysis.
The total number of subjects was 130 (43 men and 87
women), having an average age of 34 years (14–67 years of
age). Among those subjects, 89 subjects were determined to
be normal and 41 subjects were determined to be abnormal
with the HRR test, the FM100H test, and the CHT.
Seungji Yang et al. 7
18161412108642
Spectral cone shift of abnormal cone (nm)
0
5
10
15
20
25
30
Color difference
(a) Color difference for protan
18161412108642
Spectral cone shift of abnormal cone (nm)
0
5
10
15
20
25
30
Color difference
(b) Color difference for deutan
Figure 4: Color difference between normal trichromats and anomalous trichromats for the color caps in the CHT.
Table 1: The total error scores obtained with the CHT and FM100H test in normal subjects.
Age range (y) Mean age (y)No.ofsubjects
Total error score (mean
± std.)
P value
CHT FM100H
10–19 16 28 17.3 ±08.634.4 ±24.6 <.05
20–29 24 10 17.9
±14.745.2 ±21.1 <.05
30–39 32 6 28.4
±13.446.1 ±20.2 <.05
40–49 46 14 30.1
±12.652.4 ±19.2 <.05
50–59 57 19 31.0
±13.367.4 ±18.6 <.05
60–69 63 12 34.8
±29.269.2 ±32.5 <.05
In comparing the test reproducibility through the co-
efficient of variation, the CHT had a much higher repro-
ducibility than the existing FM100H test. The TES of the
normal subjects was relatively lower in the CHT that mea-
sured 31.5
± 12.3 than in the FM100H test that measured
43.6
± 16.2. In the subjects who have a CVD, the TES was
higher in the CHT that measured 169.8
± 40.2 than in the
FM100H test that measured 157.3
± 41.9. As seen in the
above results, the CHT is more sensitive than the FM100H
test since the CHT is performed on the monitor device that
provides better color reproduction compared to the offline
FM100H test. Furthermore, the coefficients of variation aver-
aged 21.2% in the FM100H test and 9.1% in the CHT. These
results mean that the CHT would be superior to the conven-
tional FM100H test. However, the two tests showed a high
correlation with a Pearson correlation coefficient of 0.965,
meaning that the CHT would follow the basic principle of
the conventional FM100H test. From the statistical analysis
using the t test, the TES of the CHT also demonstrated a
statistically significant increase when comparing subjects by
age. The t test results showed a high confidence about the al-
ternative hypothesis such as t value
= 4.95, degree of freedom
= 83, and P value = .001 that denotes the probability of ob-
taining a result at least as extreme as a given data point under
the null hypothesis. The results of the TES of the CHT and
the FM100H test in the color defective eyes of each age level
are shown in Table 1. Both tests showed almost no statisti-
cal difference in all age groups, where the P value < .05, but
rather showed a high correlation (Pearson correlation anal-
ysis: r
= 0.856, Table 1). From the results, we see that the
TES is significantly higher for the CHT than for the FM100T
test. This is because the CHT would give more accurate and
correct color reproduction than would the FM100H test.
The CHT has been also compared to a pseudoisochro-
matic plate test, the HRR test. The HRR test demonstrated 18
protan defectives showing a mild degree in 2, a medium de-
gree in 7, and a severe degree in 9; 19 deutan defectives show-
ing a medium degree in 4 and a severe degree in 15; 5 were
unclassified subjects. The FM100H test showed 17 protan
defectives, 21 deutan defectives, and 3 unclassified subjects,
while the CHT showed 18 protan defectives, 19 deutan de-
fectives, and 5 unclassified color defectives. As the severity of
degrees in the HRR test was increased, the TES was increased
in both the FM100H test and the CHT (Table 2).
The confusion lines used to determine the type of CVD
have also been compared for the CHT and FM100H test.
Generally, two confusion lines would be expected for a CVD
[8]. Each line is represented by the range of confusing caps
and their center. The primarily confusing caps for protan de-
fectives ranged from the 22nd to 33rd caps at the center of
the 26th cap and from the 64th to 72nd caps at the center of
the 70th cap in the CHT, while they were ranged from the
15th to 16th caps at the center of the 17th cap and from the
58th to 68th caps at the center of the 64th cap in the FM100H
test. And the primarily confusing caps for deutan defectives
ranged from the 15th to 24th caps at the center of the 16th
cap and from the 58th to 64th caps at the center of the 70
caps, while they ranged from the 12nd to 17th caps at the
center of the 15th cap and from the 53th to 60th caps at the
center of the 58th cap in the FM100H test. That is, the CHT
8 EURASIP Journal on Image and Video Processing
Table 2: The total error scores obtained with the CHT and FM100H test in three groups of subjects with color defects based on the HRR
test.
Type of color defect Total error score (mean ± std. dev.)
P value
(HRR test) CHT FM100H
Mild 145.0 ±59.591.0 ±23.6 <.05
Moderate 153.6
±46.3 115.0 ±15.6 <.05
Severe 171.8
±50.3 123.3 ±23.3 <.05
Table 3: Position of the central caps characterizing the axis of confusion for color defective subjects on the CHT and FM100H test.
Type of color defect
CHT FM100H
Central cap Range Central cap Range
Protan
26 22–33 15 15–16
70 64–72 64 58–68
Deutan
16 15–24 15 12–17
58 58–64 58 53–60
would tend to express a more yellow-green-purple axis (Ta-
ble 3).
To summarize, based on the outcome of these experi-
ments, we can conclude that the CHT would work well as
a color vision test by showing a high correlation with the
FM100H test and it gives more elaborate, correct color repro-
duction than the FM100H test. For further research, we will
look for crucial evidence that anomalous trichromats with
bigger cone shift will be more defective in their color discrim-
ination ability, particularly regarding a linear relationship.
5. CONCLUSIONS
In this paper, we have proposed a computerized color vision
test for CVD. The CHT is a reproducible computer-based
test that allows easy manipulation of test colors for the pur-
poses of simulation and analysis of anomalies in color vision.
The usefulness of the CHT was evaluated with both com-
puter simulation and clinical experiments. The CHT is sta-
tistically consistent for all age groups with the FM100H test.
A computer simulation was used to measure the variation of
color defects according to spectral cone shift. From our sim-
ulation results, we can conclude that the anomalous trichro-
mats are more defective in their color discrimination abil-
ity when the spectral cone shift is bigger. We could also see
that the color gamut of the anomalous trichromats becomes
smaller when the spectral cone shift increases. Another im-
portant conclusion through the simulation on the CHT is
that color vision would be linearly degraded according to de-
ficiency degree. Since the deficiency degree in the standard-
ized CVD description is linearly measured, this observation
is important for Part II of our study that aims at matching
the error scores of the CHT to the standardized CVD descrip-
tion. Given the evidence, we can conclude that the CHT pro-
vides a reliable and quantitative measure of color defects. In
Part II of the study, we discuss a color compensation scheme
for anomalous trichromats. This color compensation scheme
operates according to the deficiency degree standardized by
the MPEG-21 multimedia framework.
REFERENCES
[1] D. McIntyre, Color Blindness: Causes and Effects, Dalton Pub-
lishing, Chester, UK, 2002.
[2] A. Vetro and C. Timmerer, “Digital item adaptation: overview
of standardization and research activities,” IEEE Transactions
on Multimedia, vol. 7, no. 3, pp. 418–426, 2005.
[3]S.Yang,Y.M.Ro,J.Nam,J.Hong,S.Y.Choi,andJ H.
Lee, “Improving visual accessibility for color vision deficiency
based on MPEG-21,” ETRI Journal, vol. 26, no. 3, pp. 195–202,
2004.
[4]J.Birch,“Efficiency of the Ishihara test for identifying red-
green colour deficiency,” Ophthalmic and Physiological Optics,
vol. 17, no. 5, pp. 403–408, 1997.
[5] D. V. de Alwis and C. H. Kon, “A new way to use the Ishihara
test,” Journal of Neurology, vol. 239, no. 8, pp. 451–454, 1992.
[6] I.H.Hardy,G.R.Rand,andC.Rittler,“HRRpolychromatic
plates,” Journal of the Optical Societ y of America, vol. 44, no. 7,
pp. 509–523, 1954.
[7] V. C. Smith, J. Pokorny, and A. S. Pass, “Color-axis determina-
tion on the Farnsworth-Munsell 100-hue test,” American Jour-
nal of Ophthalmology, vol. 100, no. 1, pp. 176–182, 1985.
[8] G. Verriest, J. V. Laethem, and A. Uvijls, “A new assessment
of the normal ranges of the Farnsworth-Munsell 100-hue test
scores,” American Journal of Ophthalmology, vol. 93, no. 5, pp.
635–642, 1982.
[9] S. J. Dain and J. Birch, “An averaging method for the interpre-
tation of the Farnsworth-Munsell 100-Hue test—I. Congeni-
tal colour vision defects,” Ophthalmic and Physiological Optics,
vol. 7, no. 3, pp. 267–280, 1987.
[10] H. Jyrki, “A comparative study of several diagnostic tests of
color vision used for congenital red-green defects,” Acta oph-
thalmologica. Supplement, vol. 115, pp. 62–68, 1972.
[11] G. Verriest, J. Van Laethem, and A. Uvijls, “A new assessment
of the normal ranges of the Farnsworth-Munsell 100-hue test
scores,” American Journal of Ophthalmology, vol. 93, no. 5, pp.
635–642, 1982.
[12] H. Cooper and A. Bener, “Application of a LaserJet printer to
plot the Farnsworth-Munsell 100-hue color test,” Optometry
and Vision Science, vol. 67, no. 5, pp. 372–376, 1990.
[13] A. Linksz, “Color vision tests in clinical practice,” Transactions
of the American Academy of Ophthalmology and Otolaryngol-
ogy, vol. 75, no. 5, pp. 1078–1090, 1971.
Seungji Yang et al. 9
[14] V. C. Smith and J. Pokorny, “Spectral sensitivity of the foveal
cone pigments between 400 and 700 nm,” Vision Research,
vol. 15, no. 2, pp. 161–171, 1975.
[15] J. Pokorny and V. C. Smith, “Evaluation of single-pigment shift
model of anomalous trichromacy,” Journal of the Optical Soci-
ety of America A, vol. 67, no. 9, pp. 1196–1209, 1977.
[16] J. Pokorny, V. C. Smith, and I. Katz, “Derivation of the pho-
topigment absorption spectra in anomalous trichromat,” Jour-
nal of the Optical Society of America A, vol. 63, no. 2, pp. 232–
237, 1973.
[17]P.DeMarco,J.Pokorny,andV.C.Smith,“Full-spectrum
cone sensitivity functions for X-chromosome-linked anoma-
lous trichromats,” Journal of the Optical Society of America A,
vol. 9, no. 9, pp. 1465–1476, 1992.
[18] M. Neitz and J. Neitz, “Molecular genetics of color vision
and color vision defects,” Archives of Ophthalmology, vol. 118,
no. 5, pp. 691–700, 2000.
[19] A. Stockman and L. T. Sharpe, “The spectral sensitivities of
the middle- and long-wavelength-sensitive cones derived from
measurements in observers of known genotype,” Vision Re-
search, vol. 40, no. 13, pp. 1711–1737, 2000.
[20] L. T. Sharpe, A. Stockman, H. J
¨
agle, et al., “Red, green,
and red-green hybrid pigments in the human retina: corre-
lations between deduced protein sequences and psychophys-
ically measured spectral sensitivities,” The Journal of Neuro-
science, vol. 18, no. 23, pp. 10053–10069, 1998.
[21] G. Wyszecki and W. S. Stiles, Color Science: Concepts and Meth-
ods, Quantitative Data and Formulae, John Willey & Sons, New
York, NY, USA, 2000.
[22] H. Brettel, F. Vienot, and J. D. Mollon, “Computerized simula-
tion of color appearance for dichromats,” Journal of the Opt ical
Society of America A, vol. 14, no. 10, pp. 2647–2655, 1997.
[23] F. Vienot and H. Brettel, “Color display for dichromats,” in
Color Imaging: Device-Independent Color, Color Hardcopy, and
Graphic Arts VI, vol. 4300 of Proceedings of SPIE, pp. 199–207,
San Jose, Calif, USA, January 2000.
[24] C. Rigden, “The eye of the beholder designing for color-blind
users,” British Telecommunications Enginee ring, vol. 17, pp.
291–295, 1999.
[25] G. Kov
´
acs, I. Kucsera, G.
´
Abrah
´
am, and K. Wenzel, “Enhanc-
ing color representation for anomalous trichromats on CRT
monitors,” Color Research & Application,vol.26,no.1,sup-
plement, pp. 273–276, 2001.
[26] A. E. Krill and G. A. Fishman, “Acquired color vision defects,”
Transactions of the American Academy of Ophthalmology and
Otolaryngology, vol. 75, no. 5, pp. 1095–1111, 1971.