Báo cáo hóa học: " A Temperature Window for the Synthesis of Single-Walled Carbon Nanotubes by Catalytic Chemical Vapor Deposition of CH4 over Mo2-Fe10/MgO Catalyst" pptx
Bạn đang xem bản rút gọn của tài liệu. Xem và tải ngay bản đầy đủ của tài liệu tại đây (221.97 KB, 4 trang )
NANO EXPRESS
A Temperature Window for the Synthesis of Single-Walled
Carbon Nanotubes by Catalytic Chemical Vapor Deposition
of CH
4
over Mo
2
-Fe
10
/MgO Catalyst
Ouyang Yu Æ Li Daoyong Æ Cao Weiran Æ
Shi Shaohua Æ Chen Li
Received: 15 September 2007 / Accepted: 19 February 2009 / Published online: 4 March 2009
Ó to the authors 2009
Abstract A temperature window for the synthesis of
single-walled carbon nanotubes by catalytic chemical
vapor deposition of CH
4
over Mo
2
-Fe
10
/MgO catalyst has
been studied by Raman spectroscopy. The results showed
that when the temperature is lower than 750 °C, there were
few SWCNTs formed, and when the temperature is higher
than 950 °C, mass amorphous carbons were formed in the
SWCNTs bundles due to the self-decomposition of CH
4
.
The temperature window of SWCNTs efficient growth is
between 800 and 950 °C, and the optimum growth tem-
perature is about 900 °C. These results were supported by
transmission electron microscope images of samples
formed under different temperatures. The temperature
window is important for large-scale production of
SWCNTs by catalytic chemical vapor deposition method.
Keywords Single-walled carbon nanotubes Á
Catalytic chemical vapor deposition Á Raman spectroscopy
Introduction
Since single-walled carbon nanotubes (SWCNTs) were
discovered in 1993 [1], they have generated significant
research activities due to their particular microstructures,
unique properties and great potential applications in many
fields. A single-walled nanotube can be described as a
single layer of a graphite crystal that is rolled up into a
seamless cylinder, with both ends capped with hemispheres
made of hexagonal and pentagonal carbon rings. With
remarkable properties, SWCNTs can be explored to be
used in novel applications like pressure sensors, flow sen-
sors and hydrogen storage [2–6].
Because SWCNTs possess so many unique properties,
the synthesis of SWCNTs becomes a subject of a significant
global research effort. Up to now, a number of methods for
preparing SWCNTs have been reported, such as electric arc
discharge [7], laser ablation methods [8] and catalytic
chemical vapor deposition (CCVD) [9–13]. Among them,
the CCVD method is becoming a dominant way for scaling
up the production of SWCNTs at relatively low cost. In the
CCVD method, methane, acetylene, hexane, alcohol and
other hydrocarbons are used as carbon feedstock. The cat-
alysts are generally supported on AI
2
O
3
or MgO and consist
of Fe, Co, Mi, Mo or mixtures of those metals.
In the synthesis of SWCNTs by CCVD method, the
temperature plays a key role. In this paper, we report the
synthesis of SWCNTs by catalytic decomposition of
methane over Mo
2
-Fe
10
/MgO catalyst and give a temper-
ature window using Raman spectroscopy. With the
relatively intensity of D band to the G band (I
D
/I
G
) and the
transmission electron microscopy images of samples, we
obtain that the optimum synthetic temperature is about
900 ° C.
Experimental
A mixture of Mg(NO
3
)
2
Á6H
2
O, ammonium molybdate,
citric acid, H
2
O and Fe(NO
3
)
2
Á9H
2
O at a weight ratio of
10:0.07m:4:1:0.16n (m = 2, n = 10, marked with Mo
2
-
Fe
10
/MgO) was stirred for 6 h at 90 °C and dried at 150 °C
overnight, then ground into a fine powder. Finally, the
powder was calcined in air (air flow: 30 mL/min) for
30 min at 550 °C before used for SWCNTs growth.
O. Yu (&) Á L. Daoyong Á C. Weiran Á S. Shaohua Á C. Li
Lab for Nano-functional Materials, Lin Yi Normal University,
Shandong 276005, China
e-mail:
123
Nanoscale Res Lett (2009) 4:574–577
DOI 10.1007/s11671-009-9284-z
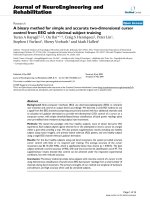
The growth of SWCNTs was carried out in a fluidized-
bed which is shown in Fig. 1. In a typical experiment, about
100 mg catalyst was put into the quartz tube. The temper-
ature was raised to the setting value in Ar atmosphere at a
flow rate of 200 mL/min before CH
4
was introduced into the
reactor at 60 mL/min for 30 min, then CH
4
was turned off
and the furnace was cooled to room temperature in an Ar
flow. The impurities were removed by concentrate HCI.
The Raman spectra were recorded by a Renishaw inVia
spectrophotometer at room temperature and in a back-
scattering geometry, with Ar laser at 514.5 nm.
Results and Discussion
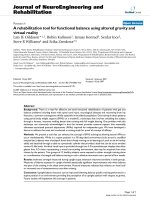
Figure 2 shows the Raman spectra for materials grown at
different growth temperature (a: 750 °C; b: 800 °C; c:
850 ° C; d: 900 °C; e: 950 °C). In Fig. 2a, only the G band
(tangential mode), D band (related to disordered graphite or
amorphous) and a shoulder at 1604 cm
-1
(the fundamental
E
2g
mode of graphite) are presented. In the lower wave-
number region (100–300 cm
-1
), the radial breath modes
(RBM) which represent the existence of SWCNTs are
hardly shown. The data show no SWCNTs are formed and
there are only poorly multi-walled carbon nanotubes
(MWCNTs) and organized carbon in the sample. The rel-
atively high intensity of the D band relative to G band
(I
D
/I
G
= 0.72) indicates mass amorphous carbon content or
more defect concentration in the MWCNTs.
When temperature increases to 800 °C, Raman spectrum
of the sample (Fig. 2b) shows several weak RBM bands in
the lower wavenumber region (100–300 cm
-1
). This
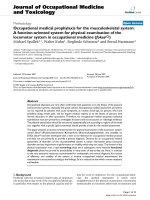
revealed that SWCNTs formed at 800 °C. From the TEM
image (Fig. 3a), we can observe that there are a few single
SWCNT and SWCNTs bundle with different diameters.
According to the equation x
RBM
= 6.5 ? 223.75/d
t
(cm
-1
)[14], the diameter of SWCNTs synthesized at
800 ° C varies from 0.86 to 1.73 nm, which accords with
the result of the TEM image (Fig. 3a). The intensity ratio,
I
D
/I
G
, is observed to decrease with increasing temperature
(at 800 °C, the I
D
/I
G
is 0.47).
Raman spectrum of the sample grown at 850 °C
(Fig. 2c) is typical for SWCNTs. In the lower wavenumber
region (100–300 cm
-1
), two outstanding RBM bands are
presented. According to the formula [14], the peaks at 147
and 169 cm
-1
correspond to the SWCNTs with diameter of
1.59 and 1.38 nm, respectively. The TEM image (Fig. 3b)
reveals that the product consists of single and bundle
SWCNTs with even diameters. The intensity ratio becomes
lower with I
D
/I
G
= 0.32 and the TEM shows that there are
only a few amorphous carbons in the SWCNTs bundle.
The RBM mode is observed as a strong band at
160 cm
-1
in the Raman spectrum at 900 °C (Fig. 2d). The
relatively lower intensity, I
D
/I
G
= 0.14, indicates a lower
amount of amorphous carbon content or a lower defect
concentration in the SWCNTs. This can be observed from
TEM image in Fig. 3c. As shown in Fig. 3c, the SWCNTs
in the bundle have even diameters and appear clean and
uncoated. It is well known that when the diameter distri-
bution of SWCNTs is more narrow, the application values
of SWCNTs are higher. At this growth temperature, only
one strong band at 160 cm
-1
in the Raman spectrum, this
shows the diameter distribution of SWCNTs is very nar-
row. All the results show high-quality SWCNTs have been
synthesized at 900 °C.
By increasing growth temperature to 950 °C, more
amorphous carbons are formed in the SWCNTs bundles
due to the self-decomposition of CH
4
. This is shown both
Fig. 1 Sketch map of the fluidized bed reactor
Fig. 2 Raman spectra from samples grown at the designated
temperature. (a) 750 °C, (b) 800 °C, (c) 850 °C, (d) 900 °C and
(e) 950 °C
Nanoscale Res Lett (2009) 4:574–577 575
123
in Raman spectra (Fig. 2e) and TEM images (Fig. 3d). The
spectra show the I
D
/I
G
increasing rapidly with increasing
growth temperature. The TEM images show that SWCNTs
are coated by more and more amorphous carbons, and
when the temperature increases to 950 °C, SWCNTs are
hardly observed.
In order to study the influence of growth temperature on
the purity of prepared tube samples, we give the curve
(Fig. 4) showing the dependence of I
D
/I
G
on the growth
temperature. From Fig. 4, two kinds of I
D
/I
G
distributions
can clearly be distinguished. From 750 to 900 °C, the I
D
/I
G
decreases with increasing growth temperature. When the
temperature is higher than 900 °C, the I
D
/I
G
increases with
growth temperature. In the former stage, SWCNTs are
formed gradually with increasing growth temperature and
the content of SWCNTs in the products increases. In the
latter stage, the high growth temperature causes CH
4
self-
decomposition. With increasing growth temperature, more
and more amorphous carbons are formed, and when the
growth temperature increases to 950 °C, only a few
SWCNTs are shown in the results and are coated by plenty
of amorphous carbons.
Conclusions
A temperature window of SWCNTs growth by catalytic
chemical vapor deposition of CH
4
over Mo-Fe/MgO cat-
alyst has been studied. The results suggest that when the
temperature is lower than 750 °C, only a few SWCNTs are
formed, and when the temperature is higher than 950 °C,
more and more amorphous carbons are formed in the
SWCNTs bundles due to the self-decomposition of CH
4
.
The temperature window of SWCNTs efficiently growth is
between 800 and 950 °C, and the optimum growth tem-
perature is about 900 °C.
Acknowledgement The authors thank the support of Natural Sci-
ence Foundation of Linyi, China.
Fig. 3 Transmission electron
microscope images of samples
formed under a 800 °C,
b 850 °C, c 900 °C and
d 950 °C
Fig. 4 Influence of growth temperature on the resulting intensity
ratio I
D
/I
G
576 Nanoscale Res Lett (2009) 4:574–577
123
References
1. S. Iijima, T. Tchihashi, Nature 363, 603 (1993). doi:10.1038/
363603a0
2. R.H. Baughman, C. Cui, A.A. Zakhidov et al., Science 284, 1340
(1999). doi:10.1126/science.284.5418.1340
3. Q. Zhou, J.R. Wood, H.D. Wagner, Appl. Phys. Lett. 78, 1748
(2001). doi:10.1063/1.1357209
4. P. Kra
´
l, M. Shapiro, Phys. Rev. Lett. 86, 131 (2001). doi:
10.1103/PhysRevLett.86.131
5. M. Kruger, M.R. Buitelaar, T. Nussbaumer et al., Appl. Phys.
Lett. 78, 1291 (2001). doi:10.1063/1.1350427
6. N. Rajalakshmi, K.S. Dhathathreyan, A. Govindaraj et al.,
Electrochim. Acta 45, 4511 (2000). doi:10.1016/S0013-4686
(00)00510-7
7. C. Journet, W.K. Master, P. Bernier et al., Nature 388, 756
(1997). doi:10.1038/41972
8. A. Thess, R. Lee, P. Nikolaev et al., Science 273, 483 (1996). doi:
10.1126/science.273.5274.483
9. L. Qingwen, Y. Hao, C. Yan et al., J. Mater. Chem. 12, 1179
(2002). doi:10.1039/b109763f
10. A.M. Cassell, J.A. Raymakers, J. Kong, H. Dai, J. Phys. Chem. B
103, 6484 (1999). doi:10.1021/jp990957s
11. J F. Colomer, C. Stephan, S. Lefrant, G. Van Tendeloo, I.Willems,
Z. Konya, A. Fonseca, C. Laurent, J.B. Nagy, Chem. Phys. Lett.
317, 83 (2000). doi:10.1016/S0009-2614(99)01338-X
12. J.H. Hafner, M.J. Bronikowski, B.R. Azamian, P. Nikolaev, A.G.
Rinzler, D.T. Colbert, K.A. Smith, R.E. Smalley, Chem. Phys.
Lett. 296, 195 (1998). doi:10.1016/S0009-2614(98)01024-0
13. G.L. Hornyak, L. Grigorian, A.C. Dillon, P.A. Parilla, K.M.
Jones, M.J. Heben, J. Phys. Chem. B 106, 2821 (2002). doi:
10.1021/jp015554i
14. S.C. Lyu, B.C. Liu, T.J. Lee, Z.Y. Liu, C.W. Yang, C.Y. Park,
C.J. Lee, Chem. Commun. 734 (2003)
Nanoscale Res Lett (2009) 4:574–577 577
123