Báo cáo hóa học: " Subcellular Localization of Thiol-Capped CdTe Quantum Dots in Living Cells" potx
Bạn đang xem bản rút gọn của tài liệu. Xem và tải ngay bản đầy đủ của tài liệu tại đây (518.89 KB, 7 trang )
NANO EXPRESS
Subcellular Localization of Thiol-Capped CdTe Quantum Dots
in Living Cells
Yu Zhang Æ Lan Mi Æ Rongling Xiong Æ Pei-Nan Wang Æ
Ji-Yao Chen Æ Wuli Yang Æ Changchun Wang Æ
Qian Peng
Received: 12 August 2008 / Accepted: 17 October 2008 / Published online: 5 April 2009
Ó to the authors 2009
Abstract Internalization and dynamic subcellular distri-
bution of thiol-capped CdTe quantum dots (QDs) in living
cells were studied by means of laser scanning confocal
microscopy. These unfunctionalized QDs were well inter-
nalized into human hepatocellular carcinoma and rat
basophilic leukemia cells in vitro. Co-localizations of QDs
with lysosomes and Golgi complexes were observed,
indicating that in addition to the well-known endosome-
lysosome endocytosis pathway, the Golgi complex is also a
main destination of the endocytosed QDs. The movement
of the endocytosed QDs toward the Golgi complex in the
perinuclear region of the cell was demonstrated.
Keywords Cells Á Confocal microscopy Á Imaging Á
Quantum dots Á Subcellular localization
Introduction
Water-soluble colloidal semiconductor quantum dots
(QDs) are a new class of fluorescent probes with excellent
optical properties. Researches have recently been focused
not only on their photoluminescence (PL) behaviors [1, 2],
but also on their biomedical applications of labeling of
cells, protein trafficking, DNA array technology, and
immunofluorescence assays [3–7]. Fluorescence labeling
and tracking of subcellular organelles and proteins are
considered as a powerful tool to reveal the mystery of
cellular activities. The sufficient brightness and photosta-
bility make QDs favorable for tracking intracellular events.
The first step for intracellular delivery of QDs is to cross
the cell membrane barrier [8–14]. It is reported that surface
functionalized QDs can effectively be internalized into
cells and ended up in endosomes/lysosomes [8, 9, 15].
Ruan et al. [14] have shown that the Tat peptide-conju-
gated QDs were initially trapped in vesicles and then
transported to the intracellular region corresponding to the
microtubule organizing center. Although water-soluble
QDs without surface bioconjugations were considered to be
difficult to enter into cells [15], the internalizations of
unfunctionalized QDs into living cells were reported [1, 2].
Recently, Nabiev et al. [16] observed that the unfunction-
alized QDs with a small size of 2.1 nm were actively
transported to the nucleus in macrophages, while QDs with
a size of 3.8 nm did not enter the nucleus.
Endocytosis is believed as the main mechanism of
intracellular delivery of QDs, but the endocytic process is
complicated with several possible pathways. Moreover, the
internalization process of a particle is a dynamic course
with various destinations [17–19]. So far, little is known
concerning the endocytic route of QDs in cells. The aim of
this study was to examine subcellular localization patterns
Electronic supplementary material The online version of this
article (doi:10.1007/s11671-009-9307-9) contains supplementary
material, which is available to authorized users.
Y. Zhang Á L. Mi Á R. Xiong Á P N. Wang (&)
Department of Optical Science and Engineering, Key Lab for
Advanced Photonic Materials and Devices, Fudan University,
Shanghai 200433, China
e-mail:
J Y. Chen (&)
Surface Physics Laboratory (National Key Lab) and Department
of Physics, Fudan University, Shanghai 200433, China
e-mail:
W. Yang Á C. Wang
Department of Macromolecular Science and Key Lab of
Molecular Engineering of Polymers, Fudan University,
Shanghai 200433, China
Q. Peng
Department of Pathology, The National Hospital-Norwegian
Radium Hospital, University of Oslo, Montebello, Oslo, Norway
123
Nanoscale Res Lett (2009) 4:606–612
DOI 10.1007/s11671-009-9307-9
of the thiol-capped CdTe QDs in living cells by means of
confocal microscopy. This report shows that QDs are
localized not only in lysosomes, but also in Golgi com-
plexes of the human hepatocellular carcinoma (QGY) and
rat basophilic leukemia (RBL) cell lines.
Experimental Details
The water-soluble thiol-capped CdTe QDs were prepared
via the modified hydrothermal route using the thiolglycolic
acid as a stabilizer [20]. Briefly, by a molar ratio of 2:1,
sodium borohydride was used to react with tellurium in
water to prepare the sodium hydrogen telluride (NaHTe).
Fresh solutions of NaHTe were diluted with N
2
-saturated
deionic water to 0.0467 M for further use. CdCl
2
(1 mmol)
and thioglycolic acid (1.2 mmol) were dissolved in 50 mL
of deionized water. Stepwise addition of NaOH solution
adjusted the precursors solution to pH = 9. Then,
0.096 mL of oxygen-free solution containing fresh NaHTe,
cooled to 0 °C, was added into 10 mL of the above pre-
cursor solution and vigorously stirred. Finally, the solution
with a faint yellow color was put into a Teflon-lined
stainless steel autoclave with a volume of 15 mL. The
autoclave was maintained at the reaction temperature
(200 °C) for a certain time and then cooled to the room
temperature by a hydro-cooling process.
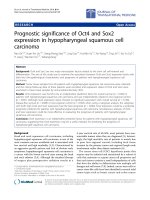
The core diameter of the QDs used in this work was
around 3.5 nm with an emission peak at 601 nm as shown
in Fig. 1. The average hydrodynamic diameter of the QDs
was around 28 nm as measured by the method of dynamic
light scattering (Malvern, Autoszer 4700).
LysoTracker Green DND-26, BODIPY FL C
5
-ceramide
complexed to BSA and MitoFluor Green were used as
indicators for lysosomes, Golgi complex and mitochondria,
respectively. The emission peaks of these indicators are all
around 511 nm.
The co-incubation of QGY (or RBL) cells with QDs and
the fluorescent marker (LysoTracker, Golgi body marker,
or MitoTracker) was carried out as follows: cells obtained
from the Cell Bank of Shanghai Science Academy were
seeded onto a glass cover slip placed in a culture dish
containing DMEM-H medium with 10% fetal bovine
serum, 100 lgmL
-1
streptomycin and 100 lgmL
-1
neomycin. The cells were then cultured in a fully humid-
ified incubator at 37 °Cwith5%CO
2
for their attachment
to the cover slip. When the cells reached 80% confluence,
the QD aqueous solution with a QD concentration of 50–
100 lgmL
-1
plus the LysoTracker (100 nM), Golgi body
marker (5 lM) or MitoTracker (100 nM) in the growth
medium were added into the culture dish [9]. The cells
were incubated for 30–60 min in an incubator before the
subcellular localization pattern of the QDs was studied.
The cells were kept at 37 °C during the microscopic
examination using a temperature controller (Olympus).
The fluorescence images of the intracellular QDs and the
markers for lysosome, Golgi complex and mitochondria
were acquired with a laser scanning confocal microscope
(Olympus, FV-300, IX71) using a 488 nm Ar
?
laser
(MELLES GRIOT) as the excitation source and a 609 oil
objective to focus the laser beam. The fluorescence micro-
graphs of QDs and the fluorescent marker (LysoTracker,
Golgi body marker, or MitoTracker) were recorded simul-
taneously in two channels of the microscope with a 585–640
nm bandpass filter for QDs and a 505–550 nm bandpass filter
for the fluorescent markers. Using the t-scan mode (30 s per
frame with 2.8 s exposure time) of the microscope, the
dynamic distributions of QDs, lysosomes, Golgi bodies and
mitochondria were studied.
Results and Discussion
The time-dependent fluorescence images of lysosomes
(green) and QDs (red) in RBL cells are depicted in Fig. 2.
With an incubation time of 30 min, the cytoplasm mem-
brane was stained with QDs and some QDs began to appear
inside the cells. Further, the kinetic fluorescence images
revealed that, from 30 min to 1 h, more QDs were trans-
ported into cells. From the merged image in Fig. 2c, it can
be seen that many of the lysosomes only showed the green
LysoTracker color at an early time (30 min), indicating
there were no QDs in these lysosomes; while at a later time
(55 min), most lysosomes showed a yellow color (a color
representing the mixed fluorescence from LysoTracker and
QDs), demonstrating the co-localization of QDs with these
lysosomes occurred. Same circumstances were observed for
QGY cells as well, in which more QDs were localized in
Fig. 1 Absorption and PL spectra of thiol-capped CdTe QDs in an
aqueous solution
Nanoscale Res Lett (2009) 4:606–612 607
123
lysosome at a later time (see Supporting Information,
Figure S1). Similar findings were reported by others, sug-
gesting an endosome/lysosome pathway for the endocytosis
of QDs [7, 9, 14, 15, 21].
However, Fig. 2c also reveals that there are still many
QDs showing the red color, indicating that these QDs were
localized in other sites than endosomes/lysosomes in the
cell. On the basis of the previous reports [17, 18, 22] that
Golgi complex was also a principal intracellular destination
of internalized molecules and particles, we employed
BODIPY FL C5-ceramide complexed to BSA as the Golgi
marker to examine if QDs could be localized in Golgi
complex. The fluorescence micrographs to show the time-
dependent distributions of Golgi complex and QDs in RBL
and QGY cells are depicted in Figs. 3 and 4, respectively.
It can be seen clearly that many of the endocytosed QDs
Fig. 2 Time-dependent
fluorescence micrographs of the
distributions of lysosomes and
QDs in RBL cells. a The
distribution of lysosomes
(green), b the distribution of
QDs (red), c the merged image
of (a) and (b) in which the
yellow color denotes the mixed
fluorescence from QDs and
LysoTracker, and d differential
interference contrast (DIC)
micrograph
Fig. 3 Time-dependent
fluorescence micrographs of the
distributions of Golgi
complexes and QDs in RBL
cells. a The distribution of
Golgi complexes (green), b the
distribution of QDs (red), c the
merged image of (a) and (b)in
which the yellow color denotes
the mixed fluorescence from
QDs and Golgi marker, and
d DIC micrograph
608 Nanoscale Res Lett (2009) 4:606–612
123
were gradually transported to the Golgi complexes in cells,
indicating the co-localization of QDs with Golgi bodies.
One hour later, almost all the Golgi complexes were filled
with QDs, providing evidence that the Golgi complex is
also an important terminal target of these thiol-capped
CdTe QDs. In QGY cells, with an incubation time of
55 min, the distribution of QDs shows a similar shape as
that of Golgi complexes (Fig. 4a, b). Then 55 min later,
most of the Golgi complexes were filled with QDs, dem-
onstrating that the Golgi complex is also an important
terminal target of these thiol-capped CdTe QDs.
To obtain the quantitative data of the co-localization of
QDs with Golgi complexes over time, we selected a Golgi
complex area in a QGY cell in Fig. 4 to analyze the time-
dependent fluorescence intensity of QDs using the software
of Flouview supplied by Olympus. The results are shown in
Figs. 5 and 6. It can be seen clearly in Fig. 5 that the
fluorescence intensity was much stronger at a later time.
Figure 6 shows that the fluorescence intensity increased
almost linearly during the incubation period from 30 to
55 min, demonstrating a gradual increase of the amount of
QDs transported into Golgi complexes.
Fig. 4 Time-dependent
fluorescence micrographs of the
distributions of Golgi
complexes and QDs in QGY
cells. a–d Images as described
in Fig. 3
Fig. 5 Distribution of fluorescent intensity of QDs in an area co-localized with Golgi complex in a QGY cell: a 30 min and b 55 min
Nanoscale Res Lett (2009) 4:606–612 609
123
Some enlarged micrographs to show a movement of
endocytosed QDs (marked with arrow) toward the Golgi
complex in the perinuclear region of a QGY cell are
demonstrated in Fig. 7. This movement may be caused by a
microtubule-dependent transport mechanism, an active
process that is mediated by molecular motors such as
dyneins [14].
The mitochondrial localization of QDs was also studied
for RBL (Fig. 8) and QGY (see Figure S2 in Supporting
Information) cells. After 1 h incubation of QDs, only a few
mitochondria were stained with QDs, indicating that the
mitochondrion is not the main site of the QD distribution.
Conclusions
The understanding of the cellular delivery and subcellular
distribution of QDs are of particular importance for cellu-
lar labeling with QDs, especially the labeling of subcellular
compartments. Although QDs without surface bioconju-
gations were reported to be difficult to enter into cells [15],
the thiol-capped CdTe QDs used in this work could be well
internalized into living cells in vitro over a time period of
about 1 h. This is probably due to the fact that the surface
of the thiol-capped QD contains carboxylic groups, which
may function as the biological interfacing [5]. There are
complex and interconnected pathways that can carry mol-
ecules to various destinations within the endosomal system.
It is well known that the cellular delivery of QDs is med-
iated through the endocytic route with the destinations of
endosomes/lysosomes. The finding from this study shows
that in addition to the endosome-lysosome endocytosis
pathway, Golgi complex is also a main destination of the
CdTe QDs, although the mechanism is not clear yet. This
new finding not only provides information about the
delivery of intracellular QDs, but will also be important
toward the design and development of nanoparticle probes
for intracellular imaging and therapeutic applications.
Fig. 6 Fluorescence intensity of QDs as a function of time in an area
co-localized with Golgi complex in a QGY cell
Fig. 7 Active transportation of the endocytosed QDs (arrow) toward a Golgi complex in a QGY cell
610 Nanoscale Res Lett (2009) 4:606–612
123
Acknowledgments This work was supported by National Natural
Science Foundation of China (60638010, 10774027, 50525310), and
Shanghai Municipal Science and Technology Commission
(06ZR14005, 05QMX1404).
References
1. Y.H. Sun, Y.S. Liu, P.T. Vernier, C.H. Liang, S.Y. Chong,
L. Marcu, M.A. Gundersen, Nanotechnology 17, 4469 (2006).
doi:10.1088/0957-4484/17/17/031
2. Y. Zhang, J. He, P.N. Wang, J.Y. Chen, Z.J. Lu, D.R. Lu, J. Guo,
C.C. Wang, W.L. Yang, J. Am. Chem. Soc. 128, 13396 (2006).
doi:10.1021/ja061225y
3. P. Alivisatos, Nat. Biotechnol. 22, 47 (2004). doi:10.1038/nbt927
4. I.L. Medintz, H.T. Uyeda, E.R. Goldman, H. Mattouss, Nat.
Mater. 4, 435 (2005). doi:10.1038/nmat1390
5. X. Michalet, F.F. Pinaud, L.A. Bentolila, J.M. Tsay, S. Doose, J.J.
Li, G. Sundaresan, A.M. Wu, S.S. Gambhir, S. Weiss, Science
307, 538 (2005). doi:10.1126/science.1104274
6. W.J. Parak, T. Pellegrino, C. Plank, Nanotechnology 16,R9
(2005). doi:10.1088/0957-4484/16/2/R01
7. O. Seleverstov, O. Zabirnyk, M. Zscharnack, L. Bulavina, M.
Nowicki, J M. Heinrich, M. Yezhelyev, F. Emmrich, R. O’Re-
gan, A. Bader, Nano Lett. 6, 2826 (2006). doi:10.1021/nl0619711
8. A. Cambi, D.S. Lidke, D.J. Arndt-Jovin, C.G. Figdor, T.M. Jovin,
Nano Lett. 7, 970 (2007). doi:10.1021/nl0700503
9. S.J. Cho, D. Maysinger, M. Jain, B. Ro
¨
der, S. Hackbarth, F.M.
Winnik, Langmuir 23, 1974 (2007). doi:10.1021/la060093j
10. S.B. Courty, C. Luccardini, Y. Bellaiche, G. Cappello, M. Dahan,
Nano Lett. 6, 1491 (2006). doi:10.1021/nl060921t
11. A.M. Derfus, W.C.W. Chan, S.N. Bhatia, Adv. Mater. 16, 961
(2004). doi:10.1002/adma.200306111
12. X.L. Nan, P.A. Sims, P. Chen, X.S. Xie, J. Phys. Chem. B 109,
24220 (2005). doi:10.1021/jp056360w
13. S.S. Rajan, T.Q. Vu, Nano Lett. 6, 2049 (2006). doi:10.1021/
nl0612650
14. G. Ruan, A. Agrawa, A.I. Marcusan, S.M. Nie, J. Am. Chem.
Soc. 129, 14759 (2007). doi:10.1021/ja074936k
15. J. Silver, W. Ou, Nano Lett. 5, 1445 (2005). doi:10.1021/
nl050808n
Fig. 8 Fluorescence micrographs of the distributions of mitochondria
and QDs in RBL cells after 1 h incubation. a The distribution of
mitochondria (green), b the distribution of QDs (red), c the merged
image of (a) and (b) in which the yellow color denotes the mixed
fluorescence from QDs and MitoFluor, and d DIC micrograph
Nanoscale Res Lett (2009) 4:606–612 611
123
16. I. Nabiev, S. Mitchell, A. Davies, Y. Williams, D. Kelleher,
R. Moore, Y.K. Gun’ko, S. Byrne, Y.P. Rakovich, J.F. Donegan,
A. Sukhanova, J. Conroy, D. Cottell, N. Gaponik, A. Rogach,
Y. Volkov, Nano Lett. 7, 3452 (2007). doi:10.1021/nl0719832
17. F.R. Maxfield, T.E. McGraw, Nat. Rev. Mol. Cell Biol. 5, 121
(2004). doi:10.1038/nrm1315
18. S. Mukherjee, R.N. Ghosh, F.R. Maxfield, Physiol. Rev. 77, 759
(1997)
19. B.J. Nichols, Nat. Cell Biol. 4, 374 (2002)
20. J. Guo, W.L. Yang, C.C. Wang, J. Phys. Chem. B 109, 17467
(2005). doi:10.1021/jp044770z
21. W.J. Parak, R. Boudreau, M.L. Gros, D. Gerion, D. Zanchet,
C.M. Micheel, S.C. Williams, A.P. Alivisatos, C. Larabell, Adv.
Mater. 14, 882 (2002). doi:10.1002/1521-4095(20020618)14:
12\882::AID-ADMA882[3.0.CO;2-Y
22. P. Watson, A.T. Jones, D.J. Stephens, Adv. Drug Deliv. Rev. 57,
43 (2005). doi:10.1016/j.addr.2004.05.003
612 Nanoscale Res Lett (2009) 4:606–612
123