Báo cáo hóa học: " Use of Ionic Liquid in Fabrication, Characterization, and Processing of Anodic Porous Alumina" pot
Bạn đang xem bản rút gọn của tài liệu. Xem và tải ngay bản đầy đủ của tài liệu tại đây (406.58 KB, 8 trang )
NANO EXPRESS
Use of Ionic Liquid in Fabrication, Characterization,
and Processing of Anodic Porous Alumina
Marco Salerno Æ Niranjan Patra Æ Roberto Cingolani
Received: 19 February 2009 / Accepted: 24 April 2009 / Published online: 8 May 2009
Ó to the authors 2009
Abstract Two different ionic liquids have been tested in
the electrochemical fabrication of anodic porous alumina in
an aqueous solution of oxalic acid. It was found that during
galvanostatic anodization of the aluminum at a current
density of 200 mA/cm
2
, addition of 0.5% relative volume
concentration of 1-butyl-3-methylimidazolium tetrafluob-
orate resulted in a three-fold increase of the growth rate, as
compared to the bare acidic solution with the same acid
concentration. This ionic liquid was also used successfully
for an assessment of the wettability of the outer surface of
the alumina, by means of liquid contact angle measure-
ments. The results have been discussed and interpreted
with the aid of atomic force microscopy. The observed
wetting property allowed to use the ionic liquid for pro-
tection of the pores during a test removal of the oxide
barrier layer.
Keywords Porous alumina Á Anodization Á
Galvanostatic Á Ionic liquids Á Wettability Á Roughness
Introduction
Anodic porous alumina (APA [1–4]), also called porous
anodic alumina (PAA) [5–9]), anodic aluminum oxide
(AAO [10, 11]), or alumite [12, 13], is a form of Al
2
O
3
,
which is deposited onto an aluminum (Al) foil working as
the positively biased pole of an electrolytic cell [14–16].
Whereas in basic or neutral electrolytes (ELs) a compact
alumina layer is grown, called ‘‘barrier’’ layer, in acidic
ELs that can dissolve the oxide a porous alumina layer is
grown, on top of a thin (10–100 nm [17]) barrier-type
layer. Depending on the applications, pore ordering in APA
can be necessary either on both sides such as for photonic
crystals made by using APA as a lithographic mask [18], or
only on one side such as for in situ photonic crystals made
by incorporating materials on one APA surface [19–21], or
on none of the two sides such as for filtering membranes
[22–24], biosensor electrodes with enhanced surface area
[4], and templates for the growth of separated metal
nanowires [13, 25, 26], or supported oxide or polymer
nanotubes [27, 28]. However, for several applications, it is
desirable that the APA thickness h is comparatively high,
h C 100 lm. This can give the film the required robustness
for use as either a standalone membrane in case of, e.g.,
battery separator [23] or lithographic etching mask [18,
29], or the required high aspect ratio (a.r. = h/d, where d is
the pore diameter) when using the layer as a template for,
e.g., nanowire electrodeposition (where a.r. C 1,000 can be
required [21, 30]). However, the film growth rate v
g
reported so far for conventional mild anodization (MA) of
Al has been in the order of 0.03–0.1 lm/min [31], which
makes the growth of thick APA quite time consuming. This
slow growth hinders the advantage of the relatively cheap
setup for the fabrication of APA, discouraging its use for
both the development of prototype structures in the
research academy, and for possible industrial fabrication
processes. The current interest in speeding up the APA
growth has recently found a viable way in the application
of a single-step process combining MA with industrial hard
anodization (HA) conditions [31], made possible by the
protecting oxide layer grown during the preliminary MA
phase.
Another possible route for fast APA fabrication could be
the identification of proper additives, which can
M. Salerno (&) Á N. Patra Á R. Cingolani
Nanobiotechnology Department, The Italian Institute of
Technology, via Morego 30, Genova 16163, Italy
e-mail:
123
Nanoscale Res Lett (2009) 4:865–872
DOI 10.1007/s11671-009-9337-3
conveniently change the environmental conditions for
anodization. Ionic liquids (ILs) are a class of solvents that
have recently attracted a renewed interest as chemical
additives in a number of reactions [32, 33]. To our
knowledge, the only use of APA and IL system has been so
far as an additive in the fabrication of cobalt nanowires
inside an APA template [9]. In this work, we report on the
use of ILs in the fabrication and characterization of APA,
starting from a well-known APA fabrication EL such as
oxalic acid. The idea behind using IL additives in this
system is that the convective flow of the IL component
species can facilitate the displacement of the EL ions
useful for anodization, and avoid formation of strong
temperature gradients between the anode and the beaker
walls, which are in direct contact with the refrigerating
bath.
Materials and Methods
Sample Fabrication
We used 0.25-mm thick foils of polycrystalline Al
(Goodfellows, 99.999% purity). The foils were cut with
scissors into rectangular pieces of single face area
S * 15 9 3mm
2
, and flattened back to roughly planar
surface, after scissors curling, by pressing each of them
between two new glass slides.
Degreasing was performed by hand brushing ([10 s)
with acetone-wet lens paper, 3 min sonicating in warm
(60 °C) acetone, rinsing in de-ionized (DI) water, soni-
cating another 3 min in warm (60 °C) ethanol, and thor-
oughly washing ([30 s) in running DI water.
After degreasing, an electropolishing (EP) step was
performed on the Al foil, which was partly dipped in a 250-
mL beaker filled up to 200 mL with a 1:5 v/v HClO
4
:-
C
2
H
5
OH mixture, and kept inside a refrigerating bath set at
T
bath
=?7 °C. The cathode was a Pt plate, also partly
dipped in the EL, kept at a gap distance of g * 11 mm
from the Al anode. The process was run for 7 min without
stirring, at constant current i
EP
.
In our setup, both sides of the dipped Al foil come into
contact with the EL, the anodic contact being provided
from the top, outside the EL. The dipped single face sur-
face area for EP was S
EP
* 12 9 3mm
2
, and as a result
the constant current density was J
EP
= i
EP
/2S
EP
*
170 mA/cm
2
. During the process, hydrogen gas evolution
could be observed at the cathode. The final Al surface
looked mirror-like.
Since in our setup immersion of the beaker in the
refrigerating bath was not compatible with stirring onto a
magnetic plate, the temperature close by the Al anode was
probably higher than T
bath
(*?10 °C difference has been
measured in several cases). We tried to minimize this effect
during anodization as compared to EP, by keeping the
anode as close as possible to the external temperature
controlled bath, using in this case a much smaller beaker
(50 mL, filled up to 30 mL).
As the starting anodization EL, we chose an aqueous (DI
water) solution of oxalic acid ((COOH)
2
, Sigma-Aldrich,
Italy), and decided to run this process as well as the EP at
T
bath
=?7 °C without stirring. We have only run single
anodization processes, and considered the inner APA sur-
face (in contact with the Al substrate) as the test surface for
the layer quality, that is the regular pore arrangement. The
outer APA surface (in contact with the EL) has been
checked as well, soon after anodization, for an estimation
of the outer pore mouth diameter d
out
.
The anodizations were all run in galvanostatic mode,
changing as a parameter the anodization current i and so
the current density J = i/2S
anod
, where S
anod
is the dipped
anode surface. An S
anod
* 10 9 3mm
2
was used, signif-
icantly smaller than S
EP
, to be sure to anodize only elec-
tropolished Al surface, and to avoid that possible side
effects occurring at the ambient air–EL meniscus insist on
the same region during the two consecutive processing
steps, (namely EP and anodization).
As ILs to test we chose two different commercially
available room temperature (RT) water-soluble ILs, namely
1-butyl-3-methylimidazolium 2-(2-methoxyethoxy) ethyl
sulfate (C
13
H
26
N
2
O
6
S, ‘‘IL1’’) and 1-butyl-3-methylimi-
dazolium tetrafluoborate (C
8
H
15
BF
4
N
2
, ‘‘IL2’’), both from
Sigma-Aldrich. The choice was driven by the former being
particularly rich in oxygen, possibly taking place in the
anodization reaction in spite of the oxalic acid and/or water
oxygen, and the latter being very easily soluble in water.
Sample Characterization
The APA outer and inner surfaces were imaged by means of
atomic force microscopy (AFM) with a MFP-3D instrument
(Asylum Research, USA), operating in Tapping mode with
gold-coated silicon cantilever probes NSG10 (NT-MDT,
Russia). The probes had a nominal resonance frequency
*250 kHz and standard tip (apex diameter *10 nm,
aspect ratio *2.6). Apart from surface quality inspection,
the AFM images of the outer APA surface have also been
used for quantitative determination of the sample roughness
by means of the root mean square (RMS) of the distribution
of sample features height. The RMS values of at least three
AFM images acquired in different regions with 10 lm scan
size have been averaged for each APA sample.
The APA top surface wettability was measured with
different solvents by means of sessile drop method, using a
DataPhysics OCAH 200 at laboratory conditions (temper-
ature 17–20 °C, relative humidity 40–60%). Droplets of
866 Nanoscale Res Lett (2009) 4:865–872
123
*1 lL volume (drop diameter *1 mm) have been used in
all cases. Similarly to the RMS measurements, for the
liquid contact angles (CAs), the values on at least three
different regions on each sample have been averaged as
well. For both used liquids and especially for the IL2
solution, the CAs were soon decreasing in time after
touching the APA surface. The reported values have been
measured immediately after contact (t \ 5 s).
For removal of the Al substrate, which was necessary to
determine the APA thickness h, we adopted a non-standard
technique. The reason was that in our samples the Al was
sandwiched between two adjacent APA films, and in these
conditions, we found the standard dissolution in either
saturated HgCl
2
[1, 4, 6, 34–38] or CuCl
2
[7, 8] not to be so
effective as for one-side APA films on Al. Therefore, we
decided to run a second EP-like process in much harder
conditions than during the Al smoothing step, namely at
RT and current density *10 J
EP
. The hard Al etching was
accompanied by a strong hydrogen bubbling at the cathode
and by a typical noise, while quasi-periodic (1–2 Hz) Al
spitting off between the two APA films was visible through
the beaker walls. We stopped the process when we could
see that a significant loss of Al had already occurred at the
bottom of the dipped sample, sufficient for optical
inspection (typically after a time t * 30 s). The APA
thickness h was then measured by optical micrographs
acquired in reflection perpendicular to the film sections,
with a ± 1 lm resolution uncertainty.
Results and Discussion
Anodization in Bare Oxalic Acid
The preliminary EP step significantly improved the starting
Al surface quality, as the local RMS roughness measured
by AFM for 30 lm scan size changed from *150 nm to
*5 nm. On this surface, APA was grown by anodization.
According to the current understanding of the process [5,
14, 17], for a given EL the value of the electric field E at
the Al surface is the key parameter for optimal growth of
APA. The process relies on the balance between the
chemical dissolution rate of the pores and the diffusion rate
of the ions involved in the chemical reactions of the
anodization (namely the incoming O
2-
and the outcoming
Al
3?
, with respect to the anode). Since in first approxi-
mation of parallel plate electrodes at distance g, a uniform
field between them applies E = V/g, where V is the
anodization voltage, potentiostatic anodization at constant
V seems to be the most appropriate mode for controlled
growth of APA. However, the growth rate v
g
is actually
correlated with the ion transport rate, and finally with the
anodization current i. Therefore, galvanostatic anodization
[39–41] is probably the most appropriate for controlling the
final film thickness h, and this is the mode that we have
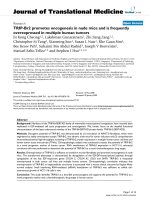
adopted for our work. In Fig. 1a, a few voltage–time
characteristic curves V(t) acquired during galvanostatic
anodization in our setup are displayed. The total anodiza-
tion time was always set to t
end
= 30 min, whereas the
current density J was varied. The oxalic acid concentration
was 0.3 M, as reported in most works done with this EL [1,
3, 6, 11, 31, 34–36, 42–45].
Independent of the anodization mode, if either poten-
tiostatic or galvanostatic, in the steady state both i and V
should be constant over the process time t, as for ionic
conduction it is i * e
aV
, with a an appropriate constant
[5, 14]. However, V(t) is linearly increasing in Fig. 1a after
Fig. 1 a V(t) curves for anodization in bare oxalic acid (0.3 M) at
different J = 20, 50, 100 and 200 mA/cm
2
, from bottom to top curve.
T
bath
=?7 °C, no stirring, t
end
= 30 min. b Final values of h for the
different J, as determined by optical microscopy after dissolution of
the Al substrate. Inset: typical resulting double film APA
Nanoscale Res Lett (2009) 4:865–872 867
123
the initial transients, with different rates increasing in turn
with J. This behavior shows that we were not in a condition
of equilibrium for the different anodization reactions. The
reason can be that in our setup immersion of the EL beaker
in the cooling bath was not compatible with stirring onto a
magnetic plate. Therefore, a local depletion of ions in the
EL close to the anode, along with formation of a stable ion
concentration gradient, can have occurred over time, which
leads to a progressive increase in V in order for the power
supply to keep J constant.
The h values obtained at t
end
= 30 min as a result of the
corresponding anodizations have been plotted in Fig. 1b. If
the same current efficiency of the process was maintained
in all the anodizations and for all the process time period, a
linear relationship between J and h was expected [5, 22].
However, after the initial increase in h with increasing J a
tendency to saturation is observed in Fig. 1b. Obviously, a
progressive reduction of the current efficiency has occur-
red, probably due to the appearance of side reactions dif-
ferent from the anodization ones [5].
Actually, side reactions can also occasionally lead to
catastrophic events, such as shown in Fig. 1a for the curve
at J = 200 mA/cm
2
. In that case after reaching a critical
value V
crit
* 95 V in t
crit
* 12 min, V started to decrease
with some fluctuations, and finally increased up to the
maximum power supply voltage. The reason for the latter
increase was that the Al foil was cut at the air–EL
meniscus, and the piece of anode dipped in the EL fell on
the bottom of the beaker, opening the circuit. The APA
thickness measured for this sample was h
crit
= 11 lm,
such that the respective critical electric field was E
crit
=
V
crit
/h
crit
* 8.6 MV/m. This is *36% lower than the
dielectric strength of compact alumina, E
break
= 13.4
MV/m [46]. Whereas this could be partly due to the porous
nature of our alumina, we do not think that the origin of
this behavior is the dielectric breakdown of the oxide due
to the high V reached. Instead, we assign the discontinuity
in the curve to a temperature activated fast etching of
the Al at the air–EL meniscus, where on fluctuations of the
interface the bare Al can locally come into contact with
the EL. In fact, when using a 10-fold diluted oxalic acid we
could reach a V
crit
* 160 V before that any similar cata-
strophic event occurred, with a respective h
crit
* 13 lm,
which gives E
crit
* 12.3 MV/m, much closer to E
break
.
Furthermore, in the latter case, the final steep change of
voltage was toward the zero (closed circuit with virtually
no resistance), and there was no anode resection of the
air–EL meniscus.
The limited improvement in h obtained in the consid-
ered time period t
end
on increasing J in bare oxalic acid
resulted in a maximum (non-linear) mean growth rate
v
g
max
= h
crit
/t
crit
* 0.83 lm/min (obtained for J = 200
mA/cm
2
).
In Fig. 2a, the results of a morphological analysis of the
outer APA surface of the samples fabricated during the
anodizations of Fig. 1 are displayed. By means of AFM,
both the outer pore mouth diameter d
out
and the distance
between adjacent pores D
out
have been measured [47], after
averaging values extracted from cross-sections taken along
differently oriented lines in the AFM images. The overall
RMS surface roughness was also estimated.
All the quantities in Fig. 2a have been plotted versus the
anodization current density J. One can see that d
out
is
approximately constant within the errors, as expected,
since it should depend only on the type of EL and on its
concentration. The weak increase actually observed can be
due to a local rise of the EL temperature and thus of the
oxide dissolution rate, probably occurring during anod-
ization. On the contrary, D
out
is clearly increasing with J.
Indeed, D
out
should increase with V [5, 14, 17], and our V(t)
Fig. 2 Morphological characterization of the outer surface of APA
prepared in 0.3 M oxalic acid. a Results of the AFM measurements:
pore diameter d
out
(open circles), interpore distance D
out
(filled
circles), and surface RMS roughness values, for 10 lm scan size
(filled squares). b Contact angles h measured in ambient air on the
same APA surfaces, using either DI water (filled squares) or a 10%
v/v aqueous solution of IL2 (open squares), respectively
868 Nanoscale Res Lett (2009) 4:865–872
123
curves in Fig. 1a showed a V that increased during each
anodization. As a consequence, the roughness is almost
constant for the higher J values (i.e., the larger D
out
),
whereas it is significantly depressed for the lowest J (i.e.,
the smallest D
out
). We attribute this effect to the spatial
‘‘low-pass’’ characteristic of the AFM probe tip, which can
hardly penetrate the smaller pores and thus senses the
respective APA as an almost continuous, smooth surface.
Anodizations in Oxalic Acid–IL Solutions
We then added our ILs to the oxalic acid starting solution.
The amount of IL is expressed as the volume concentration
c relative to the oxalic acid starting solution, (v/v, %).
As we had little amount of ILs available (*4.2 mL for
each type), we decided to work with a lower oxalic acid
concentration, namely 0.03 M. In this way, we also plan-
ned to partially compensate for the expected increase in i
(for similar V) with respect to the bare oxalic acid EL due
to the high electrical conductivity of the IL additive. In
Fig. 3a, some V(t) curves are displayed for anodizations,
which were run in this diluted oxalic acid, all with
J * 100 mA/cm
2
. The effect of the 10-fold dilution of the
acid can be seen in the dotted line (top most) curve of
Fig. 3a, corresponding to an anodization run with external
cooling (T
bath
=?7 °C) and without EL stirring. For the
same J as in Fig. 1a, an approximately two-fold increase in
V is observed. However, the final APA thickness was
approximately the same (h * 20 lm grown in t
end
=
30 min), as expected in galvanostatic control, under the
hypothesis of no decrease in current efficiency.
The general effect of addition of an IL in the EL, as
compared to all the possible different anodization condi-
tions for our setup, can also be seen in Fig. 3a. With
respect to the dotted line curve, obtained for anodization
run with external cooling and without stirring, the dashed
line curve beneath it was obtained in the same EL also
without stirring yet at RT. This curve presents a quite
constant V level (after the initial transients). Obviously the
higher EL temperature allowed for maintaining a higher
ionic mobility as well, and no local ion depletion at the
anode occurred, different from the cooled EL condition,
(Figs. 1a, 2a dotted line). A similar effect of approximately
constant V was observed when the anodization was run at
RT and stirring was also activated, as shown by the con-
tinuous line curve beneath the dashed one. In this case, the
V level was even lower, as probably ion exchange and
transport was further eased by the mechanical agitation,
which was added to the thermal one. As a drawback
obviously some instabilities were generated in the system,
which resulted in strong fluctuations of V. The situation of
both cooled and stirred 0.03 M oxalic acid EL is not
shown, as it was not experimentally accessible in our setup,
but we would also expect a similar situation of approxi-
mately constant V(t), with intermediate V level lying
between the high (RT, stirring) and the low (cooling, no
stirring) ion mobility conditions. The V(t) curves for
anodization with cooled EL and no stirring (i.e., low ion
mobility condition) but with IL content c = 0.5% are also
reported in Fig. 3a (thick black line for IL2 and thick gray
line for IL1, respectively). One can see that the V level at
regime was constant also in the latter cases, but signifi-
cantly lower than for all the no-IL containing EL condi-
tions. This was obviously due to the increased electrical
conductivity of the EL after injection of the IL ions.
Fig. 3 a V(t) characteristic curves obtained for galvanostatic anod-
ization (J = 100 mA/cm
2
) in 0.03 M oxalic acid for t
end
= 30 min
under different conditions. From top to bottom: dotted line: same
conditions as in Fig. 1a (i.e., with cooling and without stirring) but the
10-fold diluted EL. Dashed line: RT, no stirring. Continuous line: RT,
stirring. Thick line: cooling, no stirring, IL2 additive with c = 0.5%
v/v. Thick gray line: cooling, no stirring, IL1 additive with c = 0.5%
v/v. b Values of v
g
measured for t
end
= 30 min, for different
combinations of IL2 relative concentration c and current density
J.(Void circles: projections of the data points to the axis planes)
Nanoscale Res Lett (2009) 4:865–872 869
123
From Fig. 3a, it is clear that by keeping V low via the IL
additive one can run anodization at comparatively high i as
compared to standard values reported in the literature for
bare oxalic acid EL, and still operate in MA condition. This
should allow for avoiding detrimental effects such as the
barrier breakdown observed in Fig. 1a. Furthermore, in
case of two-step anodization it would help to keep the
conditions as close as possible to the V desired for optimal
ordered APA growth, which for potentiostatic process in
oxalic acid is in the 40–60 V range [5, 10, 17].
The resulting conductivity of the IL1-added EL was four
times as much for the IL2-added EL. This could make one
think that the performance of IL1 solutions in APA growth
would be better. However, APA films were observed after
anodizations run with IL1 solutions only for the lowest
relative concentration values explored, namely c = 0.01%,
and with comparatively low J = 20 mA/cm
2
. In those
conditions, h was quite low, as expected (h
IL1
= 5–
10 lm). For higher J and/or higher c, no APA film was
obtained at all, and on the contrary black pits were always
observed on the Al substrate. At c = 0.5% and J = 600
mA/cm
2
, in particular, anodization resulted in complete
dissolution of the anode during successive rinsing in DI-
water. Obviously the result of the high oxygen content,
associated with the quite high conductivity (i.e., ion
mobility), makes the dominating effect of IL1 to be a heavy
ion bombardment of Al, rather than a support to the flow of
the EL ions.
For the IL that on the contrary demonstrated to provide
APA after most preliminary test anodizations, namely IL2,
we decided to systematically investigate the results of the
processes run for different combinations of c and J
parameters, in the range c = 0.01–2% and J = 20–
600 mA/cm
2
. In particular, in Fig. 3b, a part of the (c, J)
‘‘phase’’ space for all the combinations of the values
c = 0.1%, 0.5%, and 1.0% and J = 100, 200, and 400 mA/
cm
2
is shown, with respect to the resulting APA growth
rate. It turns out that a local maximum of v
g
was found for
the point (c, J) = (0.5%, 200 mA/cm
2
), with value v
g
max
(IL2) = 1.1 lm/min. This growth rate is higher than for
the same acidic EL with 10-fold higher concentration (see
Fig. 1b) and more than three times higher than for the EL
solution with the same acid concentration (V(t) dotted line
curve in Fig. 3a, v
g
* 0.3 /min).
Obviously, some improvement due to IL2 ions occurs
only at intermediate c and J values. For J, side effects can
be imagined to negatively affect APA formation on
excessive increase of this parameter, such as an extraor-
dinary local EL heating, with a consequent loss of current
efficiency. On the other hand, too many IL ions in solution
can overwhelm the other EL ions, and decrease the current
efficiency in turn. We can work out the molar ratio of the
IL–oxalic acid species in the experimentally observed best
condition of 0.5% v/v for IL2. The numbers of moles for
each species can be calculated as n
ox
= M
ox
V
ox
, where M
ox
is the molarity and V
ox
the volume of oxalic acid, and
n
IL2
= m
IL2
/MW
IL2
, where m
IL2
is the mass and MW
IL2
the molecular weight of IL2, respectively. Therefore, the
molar ratio is n
ox
/n
IL2
= M
ox
MW
IL2
/q
IL2
c, with q
IL2
the
mass density of IL2. Since it is MW
IL2
= 226.03 g/mole
and q
IL2
= 1.21 g/mL, for c = 0.5% it turns out n
ox
/
n
IL2
* 1.1. Therefore, the best improvement in v
g
on
addition of IL2 is obtained for a * 1:1 ratio of the IL2
moles with respect to the moles of the oxalic acid. When
this ratio was increased of a factor two, it was not possible
to grow APA any more even with IL2. On the contrary,
anodization run with the same ratio, obtained for example
by doubling both concentrations (M
ox
= 0.06 M and
c
IL2
= 1%), produced APA with consistent h values. The
color of the respective outer APA surfaces was also quite
similar, pale yellow in all cases, as usually observed due to
inclusion of oxalate ions [5, 14].
The molar ratio for the same relative concentration
c = 0.5% in the case of the other IL can also be calculated.
For IL1, being MW
IL1
= 338.42 g/mole and q
IL1
= 1.19
g/mL, it turns out n
ox
/n
IL1
* 1.7. This value is of the same
order of magnitude as for IL2. Anyway even for c = 0.1%,
no APA was obtained in the case of IL1, such that this
negative result can only be assigned to an inherent chem-
ical difference between the interaction of the two ILs with
the oxalic acid.
IL Aided Characterization and Processing
After using the IL2 as an additive in anodization, we have
also tried to take advantage of its properties in the char-
acterization of the system. In Fig. 2b, the liquid CAs h
measured on the APA surfaces described in Figs. 1, 2a
have been reported. The filled squares represent the CAs
obtained with DI-water as the wetting phase. One can see
that all the respective APA films look rather hydrophilic
(h
water
\ 90°). Most samples showed quite similar values
(h
water
* 29° ), whereas only the sample with smaller pores
showed a significantly higher h
water
. The reason is probably
that for that sample the pores were too small to be filled by
the water, and the drop was actually sitting on a mixed
APA–air interface [48]. In practical terms, the water
‘‘probe’’ did not allow for high enough resolution to sense
the smallest APA pores. A similar resolution limit affected
also the topographic measurements by AFM, as observed
in the RMS roughness plot of Fig. 2a (see the previous
subsection for discussion). In Fig. 2b, the open squares
report instead the CAs obtained with a c = 10% v/v
solution of IL2 in the DI-water wetting phase, h
IL2
. In this
case, the CA values were all quite similar to each other,
and lower than for the bare water, h
IL2
* 16° . This means
870 Nanoscale Res Lett (2009) 4:865–872
123
that the IL2 solution had higher wetting power than water,
and could wet even the smallest APA pores. Actually a
similar behavior is expected from any IL, which should
work such as a highly polar solvent that can easily pene-
trate voids of a few nanometer diameter only [3]. There-
fore, IL2 can also be used successfully for this kind of
characterization of the porous APA surface morphology.
We then decided to test the above property of IL2 in a
further processing step of our APA surfaces, namely the pore
opening. We performed this operation in concentrated, warm
oxalic acid (1 M, T
bath
=?30 °C) for 30 min. Before that, for
some APA samples, the surface was simply rinsed in DI-
water and blown dry with N
2
(for t [ 30 s). For some other
APA samples, the cleaned surface was also submerged in IL2
diluted aqueous solution for 10 min. Two representative
AFM images of inner APA surface after pore opening
without and with IL2 solution wet pores can be seen in
Fig. 4a, b, respectively. Similar results have been obtained
in several regions of different APA samples. Both images in
Fig. 4 refer to an early stage of etching, for which only some
pore bottoms have already been removed, and the exposed
surface is still comparatively close to the originally exposed
one (depth \ 100 nm). Obviously exposure of APA to the
IL2-water solution provided some level of protection of the
pore sidewalls after pore bottom opening. The reason is that
the inner pore voids cannot be easily penetrated by the
etching solution, after capillary effect, as they are already
occupied by the IL2-water solution instead. We have esti-
mated that for the considered etching stage about 20% of the
imaged areas were still covered by pores that were not yet
opened, in both cases of samples exposed or not to IL2–water
solution, whereas the laterally over-etched areas changed
from *25% to *5% in the case of IL2–water wet APA.
Conclusions
The effect of addition of ILs into an oxalic acid aqueous
solution commonly used for the fabrication of APA has
been investigated. Two different ILs have been used for the
first time as additives in this anodization process. By
adding one of them, namely 1-butyl-3-methylimidazolium
tetrafluoborate, in an approximately 1:1 molar ratio with
the solution acid, and properly tuning the current density,
we could obtain a growth rate of APA of 1.1 lm/min. This
growth rate is comparable to the value normally obtained in
the industrially applied HA conditions, but has been
obtained in MA conditions in our case. Therefore, our
process should make it possible to obtain thick APA layers
in comparatively short times (order of few hours) and with
ordered pore arrays also on the outer surface, after two-step
anodization in the appropriate V range. The high-anodiza-
tion current in itself does not guarantee fast APA growth,
as demonstrated when the other IL was used as the EL
additive. Therefore, a better understanding of the chemical
mechanisms underlying the observed increase in growth
rate has to be pursued, and is currently the subject of fur-
ther research activity in our group. However, the presently
reported preliminary results hold promise for the devel-
opment of a technologically viable procedure for the fast
growth of APA. In this application perspective, the possible
use of ILs in characterization of the porous film and in its
subsequent processing has also been explored. As a result,
the selected IL has been demonstrated to be useful also as a
pore wall protection medium during pore opening of APA,
a process step that is often taken when passing membranes
are fabricated out of the supported porous surfaces.
Fig. 4 Typical APA inner surface, in which the closed pore bottoms
have been partly opened by immersion in 1 M oxalic acid at 30 °C for
30 min, in the following conditions: a APA after cleaning only and b
APA after cleaning and keeping in 10% IL2 aqueous solution for
10 min. Both images have been smoothed with a 3x3 kernel Gaussian
filter
Nanoscale Res Lett (2009) 4:865–872 871
123
Acknowledgments The authors would like to thank Mr. Romeo
Losso for providing the original idea of using ionic liquids in the
preparation of anodic porous alumina and for the recommendations,
thereafter, and Mr. Claudio Larosa for technical support and useful
discussions on the topic.
References
1. H. Masuda, K. Fukuda, Science 268, 1466 (1995). doi:
10.1126/science.268.5216.1466
2. S. Ono, M. Saito, H. Asoh, Electrochim. Acta 51, 827 (2005).
doi:10.1016/j.electacta.2005.05.058
3. R. Redon, A. Vazquez-Olmos, M.E. Mata-Zamora, A. Ordonez-
Medrano, F. Rivera-Torres, J.M. Saniger, Rev. Adv. Mater. Sci.
11, 79 (2006)
4. E. Stura, D. Bruzzese, F. Valerio, V. Grasso, P. Perlo, C. Nicolini,
Biosens. Bioel. 23, 655 (2007). doi:10.1016/j.bios.2007.07.011
5. G.E. Thompson, Thin Solid Films 297, 192 (1997). doi:
10.1016/S0040-6090(96)09440-0
6. C.L. Liao, C.W. Chu, K.Z. Fung, I.C. Leu, J. Alloy Compd. 441,
L1 (2007). doi:10.1016/j.jallcom.2006.09.084
7. Y. Li, Z.Y. Ling, S.S. Chen, J.C. Wang, Nanotechnology 19,
225604 (2008). doi:10.1088/0957-4484/19/22/225604
8. W. Chen, J S. Wu, X H. Xia, ACS Nano 2, 959 (2008)
9. P. Yang, M. An, C. Su, F. Wang, Electrochim. Acta 54, 763
(2008). doi:10.1016/j.electacta.2008.06.064
10. Y.C. Sui, J.M. Saniger, Mater. Lett. 48, 127 (2001). doi:
10.1016/S0167-577X(00)00292-5
11. J H. Zhou, J P. He, G W. Zhao, C X. Zhang, J S. Zhao, H P.
Hu, Trans. Nonferrous Met. Soc. China 17, 82 (2007). doi:
10.1016/S1003-6326(07)60052-1
12. N. Tsuya, T. Tokushima, M. Shiraki, Y. Wakui, Y. Saito, H.
Nakamura, S. Hayano, A. Furugori, M. Tanaka, IEEE Trans.
Magn. 22, 1140 (1986). doi:10.1109/TMAG.1986.1064316
13. X. Bao, F. Li, R.M. Metzger, J. Appl. Phys. 79, 4866 (1996). doi:
10.1063/1.361635
14. J.W. Diggle, T.C. Downie, C.W. Goulding, Chem. Rev. 69, 365
(1969). doi:10.1021/cr60259a005
15. C.R. Martin, Chem. Mater. 8, 1739 (1996). doi:10.1021/
cm960166s
16. M. Lohrengel, Mater. Sci. Eng. Rep. 11, 243 (1993). doi:
10.1016/0927-796X(93)90005-N
17. F. Li, L. Zhang, R.M. Metzger, Chem. Mater. 10, 2470 (1998).
doi:10.1021/cm980163a
18. M. Nakao, S. Oku, T. Tamamura, K. Yasui, H. Masuda, Jpn J.
Appl. Phys. 38, 1052 (1999). doi:10.1143/JJAP.38.1052
19. A P. Li, F. Mu
¨
ller, A. Birner, K. Nielsch, U. Go
¨
sele, Adv. Mater.
11, 483 (1999). doi:10.1002/(SICI)1521-4095(199904)11:6\483::
AID-ADMA483[3.0.CO;2-I
20. F. Mu
¨
ller, A. Birner, J. Schilling, A.P. Li, K. Nielsch, U. Go
¨
sele,
V. Lehmann, Microsyst. Technol. 8
, 7 (2002). doi:10.1007/
s00542-002-0047-3
21. G. Sauer, G. Brehm, S. Schneider, K. Nielsch, R.B. Wehrspohn,
J. Choi, H. Hofmeister, U. Go
¨
sele, J. Appl. Phys. 91, 3243 (2002).
doi:10.1063/1.1435830
22. P. Bocchetta, C. Sunseri, G. Chiavarotti, F. Di Quarto, Electro-
chim. Acta 48, 3175 (2003). doi:10.1016/S0013-4686(03)
00348-7
23. A. Mozalev, S. Magaino, H. Imai, Electrochim. Acta 46, 2825
(2001). doi:10.1016/S0013-4686(01)00497-2
24. Anopore
TM
Inorganic Aluminum Oxide Membrane Filters,
SPI Sup-
plies & Structure Probe, Inc., 569 East Gay Street, West Chester,
PA 19380, USA
25. F. Li, R.M. Metzger, J. Appl. Phys. 81, 3806 (1997). doi:
10.1063/1.364776
26. M. Sun, G. Zangari, R.M. Metzger, IEEE Trans. Magn. 36, 3005
(2000). doi:10.1109/20.908488
27. H.J. Fan, W. Lee, R. Scholz, A. Dadgar, A. Krost, K. Nielsch, M.
Zacharias, Nanotechnology 16, 913 (2005). doi:10.1088/0957-
4484/16/6/048
28. S. Grimm, R. Giesa, K. Sklarek, A. Langner, U. Go
¨
sele, H W.
Schmidt, M. Steinhart, Nano Lett. 8, 1954 (2008). doi:
10.1021/nl080842c
29. J. Liang, H. Chik, A. Yin, J. Xu, J. Appl. Phys. 91, 2544 (2002).
doi:10.1063/1.1433173
30. R.B. Wehrspohn, A. Birner, F. Mu
¨
ller, J. Nielsch Schilling, U.
Go
¨
sele, Pits and Pores (Electro-chemical Society Proceedings,
Pennington, 2000)
31. W. Lee, R. Ji, U. Go
¨
sele, K. Nielsch, Nat. Mater. 5, 741 (2006).
doi:10.1038/nmat1717
32. P. Wasserscheid, T. Welton, Ionic Liquids in Synthesis (Wiley-
VCH Verlag GmbH & Co. KGaA, Weinheim, 2007)
33. B. Weyershausen, K. Lehmann, Green Chem. 7, 15 (2005). doi:
10.1039/b411357h
34. T. Xu, G. Zangari, R.M. Metzger, Nano Lett. 2, 37 (2002). doi:
10.1021/nl010075g
35. H. Masuda, H. Yamada, M. Satoh, H. Asoh, M. Nakao, T.
Tamamura, Appl. Phys. Lett. 71, 2770 (1997). doi:10.1063/
1.120128
36. A.P. Li, F. Mu
¨
ller, A. Birner, K. Nielsch, U. Go
¨
sele, J. Appl.
Phys. 84, 6023 (1998). doi:10.1063/1.368911
37. H. Masuda, K. Yada, A. Osaka, Jpn J. Appl. Phys. 37, L1340
(1998). doi:10.1143/JJAP.37.L1340
38. A.P. Li, F. Mu
¨
ller, A. Birner, K. Nielsch, U. Go
¨
sele, J. Vac. Sci.
Technol. A 17, 1428 (1999). doi:10.1116/1.581832
39. A. Zahariev, I. Kanazirski, A. Girginov, Inorg. Chim. Acta 361,
1789 (2008). doi:10.1016/j.ica.2007.03.040
40. W. Lee, R. Scholz, U. Go
¨
sele, Nano Lett. 8, 2155 (2008). doi:
10.1021/nl080280x
41. N. Bwana, J. Nanopart. Res.
10, 313 (2008). doi:10.1007/
s11051-007-9253-3
42. M.H. Rahimi, S.H. Tabaian, S.P.H. Marashi, M. Amiri, M.M.
Dalaly, S. Saramad, A. Ramazani, A. Zolfaghari, Int. J. Mod.
Phys. B 22, 3267 (2008). doi:10.1142/S0217979208048206
43. L. Zhang, H.S. Cho, F. Li, R.M. Metzger, W.D. Doyle, J. Mater.
Sci. Lett. 17, 291 (1998). doi:10.1023/A:1006577504924
44. W. Lee, K. Schwirn, M. Steinhart, E. Pippel, R. Scholz, U.
Go
¨
sele, Nat. Nano 3, 234 (2008). doi:10.1038/nnano.2008.54
45. K. Nielsch, F. Mu
¨
ller, A.P. Li, U. Go
¨
sele, Adv. Mater. 12, 582
(2000). doi:10.1002/(SICI)1521-4095(200004)12:8\582::AID-
ADMA582[3.0.CO;2-3
46. W. Martienssen, H. Warlimont, Springer Handbook of Con-
densed Matter and Materials Data (Springer, Berlin, 2005)
47. S. Shingubara, J. Nanopart. Res. 5, 17 (2003). doi:10.1023/A:
1024479827507
48. A.B.D. Cassie, S. Baxter, Trans. Faraday Soc. 40, 546 (1944).
doi:10.1039/tf9444000546
872 Nanoscale Res Lett (2009) 4:865–872
123