Báo cáo hóa học: " The Acute Liver Injury in Mice Caused by Nano-Anatase TiO2" docx
Bạn đang xem bản rút gọn của tài liệu. Xem và tải ngay bản đầy đủ của tài liệu tại đây (515.66 KB, 11 trang )
NANO EXPRESS
The Acute Liver Injury in Mice Caused by Nano-Anatase TiO
2
Linglan Ma Æ Jinfang Zhao Æ Jue Wang Æ Jie Liu Æ
Yanmei Duan Æ Huiting Liu Æ Na Li Æ Jingying Yan Æ
Jie Ruan Æ Han Wang Æ Fashui Hong
Received: 11 June 2009 / Accepted: 3 July 2009 / Published online: 1 August 2009
Ó to the authors 2009
Abstract Although it is known that nano-TiO
2
or other
nanoparticles can induce liver toxicities, the mechanisms
and the molecular pathogenesis are still unclear. In this
study, nano-anatase TiO
2
(5 nm) was injected into the
abdominal cavity of ICR mice for consecutive 14 days, and
the inflammatory responses of liver of mice was investi-
gated. The results showed the obvious titanium accumu-
lation in liver DNA, histopathological changes and
hepatocytes apoptosis of mice liver, and the liver function
damaged by higher doses nano-anatase TiO
2
. The real-time
quantitative RT-PCR and ELISA analyses showed that
nano-anatase TiO
2
can significantly alter the mRNA and
protein expressions of several inflammatory cytokines,
including nucleic factor-jB, macrophage migration inhib-
itory factor, tumor necrosis factor-a, interleukin-6, inter-
leukin-1b, cross-reaction protein, interleukin-4, and
interleukin-10. Our results also implied that the inflam-
matory responses and liver injury may be involved in nano-
anatase TiO
2
-induced liver toxicity.
Keywords Mice Á Nano-anatase TiO
2
Á Liver Á
Inflammatory cytokines Á Histopathological changes
Introduction
Titanium dioxide nanoparticles (nano-TiO
2
)(\100 nm) are
widely used in the cosmetics, pharmaceutical, and paint
industries as a coloring material because of its high sta-
bility, anticorrosion, and photocatalysis. More and more
nanoparticles are brought into the environment with the
increasing development and application of nanotechnol-
ogy. With the small size and large surface area, nanopar-
ticles can be an active group or exert intrinsic toxicity. It is
therefore important to clarify the effects of various nano-
particles on organs health as well as the pathogenic
mechanisms involved.
This information may have important clinical implica-
tions regarding the safety issue, as nano-TiO
2
are widely
used in the different spheres. Extra caution should therefore
be taken in the handling of higher dose nano-TiO
2
. Many in
vivo studies showed that nanoparticles can be accumulated
in the liver, kidney, spleen, lung, heart, and brain, whereby
generating various inflammatory responses [1–8]. For
instance, nanoparticles can promote enzymatic activities
and the mRNA expression of cytokines during proinflam-
matory responses in rats and mice [5–8] and in human
dermal fibroblasts and human lung epithelial cells [9]. In
the study of toxicity of nano-TiO
2
to rats by intratracheal
instillation, Afaq et al. [10] found that the number of
alveolar macrophage increased, the activities of glutathione
peroxidase, glutathione reductase, 6-phosphate glucose
dehydrogenase, and glutathione S-transferase were signifi-
cantly elevated. However, the production of lipid peroxi-
dation and hydrogen peroxide radicals was not altered with
increased activities of these enzymes, suggesting that nano-
TiO
2
(\30 nm) could induce the generation of antioxidant
enzymes in animals [10]. Oberdo
¨
rster et al. [11] showed
that the nano-TiO
2
(20 nm) induced the increase of the
Linglan Ma, Jinfang Zhao, and Jue Wang contributed equally to this
work.
L. Ma Á J. Zhao Á J. Wang Á J. Liu Á Y. Duan Á H. Liu Á N. Li Á
J. Yan Á J. Ruan Á H. Wang Á F. Hong (&)
Medical College of Soochow University, 215123 Suzhou,
People’s Republic of China
e-mail:
123
Nanoscale Res Lett (2009) 4:1275–1285
DOI 10.1007/s11671-009-9393-8
total protein of bronchoalveolar lavage fluid and the
activities of lactate dehydrogenase and acid-glucosidase in
rats and mice. The toxic effects of nano-TiO
2
in adult mice
have been accomplished, suggesting that higher dose nano-
TiO
2
(25 and 80 nm) increased the ratio of alanine ami-
notransferase to aspartate aminotransferase, the activity of
lactate dehydrogenase and the liver weight, and caused the
hepatocyte necrosis [8]. Our previous reports indicated
higher dose nano-anatase TiO
2
(5 nm) could damage liver
function [12] and induced an oxidative attack in liver of
mice [13].
It is well known that overexpression and activation of
nucleic factor-jB (NF-jB) may contribute to the patho-
genesis of hepatitis in animals [14]. Although it is known
that nano-TiO
2
or other nanoparticles can induce serious
liver toxicities, the mechanisms and the molecular patho-
genesis are still unclear. For example, can nano-TiO
2
particles, which are similar to hepatovirus, bind to DNA
and cause the inflammatory cascade after accumulation in
liver? When nano-TiO
2
particles stimulate hepatocytes, can
they induce inhibitory proteins such as IjBs phosphory-
lated and degraded, and then NF-jB activation, leading to
the gene transcription of the proinflammatory cytokines
and anti-inflammatory cytokines in the mouse liver?
Zhu et al. [15] proved that nano-TiO
2
of different size
and types showed different extents of cytotoxicity on CHO
cells and 293T cells with the sequence as 10–20 nm ana-
tase [ 50–60 nm anatase [ 50–60 nm rutile. TiO
2
can be
classified into three types: anatase, rutile, and amorphous.
The photoactivity of anatase-type TiO
2
was greater than
that of rutile, whereas amorphous do not show photocata-
lytic activity. Because anatase-type TiO
2
has the greatest
toxicity to cells among the three types, we need further
research to investigate its toxicity in mouse liver.
In this study, we investigate the effect of nano-anatase
TiO
2
on the induction of liver toxicity and inflammatory
response, its mechanisms, and the molecular pathogenesis.
Our findings will provide an important theoretical basis for
evaluating the toxicity underlying effects of nanoparticles
on animals and human.
Materials and Methods
Chemicals and Preparation
Nano-anatase TiO
2
was prepared via controlled hydrolysis
of titanium tetrabutoxide. The details of the synthesis are as
follows [16]: Colloidal titanium dioxide was prepared via
controlled hydrolysis of titanium tetrabutoxide. In a typical
experiment, 1 mL of Ti(OC
4
H
9
)
4
dissolved in 20 mL of
anhydrous isopropanol was added dropwise to 50 mL of
double distilled water adjusted to pH 1.5 with nitric acid
under vigorous stirring at room temperature. Then, the
temperature was raised to 60 °C and kept 6 h for better
crystallization of nano-TiO
2
particles. The resulting trans-
lucent colloidal suspension was evaporated using a rotary
evaporator yielding a nanocrystalline powder. The obtained
powder was washed three times with isopropanol and dried
at 50 °C until complete evaporation of the solvent. The
average grain size calculated from broadening of the (101)
X-ray diffraction peak of anatase (Fig. 1) using Scherrer’s
equation was approximately 5 nm. The Ti
2?
content in the
nano-anatase was measured by inductively coupled plasma
mass spectroscopy (ICP-MS), and O, C, and H contents in
the nano-anatase were assayed by Elementar Analysen-
systeme Gmbh, showing that Ti, O, C, and H contents in
the nano-anatase were 58.114, 40.683, 0.232, and 0.136%,
respectively. Bulk TiO
2
(rutile) was purchased from
Shanghai Chem., Co., and the average grain size was
10–15 lm.
A 0.5% hydroxypropylmethylcellulose K4M (HPMC,
K4M) was used as a suspending agent. Nano-anatase TiO
2
and bulk TiO
2
powder was dispersed onto the surface
of 0.5%, w/v HPMC, and then the suspending solu-
tions containing nano-TiO
2
and bulk TiO
2
particles were
treated by ultrasonic for 30 min and mechanically vibrated
for 5 min.
Animals and Treatment
CD-1 (ICR) mice of 70 females (20 ± 2 g) were purchased
from the Animal Center of Soochow University. Animals
were housed in stainless steel cages in a ventilated animal
room. Room temperature was maintained at20 ± 2 °C, with
relative humidity at 60 ± 10%, and a 12-h light/dark cycle.
Distilled water and sterilized food for mice were available
ad libitum. They were acclimated to this environment for
Fig. 1 The average grain size calculated from broadening of the
(101) XRD peak of anatase using Scherrer’s equation
1276 Nanoscale Res Lett (2009) 4:1275–1285
123
5 days prior to dosing. All procedures used in animal
experiments were in compliance with the local ethics com-
mittee. Animals were randomly divided into seven groups:
control group (treated with 0.5% HPMC) and six experi-
mental groups. Experimental groups were injected into
abdominal cavity with nano-anatase TiO
2
(5, 10, 50, 100, and
150 mg/kg BW) and with bulk TiO
2
(150 mg/kg BW)
everyday for 14 days, respectively. The control group was
treated with 0.5% HPMC. The symptom and mortality were
observed and recorded carefully everyday for 14 days. After
14 days, the body weight of all animals were weighed
accurately and sacrificed after being anesthetized by ether.
Blood samples were collected from the eye vein by removing
the eyeball quickly. Serum was collected by centrifuging
blood at 2,500 rpm for 10 min. The tissues and organs, such
as liver, spleen, kidneys, lung, heart, and brain, were excised
and washed carefully using 95% saline, then weighed
accurately.
Coefficients of Liver
After weighing the body and tissues, the coefficients of
liver to body weight were calculated as the ratio of tissues
(wet weight, mg) to body weight (g).
Preparation of DNA Samples from Mouse Liver
The DNA was extracted from the liver and purified as
described by the manual of DNA kits (Takara company),
A260/A280 ([1.8) indicated that the DNA was sufficiently
free of protein. The purified DNA was resuspended in Tris–
HCl buffer (pH 7.2).
Titanium Content Analysis of Liver and Liver DNA
Tissues were taken out and thawed. About 0.1–0.3 g of
each liver tissue and 0.5 mg of liver DNA from various
treated mice were weighed, digested, and analyzed for
titanium content. Briefly, prior to elemental analysis, the
tissues of interest were digested in nitric acid (ultrapure
grade) overnight. After adding 0.5 mL of H
2
O
2
, the mixed
solutions were heated at about 160 °C using high-pressure
reaction container in an oven chamber until the samples
were completely digested. Then, the solutions were heated
at 120 °C to remove the remaining nitric acid until the
solutions were colorless and clear. At last, the remaining
solutions were diluted to 3 mL with 2% nitric acid. ICP-
MS (Thermo Elemental X7, Thermo Electron Co.) was
used to analyze the titanium concentration in the samples.
Of indium, 20 ng/mL was chosen as an internal standard
element. The detection limit of titanium was 0.076 ng/mL.
Data are expressed as nanograms per gram of fresh tissue.
Biochemical Analysis of Liver Function
Liver function was evaluated with serum levels of alanine
aminotransferase (ALT), alkaline phosphatase (ALP),
aspartate aminotransferase (AST), lactate dehydrogenase
(LDH), pseudocholinesterase (PChE), leucine acid peptide
(LAP), total protein, albumin (ALB), globulin (GLB), and
total bilirubin (TBIL), triglycerides (TG), total cholesterol
(TCHO), high-density lipoprotein cholesterol (HDL-C) and
low-density lipoprotein cholesterol (LDL-C) using the
commercial kits (Bu
¨
hlmann Laboratories, Switzerland). All
biochemical assays were performed using a clinical auto-
matic chemistry analyzer (Type 7170A, Hitachi, Japan).
Histopathological Examination
For pathological studies, all histopathological tests were
performed using standard laboratory procedures. The tis-
sues were embedded in paraffin blocks, then sliced into
5 lm in thickness and placed onto glass slides. After
hematoxylin–eosin (HE) staining, the slides were observed,
and the photos were taken using optical microscope (Nikon
U-III Multi-point Sensor System, USA), and the identity
and analysis of the pathology slides were blind to the
pathologist.
Observation of Hepatocyte Ultrastructure by TEM
Liver was fixed by 2.5% glutaraldehyde in 0.1 mol/dm
3
cacodylate buffer for 2 h, washed three times with
0.1 mol dm cacodylate buffer (pH 7.2–7.4) and post-fixed for
1 h in 1% osmium tetroxide. The specimens were dehydrated
by a graded series of ethanol (75, 85, 95, and 100%) and
embedded in Epon 812. Ultrathin sections were obtained,
contrasted with uranyl acetate and lead citrate and observed
with a JEOL 1010 transmission electron microscope.
Expression Amount and Concentration Assay
of Inflammatory Cytokines
The mRNA expression of nucleic factor-jB (NF-jB),
macrophage migration inhibitory factor (MIF), tumor
necrosis factor-a (TNF-a), interleukin-6 (IL-6), interleukin-
1b (IL-1b), cross-reaction protein (CRP), interleukin-4
(IL-4), and interleukin-10 (IL-10) were determined by real-
time quantitative RT polymerase chain reaction (RT-PCR)
[17–19]. Liver in the same growth period from the three
different treatments were used. The right livers from mice
with or without nano-anatase TiO
2
treatment were homog-
enized using QIAzol lysis reagent with a Tissue Ruptor
(Roche). Total RNA from the homogenates was isolated
using Tripure Isolation Reagent (Roche) according to the
manufacturer’s instructions. The RT reagent (Shinegene,
Nanoscale Res Lett (2009) 4:1275–1285 1277
123
China) of 30 lL was prepared by mixing 15 lLof29 RT
buffer, 1 lL random primer in a concentration of
100 pmol lL
-1
,1 lL of RTase, 5 lL RNA, and 8 lL DEPC
water together. The reaction condition was 25 °C for 10 min,
40 °C for 60 min, and 70 °C for 10 min.
Synthesized cDNA was used for the real-time PCR.
Primers were designed using Primer Express Software
according to the software guidelines.
The primer sequence is: Mnfkb1f: CATCCAACCTG
AAAATCGTGAG, Mnfkb1r: CCCCAAATCCTTCCCA
AACT, 156 bp; mil1bf: AAGTTGACGGACCCCAAA
AG, mil1br: TGAGTGATACTGCCTGCCTGA, 129 bp;
mtnff: TACTGAACTTCGGGGTGATCG, mtnfr: CCAC
TTGGTGGTTTGCTACG, 156 bp; mil4f:TGTAGGGCTT
CCAAGGTGCT, mil4r: TGATGCTCTTTAGGCTTTC
CAG, 199 bp; mil6f: GTTGCCTTCTTGGGACTGATG,
mil6r: ACTCTTTTCTCATTTCCACGATTT, 172 bp; mil10f:
TGGACAACATACTGCTAACCGAC, mil10r: CCTGGGG
CATCACTTCTACC, 111 bp; mcrpf: GCGGAAAAGTCTG-
CACAAGG, mcrpr:GGAGATAGCACAAAGTCCCACAT,
153 bp; mmiff: CCATGCCTATGTTCATCGTGA, mmifr:
ATCGTTCGTGCCGCTAAAAG, 167 bp; m actin f:GAGA-
CCTTCAACACCCCAGC, m actin r: ATGTCACGCACGAT
TTCCC, 263 bp.
All primers were purchased from Shinegene. For the
50 lL PCR reaction, 25 lL29 PCR buffer, 0.6 lL29
primers (25 pmol lL
-1
), 0.3 lL probe (25 pmol lL
-1
),
1 lL cDNA, and 22.8 lL DEPC water (Sigma) were
mixed together. The parameters for a two-step PCR were
94 °C for 3 min, 94 °C for 20 s, 60 °C for 20 s, then 72 °C
for 20 s, 35 cycles.
The gene expression analysis and experimental system
evaluation were performed according to the standard curve
and quantitation reports.
To determine NF-jB, MIF, TNF-a, IL-6, IL-1b, CRP,
IL-4, and IL-10 levels of the plasma, enzyme linked
immunosorbent assay (ELISA) was performed by using
commercial kits that are selective for mouse NF-jB, MIF,
TNF-a, IL-6, IL-1b, CRP, ILIL-4, and IL-10 (Biological
Marker Laboratory, Inc., USA). Manufacturer’s instruction
was followed. The absorbance was measured on a micro-
plate reader at 450 nm (Varioskan Flash, Thermo Electron,
Finland) and the NF-jB, MIF, TNF-a, IL-6, IL-1b, CRP,
IL-4, and IL-10 concentration of samples were calculated
from a standard curve.
Statistical Analysis
Statistical analyses were done using SPSS11.5 software.
Data were expressed as means ± SD. One-way analysis
of variance (ANOVA) was carried out to compare the
differences of means among multi-group data. Dunnett’s
test was carried out when each group of experimental data
was compared with solvent-control data. Statistical sig-
nificance for all tests was judged at a probability level
of 0.05.
Results
The Enhancement of Body Weight and the Coefficients
of Liver
After 14 days, the mice were weighed, various organs were
collected and they were also weighed. Table 1 shows the
coefficients of the liver to body weight which were expressed
as milligrams (wet weight of tissues)/grams (body weight).
No obvious differences were found in the body weight of
seven groups. The significant differences were not observed
in the coefficient of the liver in the 5 and 10 mg/kg BW nano-
anatase TiO
2
-treated groups (p [ 0.05). However, the
coefficients of the liver in the 50, 100, and 150 mg/kg BW
nano-anatase TiO
2
-treated groups and 150 mg/kg BW bulk
TiO
2
-treated group were significantly higher (p \ 0.05 or
0.01) than the control, suggesting that higher dose nano-
anatase TiO
2
and bulk TiO
2
might cause the damage of the
liver of mice.
Titanium Contents in Liver and Liver DNA
The contents of titanium in liver and the purified DNA from
liver of mice during 14 days daily injection of various doses
nano-anatase TiO
2
and 150 mg/kg BW bulk TiO
2
are shown
in Fig. 2. With increasing injection dose of nano-anatase
Table 1 The increase of net weight and coefficients of liver of mouse after intraperitoneal injection with nano-anatase TiO
2
suspensions for
consecutive 14 days
Indexes Nano-anatase (mg/kg BW) Bulk (mg/kg BW)
0 5 10 50 100 150 150
Net increase of BW (g) 7.35 ± 0.37 8.08 ± 0.40 7.82 ± 0.39 7.66 ± 0.38 7.27 ± 0.36 7.18 ± 0.36 7.36 ± 0.37
Liver/BW (mg/g) 56.81 ± 2.84 56.97 ± 2.85 60.09 ± 3.00 63.68 ± 3.18* 65.88 ± 3.29* 71.16 ± 3.58** 61.87 ± 3.09*
Ranks marked with an asterisk or double asterisks means it is significantly different from the control (no nano-anatase or bulk TiO
2
) at the 5 or
1% confidence level, respectively. Values represent means ± SE, n = 10
1278 Nanoscale Res Lett (2009) 4:1275–1285
123
TiO
2
, the titanium contents in the liver and DNA were sig-
nificantly elevated, this observation suggested that the
accumulation of titanium in the liver and DNA was closely
related to the coefficients of the liver of mice, suggesting
that, after entering the animals, nano-TiO
2
combine with
the biomolecules such as DNA. However, the contents
of titanium of the liver and DNA in 150 mg/kg BW bulk
TiO
2
-treated group were lower than those of 150 mg/kg BW
nano-anatase TiO
2
-treated group (p \0.05), suggesting that
nano-anatase TiO
2
entered the liver of mice and combined
with the DNA more easily than the bulk TiO
2
did.
Assay of Liver Function
The serum biochemical parameters were assayed to further
evaluate the toxicity of nano-anatase TiO
2
on the liver of
mice. Table 2 exhibits the changes of biochemical param-
eters in serum of mice liver after nano-anatase TiO
2
sus-
pension was injected into abdominal cavity for consecutive
14 days. In lower doses (5 and 10 mg/kg BW), there were
no significant changes for all the parameters compared with
the control group (p [0.05). In higher dose of nano-anatase
TiO
2
-treated (50, 100, and 150 mg/kg BW) groups, how-
ever, the activities of ALT, ALP, AST, LDH, PChE, and
LAP were significantly higher than the control group
(p \ 0.05 or 0.01), and the obvious enhancement of ALB,
GLB levels, the reduction of ratio of ALB to GLB, TBIL
levels were observed in comparison with the control group
(p \ 0.05). In the 150 mg/kg BW bulk TiO
2
-treated group,
there were only ALT, ALP, AST, LDH, PChE, and LAP
higher than those of control (p \ 0.05 or 0.01), and the
other parameters had no obvious difference from the control
group (p [ 0.05). The increase of ALT, ALP, AST, LDH,
PChE, and LAP, and the decrease of ratio of ALB to GLB,
TBIL levels which are important indicators of the hepatic
injury, demonstrated that nano-anatase TiO
2
induced
hepatic injury. Furthermore, the increase of enzyme activity
and the decrease of ratio of ALB to GLB, TBIL levels are
dose-dependent, inferring that the induced hepatic injury is
dose-dependent. TG, TCHO, and HDL-C from 100 to
150 mg/kg BW-treated groups were higher than the control
group (p \ 0.05). LDL-C contents from 100 to 150 mg/kg
BW nano-anatase TiO
2
treated groups were lower than the
control group (p \ 0.05). In the 150 mg/kg BW bulk-TiO
2
-
treated group, the contents of THCO and HDL-C were
higher than the control group (p \0.05), but the contents of
TG and LDL-C were not significantly different from the
control group (p [ 0.05). These results indicate that nano-
anatase TiO
2
in higher dose caused metabolism imbalance
of lipids HDL-C and low-density LDL-C in mice liver.
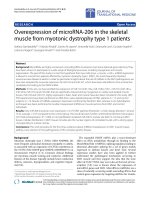
Liver Histopathological Evaluation
The histological photomicrographs of the liver sections are
shown in Fig. 2. In the 5 mg/kg BW nano-anatase TiO
2
-
treated group, the liver tissue had no abnormal pathology
changes compared with the control. In the 100, 150 mg/kg
BW nano-anatase TiO
2
-treated groups and 150 mg/kg BW
bulk TiO
2
-treated group, however, the significant histopa-
thological changes were observed in the liver tissue, for
example, congestion of vascellum and prominent vasodi-
latation were observed in 100 mg/kg BW nano-anatase
TiO
2
-treated group (Fig. 2c), and wide-bound basophilia
and focal ischemia occurred in 150 mg/kg BW nano-
anatase TiO
2
-treated group (Fig. 2d, e), and congestion of
central veins was showed in 150 mg/kg BW bulk TiO
2
-
treated group (Fig. 2f).
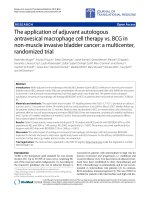
Hepatocyte Evaluation
Ultrastructure of hepatocyte in female mice is shown in
Fig. 3. It was observed that the ultrastructure of hepatocyte
from 5 mg/kg BW nano-anatase TiO
2
-treated group was
similar to the control, but from 100 mg/kg BW nano-
anatase TiO
2
-treated group turned tumescent mitochondria
and vacuolization, and 150 mg/kg BW nano-anatase TiO
2
-
treated group indicated apoptotic body. The results sug-
gested that nano-anatase TiO
2
could damage the structure
of hepatocyte of mice.
Inflammatory Cytokines in Nano-Anatase TiO
2
-Treated
Mice Liver Tissues
The inflammation happened in liver according to the his-
topathological and hepatocyte ultrastructure observations.
To confirm the role of inflammatory cytokine pathway in
Fig. 2 The contents of titanium in liver tissue and liver DNA of
female mouse after intraperitoneal injection with nano-anatase TiO
2
suspensions for consecutive 14 days. Values represent means ± SE,
n = 5. Columns marked with asterisk or double asterisks means it is
significantly different from the control (no nano-anatase or bulk-
TiO
2
) at the 5 or 1% confidence level, respectively
Nanoscale Res Lett (2009) 4:1275–1285 1279
123
Table 2 The changes of biochemical parameters in the blood serum of mouse liver after intraperitoneal injection with nano-anatase TiO
2
suspensions for consecutive 14 days
Indexes Nano-anatase (mg/kg BW) Bulk (mg/kg BW)
0 5 10 50 100 150 150
ALT (U/L) 68.95 ± 3.45 72.66 ± 3.63 86.89 ± 0.34* 99.18 ± 4.96* 106.79 ± 5.34** 129.33 ± 6.47** 89.86 ± 4.49*
ALP (U/L) 208.59 ± 10.43 212.39 ± 10.62 234.72 ± 11.74 256.88 ± 12.84* 282.36 ± 14.12** 329.87 ± 16.49** 228.96 ± 11.45**
AST (U/L) 199.73 ± 9.99 210.47 ± 10.52 236.68 ± 11.83 268.92 ± 13.45** 297.55 ± 14.88** 345.88 ± 17.29** 246.78 ± 12.34**
LDH (U/L) 1,520 ± 76 1,623 ± 84 1,897 ± 95 2,318 ± 116* 2,689 ± 134** 2,949 ± 147** 2,309 ± 115*
PChE (U/L) 1,169 ± 58 1,297 ± 65 1,409 ± 70 1,696 ± 85* 1,988 ± 99** 2,597 ± 130** 1,647 ± 82*
LAP (U/L) 43.76 ± 2.19 47.25 ± 2.36 50.28 ± 2.51 56.81 ± 2.84* 60.19 ± 3.01* 63.66 ± 3.18* 52.72 ± 2.64*
TP (g/L) 60.15 ± 3.01 61.06 ± 3.05 62.59 ± 3.13 65.34
± 3.27* 69.23 ± 3.46* 72.85 ± 3.64* 62.06 ± 3.10
ALB (g/L) 34.22 ± 1.71 34.30 ± 1.72 34.79 ± 1.74 35.92 ± 1.80 37.23 ± 1.86* 38.92 ± 1.95* 34.34 ± 1.72
GLB (g/L) 24.55 ± 1.23 24.98 ± 1.25 26.15 ± 1.31 27.44 ± 1.37* 30.15 ± 1.51* 33.57 ± 1.68** 25.05 ± 1.25
ALB/GLB 1.39 1.37 1.33 1.31* 1.24* 1.16** 1.37
TBIL (lmol/L) 1.35 ± 0.07 1.33 ± 0.07 1.29 ± 0.06 1.22 ± 0.06* 1.19 ± 0.06* 1.15 ± 0.06* 1.30 ± 0.06
TG (mmol/L) 1.66 ± 0.08 1.68 ± 0.08 1.72 ± 0.09 1.83 ± 0.09* 2.07 ± 0.10* 2.25 ± 0.11** 1.79 ± 0.09
TCHO (mmol/L) 3.19 ± 0.16 3.14 ± 0.16 3.21 ± 0.16 3.29 ± 0.16 3.51 ± 0.18* 3.66 ± 0.18* 3.57 ± 0.18*
HDLC (mmol/L) 2.86 ± 0.14 2.83 ± 0.14 2.91 ± 0.14 3.01 ± 0.15 3.34 ± 0.17* 3.52 ± 0.18* 3.36 ± 0.17*
LDLC (mmol/L) 0.26
± 0.01 0.25 ± 0.01 0.22 ± 0.01 0.17 ± 0.01* 0.15 ± 0.01* 0.12 ± 0.01* 0.19 ± 0.01
Ranks marked with an asterisk or double asterisks means it is significantly different from the control (no nano-anatase or bulk TiO
2
) at the 5 or 1% confidence level, respectively. Values
represent mean ± SE, n = 5
1280 Nanoscale Res Lett (2009) 4:1275–1285
123
nano-anatase TiO
2
-induced liver injury, real-time quanti-
tative RT-PCR, and ELISA were used to demonstrate
inflammatory cytokines (such as NF-jB, MIF, IL-6, IL-1b,
CRP, TNF-a, IL-4, and IL-10) induction in nano-anatase
TiO
2
-treated mice.
Real-time quantitative RT-PCR analysis showed that
NF-jB, MIF, IL-1b, IL-6, CRP, TNF-a, IL-4, and IL-10
were significantly up-regulated in the liver tissues of mice
treated with nano-anatase TiO
2
for consecutive 14 days
(p \ 0.05 or 0.01). The 150 mg/kg BW bulk TiO
2
micro-
particles (micro TiO
2
) had less effect on induction of these
genes compared with 150 mg/kg BW nano-anatase TiO
2
particles (Table 3).
The nano-anatase TiO
2
-induced inflammatory cytokine
expression was also examined at the protein level after
intraperitoneal injection with various doses of nano-anatase
TiO
2
suspensions for consecutive 14 days (Fig. 4). ELISA
analysis showed that nano-anatase TiO
2
caused significant
induction of serum levels of NF-jB, MIF, IL-6, IL-1b,
CRP, TNF-a, IL-4, and IL-10 protein in a dose-dependent
manner (Table 4, p \ 0.05 or 0.01), which might be pro-
duced mainly by infiltrating macrophages and some liver
epithelial cells.
The results mentioned earlier are consistent with that the
histological photomicrograph and hepatocyte ultrastructure
of the liver sections was observed in the treated mice. The
inflammation is able to induce an increase of the expression
level of inflammatory cytokines by nano-anatase TiO
2
.
Discussion
The results of this study indicate that intraperitoneal injec-
tion of higher doses of nano-anatase TiO
2
can increase
coefficients of the liver, and its significant accumulation in
the mouse liver can induce histopathological changes of
liver, including congestion of vascellum, prominent vaso-
dilatation, wide-bound basophilia and focal ischemia,
hepatocyte tumescent mitochondria, vacuolization and
apoptosis, thus leading to the damage of liver function.
Fig. 3 Histopathology of the
liver tissue (9100 or 9200) in
female mice after
intraperitoneal injection with
various doses of nano-anatase
TiO
2
suspensions for
consecutive 14 days. a Control
(9100): hepatocyte array is
complete; b 5 mg/kg BW nano-
anatase TiO
2
(9100):
hepatocyte is normal, sinus
hepaticus is complete,
vascellum is normal;
c 100 mg/kg BW nano-anatase
TiO
2
(9100): Arrows indicate
congestion of vascellum and
prominent vasodilatation; d
150 mg/kg BW nano-anatase
TiO
2
(9200): Arrows indicate
wide-bound basophilia; e
150 mg/kg BW nano-anatase
TiO
2
(9200): Arrows indicate
focal ischemia; f 150 mg/kg
BW bulk TiO
2
(9100): Arrows
indicate congestion of central
veins
Nanoscale Res Lett (2009) 4:1275–1285 1281
123
Wang et al. [8] observed that the hydropic degeneration
around the central vein was prominent and the spotty
necrosis of hepatocyte in the liver tissue of female mice
post-exposure 2 weeks to the 5 g/kg BW 80 nm and fine
TiO
2
particles, but did not observed significant histopa-
thological change in liver tissues of mice exposed to the 5 g/
kg BW 25 nm TiO
2
particles. The present study indicates
that the hepatitis of mice is triggered by nano-anatase TiO
2
activation of inflammatory cytokines that resulted in dis-
ruption of liver tissue, and hepatocyte injury and apoptosis.
Alkaline phosphatase is mainly distributed in the liver,
bone, and in bile duct, and ALT and AST exist in the liver,
heart, and other organs. When the organs injured, the
activities of ALP, ALT, and AST in serum would increase. It
is well known that LDH is an important isoenzyme in gly-
colysis and glyconeogenesis and widely exists in the heart,
liver, lung, and many other tissues. When the tissues are
subjected to injury, LDH would leak into the serum of blood
from organs or cells, which resulted in the increase of LDH
activity and its isoenzyme in the corresponding organs.
Pseudocholinesterase (PChE, acylcholine acyl hydrolase)
has been found in many animal tissues, and it may function
in the metabolism of lipids and low-density lipoprotein.
When the liver is subjected to injury, PChE activity is sig-
nificantly elevated, thus leading to the damage of the
metabolism of lipids and low-density lipoprotein. In order to
further study the biochemical mechanism of nano-anatase
TiO
2
particles, the parameters for the damages of the liver
function, and lipid contents in the blood were determined.
The results showed that, in the 50, 100, and 150 mg/kg BW
nano-anatase TiO
2
-treated groups, the parameters for
hepatic function including ALT, ALP, AST, LDH, LAP,
PChE, TP, ALB, GLB, TBIL, TG, TCHO, and HDL-C
increased greatly and LDL-C decreased significantly in
blood (p \ 0.05 or 0.01). However, the parameters men-
tioned earlier from the 5 and 10 mg/kg BW nano-anatase
Table 3 Effects of nano-TiO
2
on the amplification of cytokine mRNA of mouse by real-time PCR analysis after intraperitoneal injection with
nano-anatase TiO
2
suspensions for consecutive 14 days
Cytokine Nano-anatase (mg/kg BW)
0 50 100 150 150-bulk
Refer-actin Ct 21.035 19.93 21.4249 21.8257 21.038
Copies 2.68E?07 5.64E?07 2.06E?07 1.57E?07 2.68E?07
nf-jb Ct 23.144 21.7009 22.4526 22.2415 23.0754
Relative copies 6.47E?06 1.71E?07 1.02E?07 1.19E?07 6.78E?06
Ratio of nf-jb/actin 0.242 ± 0.012 0.303 ± 0.015* 0.497 ± 0.025** 0.756 ± 0.038** 0.253 ± 0.013
mif Ct 22.4026 21.7153 21.5595 21.5625 20.5766
Relative copies 1.07E?07 1.70E?07 1.88E?07 1.88E?07 3.65E?07
Ratio of mif/actin 0.398 ± 0.020 0.634 ± 0.032** 0.913 ± 0.046** 1.194 ± 0.060** 0.647 ± 0.032**
il-1b Ct 24.2684 22.911 20.9252 22.2075 24.0418
Relative copies 3.04E?06 7.57E?06 2.89E?07 1.22E?07 3.54E?06
Ratio of il-1b/actin 0.113 ± 0.006 0.481 ± 0.024** 0.511 ± 0.026** 0.590 ± 0.030** 0.132 ± 0.007*
il-6 Ct 25.076 22.6692 23.3343 22.8735 23.4873
Relative copies 1.76E?06 8.9lE?06 5.70E?06 7.77E?06 5.14E?06
Ratio of il-6/actin 0.066 ± 0.003 0.158 ± 0.008** 0.276 ± 0.014** 0.494 ± 0.025** 0.192 ± 0.010**
crp Ct 23.9738 21.7188 23.152 22.907 23.0768
Relative copies 3.70E?05 1.69E?07 6.44E?06 7.59E?06 6.77E?06
Ratio of crp/actin 0.138 ± 0.007 0.300 ± 0.015** 0.312 ± 0.016** 0.482 ± 0.024** 0.253 ± 0.013**
tnf Ct 28.674 28.8403 28.659 28.3492 28.7297
Relative copies 1.56E?05 1.39E?05 1.58E?05 1.94E?05 1.50E?05
Ratio of tnf/actin 0.028 ± 0.001 0.052 ± 0.003** 0.076 ± 0.004** 0.123 ± 0.006** 0.056 ± 0.003
il-4 Ct 23.7878 22.2796 21.1993 21.3352 22.906
Relative copies 4.20E?06 1.16E?07 2.40E?07 2.19E?07 7.60E?06
Ratio of il-4/actin 0.157 ± 0.008 0.205 ± 0.010** 0.895 ± 0.045** 1.392 ± 0.070** 0.369 ±
0.018**
p-10 Ct 28.5199 27.022 28.6367 28.1555 28.169
Relative copies 173E?05 4.75E?05 1.60E?05 2.21E?05 2.19E?05
Ratio of p-10/actin 0.065 ± 0.003 0.084 ± 0.004* 0.102 ± 0.005** 0.107 ± 0.005** 0.082 ± 0.004*
Ranks marked with an asterisk or double asterisks means it is significantly different from the control (no nano-anatase or bulk TiO
2
) at the 5 or
1% confidence level, respectively. Values represent mean ± SE, n = 5
1282 Nanoscale Res Lett (2009) 4:1275–1285
123
TiO
2
-treated groups were not significantly different from
the control group. The results are consistent with histopa-
thological changes of liver and the damage of hepatocyte
substructure and with our previous report [12]. Wang et al.
[8] showed that after a single oral gavage of dose of 5 g/kg
BW of TiO
2
suspensions (25 and 80 nm), ALT, LDH, and
TBIL in serum had statistical significance compared with
the control mice.
Our studies showed that the obvious titanium accumu-
lation in the liver and liver DNA of mice was observed.
The accumulation of titanium is consistent with the coef-
ficients of liver and the liver injury of mice. In addition, the
accumulation of titanium of the organs in 150 mg/kg BW
nano-anatase TiO
2
-treated group was higher than those of
150 mg/kg BW bulk-TiO
2
-treated group (p \ 0.05).
Compared with bulk TiO
2
, smaller grain size of nano-
Fig. 4 Ultrastructure of hepatocyte (98,000 or 910,000) in female
mice after intraperitoneal injection with various doses of nano-anatase
TiO
2
suspensions for consecutive 14 days. a Control (98,000):
chromatin is well distributed, mitochondria turn round or oval and
complete; b 5 mg/kg BW nano-anatase TiO
2
(98,000): hepatocyte
indicates normal; c 100 mg/kg BW nano-anatase TiO
2
(910,000);
arrows indicate tumescent mitochondria and vacuolization; d
150 mg/kg BW nano-anatase TiO
2
(910,000): apoptotic cell or
apoptotic body is observed
Table 4 Effects of nano-Tio
2
on the cytokine protein level of mice by ELISA analysis after intraperitoneal injection with nano-anatase TiO
2
suspensions for consecutive 14 days
Nano-anatase
(mg/kg BW)
NF-jB
(ng/mL)
MIF
(pg/mL)
IL-1b
(pg/mL)
IL-6
(pg/mL)
CRP
(ng/mL)
TNF-a
(pg/mL)
IL-4
(pg/mL)
IL-10
(pg/mL)
0 1,819 ± 91 1,157 ± 58 482 ± 24 179 ± 9 103 ± 5 156 ± 8 1,079 ± 54 615 ± 31
5 2,434 ± 122* 1,341 ± 67* 599 ± 30* 202 ± 10* 153 ± 8** 190 ± 10** 1,216 ± 61* 773 ± 39*
10 3,852 ± 193** 1,529 ± 76** 669 ± 34** 303 ± 15** 204 ± 0** 226 ± 11** 1,304 ± 65* 1,617 ± 81**
50 4,511 ± 226** 1,789 ± 89** 736 ± 37** 422 ± 21** 266 ± 13** 294 ± 15** 1,399 ± 70* 1,869 ± 94**
100 5,738 ± 287** 2,326 ± 116** 848 ± 42** 541 ± 27** 327 ±
16** 346 ± 17** 1,490 ± 75** 2,081 ± 104**
150 6,819 ± 341** 3,098 ± 155** 979 ± 49** 699 ± 35** 428 ± 21** 596 ± 30** 1,717 ± 86** 2,403 ± 120**
150-bulk 3,838 ± 192** 1,401 ± 70* 612 ± 31* 391 ± 20** 175 ± 9** 202 ± 10** 1,330 ± 67* 1,027 ± 51*
Ranks marked with a an asterisk or double asterisks means it is significantly different from the control (no nano-anatase or bulk TiO
2
) at the 5 or
1% confidence level, respectively. Values represent mean ± SE, n = 5
Nanoscale Res Lett (2009) 4:1275–1285 1283
123
anatase TiO
2
(5 nm) would allow easier entry to mouse
cells and its higher surface makes its intake to the liver and
bound to liver DNA of mice easier. Combination of both
resulted in the enhancement of the titanium in the liver and
DNA. It implies that nano-TiO
2
particles, which are similar
to hepatovirus, can enter liver cells or nuclei and bind to
DNA, thus might cause the changes of genetic information
transfer and the inflammatory cascade.
It is well known that the hepatitis pathogenesy is that
hepatocytes generate various immunopathogenesis injuries,
including cellular and humoral immunity. However, he-
patovirus itself does not directly damage hepatocytes, some
cytokines induced by hepatovirus play important roles in
inflammatory responses. Transcription factor NF-jBisa
critical intracellular mediator of the inflammatory cascade.
In quiescent cells, NF-jB is bound to inhibitory proteins
called IjBs that prevents NF-jB from migrating to the
nucleus and located in the cytoplasm. When an appropriate
inducer, such as hepatovirus, affects the cell, IjBs are
phosphorylated and degraded, allowing nuclear uptake of
NF-jB and initiating gene transcription (such as MIF, the
proinflammatory cytokines of TNF-a, IL-6, IL-1b, CRP,
and anti-inflammatory cytokines of IL-4 and IL-10) [14].
As an inflammatory factor, MIF also plays a role of
inflammatory mediators in various diseases. The liver
toxicity caused by nano-TiO
2
has been reported [8, 12], but
its molecular pathogenesis is not known. In this study, the
real-time quantitative RT-PCR and ELISA analysis showed
that nano-anatase TiO
2
can significantly stimulate the
mRNA expressions and increase protein levels of several
inflammatory cytokines, including NF-jB, MIF, TNF-a,
IL-6, IL-1b, CRP, IL-4, and IL-10. The obvious increase of
these cytokines mRNA expression and protein levels
indicated that the inflammatory responses and hepatocyte
apoptosis may be involved in nano-anatase TiO
2
-induced
liver toxicity. It had been demonstrated that nano-TiO
2
could promote the expression of several cytokines and
chemokines in the lung of rat and mice, including placenta
growth factor (PlGF), MCP-1, IL-1b, and TNF-a [6, 20],
and increase protein level of TNF-a, IL-1b in brain of mice
and cause brain inflammation [21, 22]. Here, we speculate
that nano-anatase TiO
2
particles, which are similar to he-
patovirus, can make IjBs phosphorylated and degraded,
and then induce NF-jB activation, leading to the expres-
sion of the NF-jB-controlled proinflammatory cytokines
(such as IL-1b, IL-6) in liver of mice and the inflammatory
response of liver, but the molecular mechanism of inflam-
matory response of mouse liver caused by nano-anatase
TiO
2
needs to be studied in future. Further investigations
are needed to elucidate the potential liver toxicity of dif-
ferent nanoparticles and their pathogenesis.
The present article also demonstrated that bulk-TiO
2
can
elevate coefficients of the liver, be accumulated in liver and
liver DNA of mice, cause histopathological changes of
liver, damage liver function and induce inflammatory
response of liver, but it has less toxicity compared with
150 mg/kg BW nano-anatase TiO
2
particles. Compared
with nano-anatase TiO
2
(5 nm), bulk TiO
2
, would allow
hard entry to mouse cells and its lower surface makes its
intake to the liver of mice hard.
Conclusion
The results of this study add our understanding of nano-
anatase TiO
2
-induced liver toxicity and inflammatory
responses in liver of mice. Both are complicated multi-
factorial disease processes. We suggest that inflammatory
cytokines cascade may cause inflammatory cell chemo-
taxis, and apoptosis, resulting in serious liver injury.
Acknowledgments This work was supported by the National Nat-
ural Science Foundation of China (grant no. 20671067), the Medical
Development Foundation of Soochow University (grant no.
EE120701) and the National Innovation Foundation of Student (grant
no. 57315427, 57315927).
References
1. J.S. Brown, K.L. Zeman, W.D. Bennett, Am. J. Respir. Crit. Care
Med. 166, 1240 (2002)
2. W.G. Kreyling, M. Semmler, F. Erbe, P. Mayer, S. Takenaka,
H. Schulz, G. Oberdorster, A. Ziesenis, J. Toxicol. Environ.
Health A 65, 1513 (2002)
3. G. Oberdoerster, Z. Sharp, V. Atudorei, A. Elder, R. Gelein,
W. Kreyling, C. Cox, Inhal. Toxicol. 16, 437 (2004)
4. G. Oberdo
¨
rster, E. Oberdo
¨
rster, J. Oberdo
¨
rster, Environ. Health
Perspect. 113, 823 (2005)
5. J. Muller, F. Huaux, N. Moreau, P. Misson, J.F. Heilier,
M. Delos, M. Arras, A. Fonseca, J.B. Nagy, D. Lison, Toxicol.
Appl. Pharmacol. 207, 221 (2005)
6. H.W. Chen, S.F. Su, C.T. Chien, W.H. Lin, S.L. Yu, C.C. Chou,
J.W. Chen Jeremy, P.C. Yang, FASEB J. 20, 2393 (2006)
7. T.T. Win-Shwe, D. Mitsushima, S. Yamamoto, A. Fukushima,
T. Funabashi, T. Kobayashi, H. Fujimaki, Toxicol. Appl. Pharm.
226, 192 (2008)
8. J.X. Wang, G.Q. Zhou, C.Y. Chen, H.W. Yu, T.C. Wang, Y.M.
Ma, G. Jia, Y.X. Gao, B. Li, J. Sun, Y.F. Li, F. Jia, Y.L. Zhaso,
Z.F. Chai, Toxicol. Lett. 168, 176 (2007)
9. C.M. Sayes, R. Wahi, P.A. Kurian, Y.P. Liu, J.L. West, K.D.
Ausman, D.B. Warheit, V.L. Colvin, Toxicol. Sci. 92, 174 (2006)
10. F. Afaq, P. Abidi, R. Matin, Q. Rahman, J. Appl. Toxicol. 18, 307
(1998)
11. G. Oberdo
¨
rster, J.N. Finkelstein, C. Johnston, Res. Rep. Health
Eff. Inst. 96, 5 (2000)
12. H.T. Liu, L.L. Ma, J.F. Zhao, J. Liu, J.Y. Yan, J. Ruan,
F.S. Hong, Biol. Trace Element Res. 129(1), 170 (2009)
13. H.T. Liu, L.L. Ma, J.F. Zhao, J. Liu, J.Y. Yan, J. Ruan, F.S.
Hong, Toxicol. Environ. Chem. (2009). doi: 10.1080/0277224
0902732530 (in press)
14. S. Ghosh, M.J. May, E.B. Kopp, Annu. Rev. Immunol. 16, 225
(1998)
1284 Nanoscale Res Lett (2009) 4:1275–1285
123
15. R.R. Zhu, S.L. Wang, J. Chao, D.L. Shi, R. Zhang, X.Y. Sun,
S.D. Yao, Mater. Sci. Eng. C 29, 691 (2009)
16. P. Yang, C. Lu, N. Hua, Y. Du, Mater. Lett. 57, 794 (2002)
17. K.J. Livak, T.D. Schmittgen, Methods 25, 402 (2001)
18. L.D. Ke, Z.A. Chen, Mol. Cell. Probes 14(2), 127 (2000)
19. W.H. Liu, A. David, Biochem. Biophys. Res. Commun. 294, 347
(2002)
20. D. Hohr, Y. Steinfartz, R.P. Schins, A.M. Knaapen, G. Martra,
B. Fubini, P.J. Bor, Int. J. Hyg. Environ. Health 205, 239 (2002)
21. J.X. Wang, Y. Liu, F. Jiao, F. Lao, W. Li, Y.Q. Gu, Y.F. Li,
C.C. Ge, G.Q.B. Zhou, Y.L. Zhao, Z.F. Chai, C.Y. Chen, Toxi-
cology 254, 82 (2008)
22. J.X. Wang, C.Y. Chen, Y. Liu, F. Jiao, W. Li, F. Lao, Y.F. Li,
B. Li, Y.Q. Gu, C.C. Ge, G.Q. Zhou, Y.X. Gao, Y.L. Zhao,
Z.F. Chai, Toxicol. Lett. 183, 72 (2008)
Nanoscale Res Lett (2009) 4:1275–1285 1285
123