Báo cáo hóa học: " Research Article Robust and Scalable Transmission of Arbitrary 3D Models over Wireless Networks" potx
Bạn đang xem bản rút gọn của tài liệu. Xem và tải ngay bản đầy đủ của tài liệu tại đây (2.3 MB, 30 trang )
Hindawi Publishing Corporation
EURASIP Journal on Image and Video Processing
Volume 2008, Article ID 824726, 30 pages
doi:10.1155/2008/824726
Research Article
A Review and Comparison of Measures for
Automatic Video Surveillance Systems
Axel Baumann, Marco Boltz, Julia Ebling, Matthias Koenig, Hartmut S. Loos, Marcel Merkel,
Wolfgang Niem, Jan Karl Warzelhan, and Jie Yu
Corporate Research, Robert Bos ch GmbH, D-70049 Stuttgart, Germany
Correspondence should be addressed to Julia Ebling,
Received 30 October 2007; Revised 28 February 2008; Accepted 12 June 2008
Recommended by Andrea Cavallaro
Today’s video surveillance systems are increasingly equipped with video content analysis for a great variety of applications.
However, reliability and robustness of video content analysis algorithms remain an issue. They have to be measured against
ground truth data in order to quantify the performance and advancements of new algorithms. Therefore, a variety of measures
have been proposed in the literature, but there has neither been a systematic overview nor an evaluation of measures for
specific video analysis tasks yet. This paper provides a systematic review of measures and compares their effectiveness for specific
aspects, such as segmentation, tracking, and event detection. Focus is drawn on details like normalization issues, robustness, and
representativeness. A software framework is introduced for continuously evaluating and documenting the performance of video
surveillance systems. Based on many years of experience, a new set of representative measures is proposed as a fundamental part
of an evaluation framework.
Copyright © 2008 Axel Baumann et al. This is an open access article distributed under the Creative Commons Attribution License,
which permits unrestricted use, distribution, and reproduction in any medium, provided the original work is properly cited.
1. INTRODUCTION
The installation of videosurveillance systems is driven by the
need to protect privateproperties, and by crime prevention,
detection, and prosecution, particularly for terrorism in
public places. However, the effectiveness of surveillance
systems is still disputed [1]. One effect which is thereby often
mentioned is that of crime dislocation. Another problem is
that the rate of crime detection using surveillance systems is
not known. However, they have become increasingly useful
in the analysis and prosecution of known crimes.
Surveillance systems operate 24 hours a day, 7 days a
week. Due to the large number of cameras which have to
be monitored at large sites, for example, industrial plants,
airports, and shopping areas, the amount of information to
be processed makes surveillance a tedious job for the security
personnel [1]. Furthermore, since most of the time video
streams show ordinary behavior, the operator may become
inattentive, resulting in missing events.
In the last few years, a large number of automatic real-
time video surveillance systems have been proposed in the
literature [2]aswellasdevelopedandsoldbycompanies.
The idea is to automatically analyze video streams and alert
operators of potentially relevant security events. However,
the robustness of these algorithms as well as their perfor-
mance is difficult to judge. When algorithms produce too
many errors, they will be ignored by the operator, or even
distract the operator from important events.
During the last few years, several performance evaluation
projects for video surveillance systems have been undertaken
[3–9], each with different intentions. CAVIAR [3] addresses
city center surveillance and retail applications. VACE [9]
has a wide spectrum including the processing of meeting
videos and broadcasting news. PETS workshops [8]focus
on advanced algorithms and evaluation tasks like multiple
object detection and event recognition. CLEAR [4] deals with
people tracking and identification as well as pose estimation
and face tracking while CREDS workshops [5]focusonevent
detection for public transportation security issues. ETISEO
[6] studies the dependence between video characteristics
and segmentation, tracking and event detection algorithms,
whereas i-LIDS [7] is the benchmark system used by the UK
Government for different scenarios like abandoned baggage,
parked vehicle, doorway surveillance, and sterile zones.
2 EURASIP Journal on Image and Video Processing
Decisions on whether any particular automatic video
surveillance system ought to be bought; objective quality
measures, such as a false alarm rate, are required. This is
important for having confidence in the system, and to decide
whether it is worthwhile to use such a system. For the design
and comparison of these algorithms, on the other hand, a
more detailed analysis of the behavior is needed to facilitate
a feeling of the advantages and shortcomings of different
approaches. In this case, it is essential to understand the
different measures and their properties.
Over the last years, many different measures have been
proposed for different tasks; see, for example, [10–15].
Inthispaper,asystematicoverviewandevaluationof
these measures is given. Furthermore, new measures are
introduced, and details like normalization issues, robust-
ness, and representativeness are examined. Concerning the
significance of the measures, other issues like the choice
and representativeness of the database used to generate the
measures have to be considered as well [16].
In Section 2, ground truth generation and the choice of
the benchmark data sets in the literature are discussed. A
software framework to continuously evaluate and document
the performance of video surveillance algorithms using the
proposed measures is presented in Section 3.Thesurveyof
the measures can be found in Section 4 and their evaluation
in Section 5, finishing with some concluding remarks in
Section 6.
2. RELATED WORK
Evaluating performance of video surveillance systems
requires a comparison of the algorithm results (ARs)with
“optimal” results which are usually called ground truth
(GT). Before the facets of GT generation are discussed
(Section 2.2), a strategy which does not require GT is
put forward (Section 2.1). The choice of video sequences
on which the surveillance algorithms are evaluated has a
large influence on the results. Therefore, the effects and
peculiarities of the choice of the benchmark data set are
discussed in Section 2.3.
2.1. Evaluation without ground truth
Erdem et al. [17] applied color and motion features instead
of GT. They have to make several assumptions such as object
boundaries always coinciding with color boundaries. Fur-
thermore, the background has to be completely stationary or
moving globally. All these assumptions are violated in many
real world scenarios, however, the tedious generation of GT
becomes redundant. The authors state that measures based
on their approach produce comparable results to GT-based
measures.
2.2. Ground truth
The requirements and necessary preparations to generate GT
are discussed in the following subsections. In Section 2.2.1,
file formats for GT data are presented. Different GT gen-
eration techniques are compared in Section 2.2.2,whereas
Section 2.2.3 introduces GT annotation tools.
2.2.1. File formats
For the task of performance evaluation, file formats for GT
data are not essential in general but a common standardized
file format has strong benefits. For instance, these include
the simple exchange of GT data between different groups
and easyintegration. A standard file format reduces the effort
required to compare different algorithms and to generate GT
data. Doubtlessly, a diversity of custom file formats exists
among research groups and the industry. Many file formats
in the literature are based on XML. The computer vision
markup language (CVML) has been introduced by List and
Fisher [18] including platform independent implementa-
tions. The PETS metric project [19]providesitsownXML
format which is used in the PETS workshops and challenges.
The ViPER toolkit [20] employs another XML-based file
format. A common, standardized, widely used file format
definition providing a variety of requirements in the near
future are doubtful as every evaluation program in the past
introduced new formats and tools.
2.2.2. Ground truth generation
A vital step prior to the generation of GT is the defini-
tion of annotation rules. Assumptions about the expected
observations have to be made, for instance, how long does
luggage have to be left unattended before an unattended
luggage event is raised. This event might, for example, be
raised as soon as the distance between luggage and person
in question reaches a certain limit, or when the person who
left the baggage leaves the scene and does not return for at
least sixty seconds. ETISEO [6]andPETS[8]havemadetheir
particular definitions available on their websites. As with
file formats, a common annotation rule definition does not
exist. This complicates the performance evaluation between
algorithms of different groups.
Three types of different approaches are described in the
literature to generate GT. Semiautomatic GT generation
is proposed by Black et al. [11]. They incorporate the
video surveillance system to generate the GT.Onlytracks
with low object activity, as might be taken from recordings
during weekends, are used. These tracks are checked for
path, color, and shape coherence. Poor quality tracks are
removed. The accepted tracks build the basis of a video
subset which is used in the evaluation. Complex situations
such as dynamic occlusions, abandoned objects, and other
real-world scenarios are not covered by this approach. Ellis
[21] suggests the use of synthetic image sequences. GT
would then be known a priori, and tedious manual labeling
is avoidable. Recently, Taylor et al. [22]proposeafreely
usable extension of a game engine to generate synthetic
video sequences including pixel accurate GT data. Models
for radial lens distortion, controllable pixel noise levels, and
video ghosting are some of the features of the proposed
system. Unfortunately, even the implementation of a simple
screenplay requires an expert in level design and takes a lot
Axel Baumann et al. 3
of time. Furthermore, the applicability of such sequences to
real-world scenarios is unknown. A system which works well
on synthetic data does not necessarily work equally well on
real-world scenarios.
Due to the limitations of the previously discussed
approaches, the common approach is the tedious labor-
intensive manual labeling of every frame. While this task
can be done relatively quickly for events, a pixel accurate
object mask for every frame is simply not feasible for
complete sequences. A common consideration is to label
on a bounding box level. Pixel accurate labeling is done
only for predefined frames, like every 60th frame. Young
and Ferryman [13] state that different individuals produce
different GT data of the same video. To overcome this
limitation, they suggest to let multiple humans label the
same sequence and use the “average” of their results as
GT. Another approach is labeling the boundaries of object
masks as an own category and exclude this category in the
evaluation [23]. List et al. [24] let three humans annotate
the same sequence and compared the result. About 95%
of the data matched. It is therefore unrealistic to demand
a perfect match between GT and AR. The authors suggest
that when more than 95% of the areas overlap, then the
algorithm should be considered to have succeeded. Higher
level ground truth like events can either be labeled manually,
or be inferred from a lower level like frame-based labeling of
object bounding boxes.
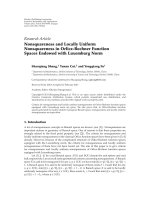
2.2.3. Ground truth annotation tools
A variety of annotation tools exist to generate GT data
manually. Commonly used and freely available is the ViPER-
GT [20] tool (see Figure 1), which has been used, for
example, in the ETISEO [6] and the VACE [9] projects. The
CAVIAR project [3] used an annotation tool based on the
AviTrack [25] project. This tool has been adapted for the
PETS metrics [19]. The ODViS project [26] provides its own
GT tool. All of the above-mentioned GT annotation tools
are designed to label on a bounding box basis and provide
support to label events. However, they do not allow the user
to label the data at a pixel-accurate level.
2.3. Benchmark data set
Applying an algorithm to different sequences will produce
different performance results. Thus, it is inadequate to
evaluate an algorithm on a single arbitrary sequence. The
choice of the sequence set is very important for the meaning-
ful evaluation of the algorithm performance. Performance
evaluation projects for video surveillance systems [3–9]
therefore provide a benchmark set of annotated video
sequences. However, the results of the evaluation still depend
heavily on the chosen benchmark data set.
The requirements of the video processing algorithms
depend heavily on the type of scene to be processed.
Examples for different scenarios range from sterile zones
including fence monitoring, doorway surveillance, parking
vehicle detection, theft detection, to abandoned baggage
in crowded scenes like public transport stations. For each
Figure 1: Freely available ground truth annotation tool Viper-GT
[20].
of these scenarios, the surveillance algorithms have to be
evaluated separately. Most of the evaluation programs focus
on only a few of these scenarios.
To gain more granularity, the majority of these evaluation
programs [3–5, 8, 9] assign sequences to different levels of
difficulty. However, they do not take the step to declare due
to which video processing problems these difficulty levels
are reached. Examples for challenging situations in video
sequences are a high-noise level, weak contrasts, illumination
changes, shadows, moving branches in the background, the
size and amount of objects in the scene, and different weather
condition. Further insight into the particular advantages and
disadvantages of different video surveillance algorithms is
hindered by not studying these problems separately.
ETISEO [6], on the other hand, also studies the
dependencies between algorithms and video characteristics.
Therefore, they propose an evaluation methodology that
isolates video processing problems [16]. Furthermore, they
define quantitative measures to define the difficulty level of
a video sequence with respect to the given problem. The
highest difficulty level for a single video processing problem
an algorithm can cope with can thus be estimated.
The video sequences used in the evaluations are typically
in the range of a few hundred to some thousand frames. With
a typical frame rate of about 12 frames per second, a sequence
with 10000 frames is approximately 14 minutes long. Com-
paring this to the real-world utilization of the algorithms
which requires 24/7 surveillance including the changes from
day to night, as well as all weather conditions for outdoor
applications, raises the question of how representative the
short sequences used in evaluations really are. This question
is especially important as many algorithms include a learning
phase and continuously learn and update the background to
cope with the changing recording conditions [2]. i-LIDS [7]
is the first evaluation to use long sequences with hours of
recording of realistic scenes for the benchmark data set.
3. EVALUATION FRAMEWORK
To control the development of a video surveillance system,
the effects of changes to the code have to be determined and
4 EURASIP Journal on Image and Video Processing
PC1
master
Data
base
XML
results
HTML
logfiles
Resync sources
Local resync Local resync
Start testenv
Compile Compile
Process data Process data
Consist check Consist check
Calculate measures
PostGreSQL database server
PC2
slave
Data
base
HTML
logfiles
XML
results
HTML-embedded
gnuplot charts
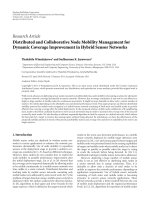
Figure 2: Schematic workflow of the automatic test environment.
GT
CVML input
AR
CVML input
Determination of frame-wise object correspondences
Calculation of frame-wise
measures
Segmentation
Detection
Localization
Classification
Averaging of
frame-wise
measures
Frame-wise
output
Calculation of global
measures
Tracking
Event detection
Alarm
Global output
Figure 3: Workflow of the measure tool. The main steps are
the reading of the data to compare, the determination of the
correspondences between AR and GT objects, the calculation of the
measures, and finally the output of the measure values.
evaluated regularly. Thereby modifications to the software
are of interest as well as changes to the resulting performance.
When changing the code, it has to be checked whether
the software still runs smoothly and stable, and whether
changes of the algorithms had the desired effects to the
performance of the system. If, for example, after changing
the code no changes of the system output are anticipated, this
has to be verified with the resulting output. The algorithm
performance, on the other hand, can be evaluated with the
measures presented in this paper.
As the effects of changes of the system can be quite
different in relation to the processed sequences, preferably a
large number of different sequences should be used for the
examination. The time and effort of conducting numerous
testsforeachcodechangebyhandaremuchtoolarge,
which leads to assigning these tasks to an automatic test
environment (ATE).
In the following subsections, such an evaluation frame-
work is introduced. A detailed system setup is described
in Section 3.1, and the corresponding system work flow is
presented in Section 3.2.InSection 3.3, the computation
framework of the measure calculation can be found. The
preparation and presentation of the resulting values are
outlined in Section 3.4. Figure 2 shows an overview of the
system.
3.1. System setup
The system consists of two computers operating in synchro-
nized work flow: a Windows Server system acting as the
slave system and a Linux system as the master (see Figure 2).
Both systems feature identical hardware components. They
are state-of-the-art workstations with dual quad-core Xeon
processors and 32 GB memory. They are capable of simul-
taneously processing 8 test sequences under full usage of
processing power. The sources are compiled with commonly
used compilers GCC 4.1 on the Linux system and Microsoft
Visual Studio 8 on the Windows system. Both systems are
necessary as the development is either done on Windows
or Linux and thus consistency checks are necessary on both
systems.
Axel Baumann et al. 5
3.2. Work flow
The ATE permanently keeps track of changes to the source
code version management. It checks for code changes and
when these occur, it starts with resyncing all local sources
to their latest versions and compiling the source code. In
the event of compile errors of essential binaries preventing
a complete build of the video surveillance system, all
developers are notified by an email giving information about
the changes and their authors. Starting the compile process
on both systems provides a way of keeping track of compiler-
dependent errors in the code that might not attract attention
when working and developing with only one of the two
systems.
At regular time intervals (usually during the night,
when major code changes have been committed to the
version management system), the master starts the algorithm
performance evaluation process. After all compile tasks
completed successfully, a set of more than 600 video test
sequences including subsets of the CANDELA [27], CAVIAR
[3], CREDS [5], ETISEO [6], i-LIDS [7], and PETS [8]
benchmark data sets is processed by the built binaries on
both systems. All results are stored in a convenient way for
further evaluation.
After all sequences have been processed, the results
of these calculations are evaluated by the measure tool
(Section 3.3). As this tool is part of the source code, it is also
updated and compiled for each ATE process.
3.3. Measure tool
The measure tool compares the results from processing
the test sequences with ground truth data and calculates
measures describing the performance of the algorithm.
Figure 3 shows the workflow. For every sequence, it starts
with reading the CVML [18] files containing the data to
be compared. The next step is the determination of the
correspondences between AR and GT objects, which is
done frame by frame. Based on these correspondences, the
frame-wise measures are calculated and the values stored
in an output file. After processing the whole sequence, the
frame-wise measures are averaged and global measures like
tracking measures are calculated. The resulting sequence-
based measure values are stored in a second output file.
The measure tool calculates about 100 different mea-
sures for each sequence. Taking into account all included
variations, their number raises to approximately 300. The
calculationisdoneforallsequenceswithGT data, which
are approximately 300 at the moment. This results in about
90000 measure values for one ATE run not including the
frame-wise output.
3.4. Preparation and presentation of results
In order to easily access all measure results, which represent
the actual quality of the algorithms, they are stored in a
relational database system. The structured query language
(SQL) is used as it provides very sophisticated ways of
querying complex aspects and correlations between all
measure values associated with sequences and the time they
were created.
In the end, all results and logging information about
success, duration, problems, or errors of the ATE process are
transferred to a local web server that shows all this data in an
easily accessible way including a web form to select complex
parameters to query the SQL database. These parts of the
ATE are scripted processes implemented in Perl.
When selecting query parameters for evaluating mea-
sures, another Perl/CGI-script is being used. Basically, it
compares the results of the current ATE pass with a previ-
ously set reference version which usually represents a certain
point in the development where achievements were made
or an error-free state had been reached. The query provides
an evaluation of results for single selectable measures over a
certain time in the past, visualizing data by plotted graphs
and emphasizing various deviations between current and
reference versions and improvements or deteriorations of
results.
The ATE was build in 2000 and since then, it runs
nightly and whenever the need arises. In the last seven years,
this accumulated to over 2000 runs of the ATE. Started
with only the consistency checks and a small set of metrics
without additional evaluations, the ATE grew to a powerful
tool providing meaningful information presented in a well
arranged way. Lots of new measures and sequences have
been added over time so that new automatic statistical
evaluations to deal with the mass of produced data had to be
integrated. Further information about statistical evaluation
can be found in Section 5.4.
4. METRICS
This section introduces and discusses metrics for a number
of evaluation tasks. First of all, some basic notations and
measure equations are introduced (Section 4.1). Then, the
issue of matching algorithm result objects to ground truth
objects and vice versa is discussed (Section 4.2). Structuring
of the measures themselves is done according to the differ-
ent evaluation tasks like segmentation (Section 4.3), object
detection (Section 4.4), and localization (Section 4.5), track-
ing (Section 4.6), event detection (Section 4.7), object clas-
sification (Section 4.8), 3D object localization (Section 4.9),
and multicamera tracking (Section 4.10). Furthermore, sev-
eral issues and pitfalls of aggregating and averaging measure
values to obtain single representative values are discussed
(Section 4.11).
In addition to metrics described in the literature, custom
variations are also listed, and a selection based on their
usefulness is made. There are several criteria influencing
the choice of metrics to be used, including the use of only
normalized metrics where a value of 0 represents the worst
and a value of 1 the best result. This normalization provides
a chance for unified evaluations.
4.1. Basic notions and notations
Let
GT denote the ground truth and AR the result of the
algorithm. True positives (TPs) relate to elements belonging
6 EURASIP Journal on Image and Video Processing
Table 1: Frequently used notations. (a) basic abbreviations. (b)
indices to distinguish different kinds of result elements. An element
could be a frame, a pixel, an object, a track, or an event. (c) some
examples.
(a) Basic abbreviations
GT Ground truth element
AR Algorithm result element
FP False positive, an element present in AR, but not in GT
FN False negative, an element present in GT, but not in AR
TP True positive, an element present in GT and AR
TN True negative, an element neither present in GT nor AR
# number of
→ Left element assigned to right element
(b) Subscripts to denote different elements
Element Index Used counter
Frame fj
Pixel pk
Object ol
Tr ack t r i
Event em
(c) Examples
#GT
o
Number of objects in ground
truth
#GT
f
Number of frames containing at
least one GT
o
#(GT
tr
→ AR
tr
(i))
Number of GT tracks which are
assigned to the ith AR track
to both GT and AR. False positive (FP) elements are those
which are set in AR but not in GT. False negatives (FNs), on
the other hand, are elements in the GT which are not in the
AR.Truenegatives(TNs) occur neither in the GT nor in the
AR. Please note that while true negative pixels and frames
are well defined, it is not clear what a true negative object,
track, or event should be. Depending on the type of regarded
element—a frame, a pixel, an object, a track, or an event—a
subscript will be added (see Tab le 1 ).
The most common measures precision, sensitivity
(which is also called recall in the literature), and F-score
count the number of TP, FP,andFN.Theyareusedin
small variation for many different tasks and will thus occur
many more times in this paper. For clarity and reference, the
standard formulas are presented here. Note that counts are
represented by a #.
Precision (Prec)
Measures the number of false positives:
Prec
=
#TP
#TP + #FP
. (1)
Sensitivity (Sens)
Measures the number of false negatives. Synonyms in
literature are true positive rate (TPR), recall and hit rate
Sens
=
#TP
#TP + #FN
. (2)
Specificity (Spec)
The number of false detections in relation to the total
number of negatives. Also called true negative rate (TNR)
Spec
=
#TN
#TN + #FP
. (3)
Note that Spec should only be used for pixels or frame
elements as true negatives are not defined otherwise.
False positive rate (FPR)
The number of negative instances that were erroneously
reported as being positive:
FPR
=
#FP
#FP + #TN
= 1 −Spec. (4)
Please note that true negatives are only well defined for pixel
or frame elements.
False negative rate (FNR)
The number positive instances that were erroneously
reported as negative:
FNR
=
#FN
#FN + #TP
= 1 −Sens. (5)
F-Measure
Summarizes Prec and Sens by weighting their effect with the
factor α. This allows the F-Measure to emphasize one of the
two measures depending on the application
F-Measure
=
1
α·(1/Sens) + (1 −α)·(1/Prec)
=
#TP
#TP + α·#FN + (1 −α)·#FP
.
(6)
F-Score
In many applications the Prec and Sens are of equal
importance. In this case, α is set to 0.5 and called F-Score
which is in this case the the harmonic mean of Prec and Sens:
F-Score
=
2·Prec
seg
·Sens
seg
Prec
seg
+Sens
seg
=
#TP
#TP + (1/2)(#FN + #FP)
.
(7)
Usually, systems provide ways to optimize certain aspects
of performance by using an appropriate configuration or
Axel Baumann et al. 7
parameterization. One way to approach such an optimiza-
tion is the receiver operation curve (ROC) optimization [28]
(Figure 4). ROCs graphically interpret the performance of
the decision-making algorithm with regard to the decision
parameter by plotting TPR (also called Sens) against FPR.
Each point on the curve is generated for the range of decision
parameter values. The optimal point is located on the upper
left corner (0, 1) and represents a perfect result.
As Lazarevic-McManus et al. [29] point out, an object-
based performance analysis does not provide essential true
negative objects, and thus ROC optimization cannot be used.
They suggest to use the F-Measure when ROC optimization
is not appropriate.
4.2. Object matching
Many object- and track-based metrics, as will be presented,
for example, in Sections 4.4, 4.5,and4.6, assign AR objects
to specific GT objects. The method and quality used for this
matching greatly influence the results of the metrics based on
these assignments.
In this section, different criteria found in the literature to
fulfill the task of matching AR and GT objects are presented
and compared using some examples. First of all, assignments
based on evaluating the objects centroids are described
in Section 4.2.1, then the object area overlaps and other
matching criteria based on this are presented in Section 4.2.2.
4.2.1. Object matching approach based on centroids
Note that distances are given within the definition of the
centroid-based matching criteria. The criterion itself is
gained by applying a threshold to this distance. When the
distances are not binary, using thresholds involves the usual
problems with choosing the right threshold value. Thus,
the threshold should be stated clearly when talking about
algorithm performance measured based on thresholds.
Let
→
b
GT
be the bounding box of an GT object with
centroid
→
x
GT
and let d
GT
be the length of the bounding box’
diagonal of the GT object. Let
→
b
AR
and
→
x
AR
be the bounding
box and the centroid of an AR object.
Criterion 1. A first criterion is based on the thresholded
Euclidean distance between the object’s centroids, and can
be found for instance in [14, 30]
D
1
=
→
x
GT
−
→
x
AR
. (8)
Criterion 2. A more advanced version is given by normaliz-
ing the diagonal of the GT object’s bounding box:
D
2
=
→
x
GT
−
→
x
AR
d
GT
. (9)
Another method to determine assignments between GT
and AR objects checks if the centroid
→
x
i
of one bounding box
→
b
i
lies inside the other. Based on this idea, different criteria
can be derived.
Criterion 3.
D
3
=
⎧
⎨
⎩
0:
→
x
GT
is inside
→
b
AR
,
1 : else.
(10)
Criterion 4 (e.g., [30]).
D
4
=
⎧
⎨
⎩
0:
→
x
AR
is inside
→
b
GT
,
1 : else.
(11)
Criterion 5.
D
5
=
⎧
⎨
⎩
0:
→
x
GT
is inside
→
b
AR
,or
→
x
AR
is inside
→
b
GT
,
1 : else.
(12)
Criterion 6 (e.g., [30]).
D
6
=
⎧
⎨
⎩
0:
→
x
GT
is inside
→
b
AR
,and
→
x
AR
is inside
→
b
GT
,
1 : else.
(13)
Criterion 7. An advancement of the Criterion 6 uses the
distances d
GT,AR
and d
AR,GT
from the centroid of one object
to the closest point of the bounding box of the other object
[10]. The distance is 0 if Criterion 6 is fulfilled,
D
7
=
⎧
⎪
⎪
⎪
⎨
⎪
⎪
⎪
⎩
0:
→
x
GT
is inside
→
b
AR
,
and
→
x
AR
is inside
→
b
GT
,
min(d
GT,AR
, d
AR,GT
) : else,
(14)
where d
k,l
is the distance from the centroid
→
x
k
to the closest
point of the bounding box
→
b
l
(see Figure 5).
Criterion 8. A criterion similar to Criterion 7 but based on
Criterion 5 instead of Criterion 6:
D
8
=
⎧
⎪
⎪
⎪
⎨
⎪
⎪
⎪
⎩
0:
→
x
GT
is inside
→
b
AR
,
or
→
x
AR
is inside
→
b
GT
,
min(d
GT,AR
, d
AR,GT
) : else.
(15)
Criterion 9. Using the minimal distance affects some draw-
backs, which will be discussed later, we tested another
variation based on Criterion 7, which uses the average of the
two distances:
D
9
=
⎧
⎪
⎪
⎪
⎪
⎨
⎪
⎪
⎪
⎪
⎩
0:
→
x
GT
is inside
→
b
AR
,
and
→
x
AR
is inside
→
b
GT
,
d
GT,AR
+ d
AR,GT
2
: else.
(16)
The above-mentioned methods to perform matching
between GT and AR objects via the centroid’s position are
relatively simple to implement and incur low calculation
costs. Methods using a distance threshold have the disadvan-
tage of being influenced by the image resolution of the video
8 EURASIP Journal on Image and Video Processing
10
False positive rate
1
Tr ue p o si ti ve r a te
OP
1
OP
2
Figure 4: One way to approach an optimization of an algorithm
is the receiver operation curve (ROC) optimization [28, 31].
ROCs graphically interpret the performance of the decision making
algorithm with regard to the decision parameter by plotting TPR
(also called Sens) against FPR. The points OP
1
and OP
2
show two
examples of possible operation points.
−→
b
GT
−→
b
AR
−→
d
AR, GT
−→
d
GT, AR
−→
x
AR
−→
x
GT
−→
b
AR
−→
x
AR
−→
x
GT
−→
b
GT
Figure 5: Bounding box distances
→
d
GT,AR
and
→
d
AR,GT
in two simple
examples. Blue bounding boxes relate to GT, whereas orange
bounding boxes relate to AR. A bounding box is quoted by
→
b
,the
centroid of the bounding box is quoted by
→
x
.
input, if the AR or GT data is not normalized to a specified
resolution. One way to avoid this drawback is to append a
normalization factor as shown in Criterion 2 or to check only
whether a centroid lies inside an area or not. Criteria based
on the distance from the centroid of one object to the edge of
the bounding box of the other object instead of the Euclidean
distance between the centroids have the advantage that there
are no skips in split and merge situations.
However, the biggest drawback of all above-mentioned
criteria is their inability to perform reliable correspondences
between GT and AR objects in complex situations. This
implies undesirable results in split and merge situations
as well as permutations of assignments in case of objects
occluding each other. These problems will be clarified by
means of some examples below. The examples show diverse
constellations of GT and AR objects, where GT objects are
represented by bordered bounding boxes with a cross as
centroid and the AR objects by frameless filled bounding
1
3
4
6
2
5
7
8
9
0
0
0
1
0
0
1
0
0
0
0
2
2
2
0
2
0
2
3
3
1
1
1
3
1
3
1
1
3
4
6
2
5
7
8
9
0
0
1
1
1
0
1
0
1
0
0
2
2
2
0
2
0
2
2
3
0
0
0
3
0
3
0
1
3
4
6
2
5
7
8
9
0
2
0
2
0
0
2
0
2
0
0
0
0
0
0
0
0
0
3
1
3
1
3
3
1
3
1
1
3
4
6
2
5
7
8
9
0
2
0
2
0
0
2
0
2
0
0
0
1
0
0
1
0
1
2
0
2
0
2
2
0
2
0
12 34
TP FN FP TP FN FP TP FN FP TP FN FP
Figure 6: Examples for split and merge situations. The GT object
bounding boxes are shown in blue with a cross at the object
center and the AR in orange with a black dot at the object center.
Depending on the matching Criteria (1–9), different numbers of
TP, FN,andFP are computed for the chosen situations.
boxeswithadotascentroid.Undereachconstellation,atable
lists the numbers of TP, FN,andFP for the different criteria.
Example 1 (see Figure 6) shows a typical merge situation
inwhichagroupofthreeobjectsismergedinoneblob.The
centroid of the middle object exactly matches the centroid
of the AR bounding box. Regarding the corresponding
table, one can see that Criterion 1, Criterion 3, Criterion
5, and Criterion 8 rate all the GT objectsasdetectedand,
in contrast, Criterion 4 and Criterion 6 only the middle.
Criterion 1 would also results in the latter when the distance
from the outer GT centroids to the AR centroid exceeds the
defined threshold. Furthermore, Criterion 7 and Criterion 9
penalize the outer objects, depending on the thresholds, if
they are successful detections.
Example 2 (see Figure 6) represents a similar situation
but with only two objects located in a certain distance from
each other. The AR merges these two GT objects, which could
be caused for example by shadows. Contrary to Example 1,
the middle of the AR bounding box is not covered by a GT
bounding box, so that Criterion 4 and Criterion 6 are not
fulfilled, hence it is penalized with 2 FN and one FP.Note
that the additional FP causes a worse performance measure
than when the AR contained no object.
Problems in split situations follow a similar pattern.
Imagine a scenario such as Example 3 (see Figure 6):avehicle
with 2 trailers appearing as 1 object in GT. But the system
detects 3 separate objects. Or Example 4 (see Figure 6): a
vehicle with only 1 trailer is marked as 2 separate objects. In
these cases, TPs do not represent the number of successfully
detected GT objects as usual, but successfully detected AR
objects.
Thefifthexample(seeFigure 7) shows the scenario of a
car stopping, a person opening the door and getting off the
vehicle. Objects to be detected are therefore the car and the
person. Recorded AR
shows, regarding the car, a bounding
box being slightly too large (due to its shadow), and for the
person a bounding box that stretches too far to the left. This
typically occurs due to the moving car door, which cannot
be separated from the person by the system. This example
demonstrates how, due to identical distance values between
Axel Baumann et al. 9
Figure 7: Example 5: person getting out of a car. The positions of
the object centroids lead to assignment errors as the AR persons
centroid is closer to the centroid of the car in the GT and vice versa.
The GT object bounding boxes are shown in blue with a cross at the
object center and the AR inorangewithablackdotattheobject
center.
GT-AR object combinations, the described methods lack a
decisive factor or even result in misleading distance values.
The latter is the case, for example, Criterion 1 and Criterion
2, because the AR centroid of the car is closer to the centroid
of the GT person, rather than the GT car, and vice versa.
Criterion 3 and Criterion 5 are particularly unsuitable,
because there is no way to distinguish between a comparably
harmless merge and cases where the detector identifies large
sections of the frame as one object due to global illumination
changes. Criterion 4 and Criterion 6 are rather generous
when the AR object covers only fractions of the GT object.
This is because a GT object is rated to be detected as soon as
asmallerAR object (according to the size of the GT object)
covers it.
Figure 8 illustrates the drawback of Criterion 7, Criterion
8, and Criterion 9. This is due to the fact that for the
human eye quality wise different detection results cannot be
distinguished by the given criteria. This leads to problems
especially when multiple objects are located very close to
each other and distances of possible GT/AR combinations
are identical. Figure 8 shows five different patterns of one
GT and one AR object as well as the distance values for
the three chosen criteria. In the table in Figure 8,itcanbe
seen that only Criterion 9 allows a distinct discrimination
between configuration 1 and the other four. Furthermore,
it can be seen that using Criterion 7, configuration 2 gets a
worse distance value than configuration 3. Aside these two
cases, the mentioned criteria are incapable of distinguishing
between the five paradigmatic structures.
The above-mentioned considerations demonstrate the
capability of the centroid-based criteria to represent simple
and quick ways of assigning GT and AR objects to each
other in test sequences with discrete objects. However, in
complex problems such as occlusions or split and merge,
their assignments are rather random. Thus, the content of
the test sequence influences the quality of the evaluation
results. While replacing object assignments has no effect on
the detection performance measures, it impacts strongly on
the tracking measures, which are based on these assignments,
to.
12
34
5
Criterion 1 2 3 4 5
70d
72
0 ≈ 0 ≈ 0
8000
≈ 0 ≈ 0
90d
92
d
93
≈ d
92
d
94
≈ d
93
d
95
≈ d
94
Figure 8: Drawbacks of matching Criterion 7 to Criterion 9.Five
different configurations are shown to demonstrate the behavior of
these criteria. The GT object bounding boxes are shown in blue
with a cross at the object center and the AR in orange with a
black dot at the object center. The distances d
crit,conf
of possible GT-
AR combinations as computed by the Criterion 7 to Criterion 9
are either zero or identical to the distances of the other examples
through these distances are visually different.
A
GT
A
AR
A
GT
A
AR
Figure 9: The area distance computes the overlap of the GT and AR
bounding boxes.
4.2.2. Object matching based on o bject area overlap
A reliable method to determine object assignments is
provided by area distance calculation based on overlapping
bounding box areas (see Figure 9).
Frame detection accuracy (FDA) [32]
Computes the ratio of the spatial intersection between two
objects and their spatial union for one single frame:
FDA
=
overlap(GT, AR)
(1/2)
#GT
o
+#AR
o
, (17)
where again #GT
o
is the number of GT objects for a given
frame (#AR
o
accordingly). The overlap ratio is given by
overlap(GT, AR)
=
#(AR
o
→GT
o
)
l=1
A
GT
(l) ∩A
AR
(l)
A
GT
(l) ∪A
AR
(l)
. (18)
Here, #(AR
o
→ GT
o
) is the number of mapped objects in
frame t, by mapping objects according to their best spatial
overlap (which is a symmetric criterion and thus #(AR
o
→
GT
o
) = #(GT
o
→ AR
o
)), A
GT
is the ground truth object
area and A
AR
is the detected object area by an algorithm
respectively.
10 EURASIP Journal on Image and Video Processing
Overlap ratio thresholded (ORT) [32]
This metric takes into account a required spatial overlap
between the objects. The overlap is defined by a minimal
threshold:
ORT
=
#(AR
o
→GT
o
)
l=1
OT
A
GT
(l),A
AR
(l)
A
GT
(l) ∪A
AR
(l)
,
OT
A
1
, A
2
=
⎧
⎪
⎨
⎪
⎩
A
1
∪A
2
,if
A
1
∩A
2
A
1
≥
threshold,
A
1
∩A
2
, otherwise.
(19)
Again, #(AR
o
→ GT
o
) is the number of mapped objects in
frame t, by mapping objects according to their best spatial
overlap, A
GT
is the ground truth object area and A
AR
is the
detected object area by an algorithm.
Sequence frame detection accuracy (SFDA) [32]
Is a measure that extends the FDA to the whole sequence. It
uses the FDA for all frames and is normalized to the number
of frames where at least one GT or AR object is detected in
order to account for missed objects as well as false alarms:
SFDA
=
#frames
j
=1
FDA(j)
#
frames|
#GT
o
(j) > 0
∨
#AR
o
(j) > 0
.
(20)
In a similar approach, [33] calculates values for recall
and precision and combines them by a harmonic mean in
the F-measure for every pair of GT and AR objects. The
F-measures are then subjected to the thresholding step and
finally leading to false positive and false negative rates. In the
context of the ETISEO benchmarking, Nghiem et al. [34]
tested different formulas for calculating the distance value
and come to the conclusion that the choice of matching
functions does not greatly affect the evaluation results. The
dice coefficient function (D1) is the one chosen, which leads
to the same matching function [33] used by the so-called F-
measure.
First of all, the dice coefficient is calculated for all GT and
AR object combinations:
D1
=
2·#
GT
o
∩AR
o
#GT
o
+#AR
o
. (21)
After thresholding, the assignment commences, in which
no multiple correspondences are allowed. So in case of
multiple overlaps, the best overlap becomes a correspon-
dence, turning unavailable for further assignments. Since this
approach does not feature the above-mentioned drawbacks,
we decided to determine object correspondences via the
overlap.
4.3. Segmentation measures
The segmentation step in a video surveillance system is
critical as its results provide the basis for successive steps
AR
GT
TN
FP
FN
TP
Figure 10: The difference in evaluating pixel accurate or using
object bounding boxes. Left: pixel accurate GT and AR and their
bounding boxes. Right: bounding box-based true positives (TPs),
false positives (FPs), true negatives (TNs), and false negatives (FNs)
are only an approximation of the pixel accurate areas.
and thus influence the performance in subsequent steps.
The evaluation of segmentation quality has been an active
research topic in image processing, and various measures
have been proposed depending on the application of the
segmentation method [35, 36]. In the considered context of
evaluating video surveillance systems, the measures fall into
the category of discrepancy methods [36]whichquantify
differences between an actually segmented (observed) image
and a ground truth. The most common segmentation
measures precision, sensitivity, and specificity consider the
area of overlap between AR and GT segmentation. In [15],
the bounding box areas and not the filled pixel contours
are pixel-wise taken into account to get the numbers of true
positives (TPs), false positives (FPs), and false negatives (FNs)
(see Figure 10) and to define the object area metric (OAM)
measures Prec
OAM
,Sens
OAM
,Spec
OAM
,andF-Score
OAM
.
Precision (Prec
OAM
)
Measures the false positive (FP) pixels which belong to the
bounding boxes of the AR but not to the GT
Prec
OAM
=
#TP
p
#TP
p
+#FP
p
. (22)
Sensitivity (Sens
OAM
)
Evaluates false negative FN pixels which belong to the
bounding boxes of the GT but not to the AR:
Sens
OAM
=
#TP
p
#TP
p
+#FN
p
. (23)
Axel Baumann et al. 11
Specificity (Spec
OAM
)
Considers true negative (TN) pixels, which neither belong to
the AR nortotheGT bounding boxes:
Spec
OAM
=
#TN
p
N
. (24)
N is the number of pixels in the image.
F-Score (F-Score
OAM
)
Summarizes sensitivity and precision:
F-Score
OAM
=
2·Prec
seg
·Sens
seg
Prec
seg
+Sens
seg
. (25)
Further measures can be generated by comparing the
spatial, temporal, or spatiotemporal accuracy between the
observed and ground truth segmentation [35]. Measures
for the spatial accuracy comprise shape fidelity, geometrical
similarity, edge content similarity and statistical data sim-
ilarity [35], negative rate metric, misclassification penalty
metric, rate of misclassification metric, and weighted quality
measure metric [13].
Shape fidelity
Is computed by the number of misclassified pixels of the AR
object and their distances to the border of the GT object.
Geometrical similarity [35]
Measures similarities of geometrical attributes between the
segmented objects. These include size (GSS), position (GSP),
elongation (GSE), compactness (GSC), and a combination of
elongation and compactness (GSEC):
GSS
=
area(GT) − area(AR)
,
GSP
=
(grav
X
area(GT) − grav
X
(AR)
2
−
grav
Y
area(GT) − grav
Y
(AR)
2
1/2
,
GSE(O)
=
area(O)
2 × thickness(O)
2
,
GSC(O)
=
perimeter
2
(O)
area(O)
,
GSEC
=
GSE(GT)−GSE(AR)
10
+
GSC(GT)
−GSC(AR)
150
,
(26)
where area represents the segmented area of the objects,
grav
X
(O)andgrav
Y
(O)are the center coordinates of the
gravity of an object O, and thickness(O)is the number of
morphological erosion steps until an object disappears.
Edge content similarity (ECS) [35]
Yields a similarity based on edge content
ECS
= avg(|Sobel(GT − AR)|) (27)
with avg as average value and Sobel the result of edge
detection by a Sobel filter.
Statistical data similarity [35]
Measures distinct statistical properties using brightness and
redness (SDS)
SDS
=
3
4 × 255
avgY(GT) −avgY(AR)
+
avgV(GT) −avgV(AR)
.
(28)
Here, avgY and avgV are average values calculated in the
YUV color model.
Negative rate (NR) metric [13]
Measures a false negative rate NR
FN
and false positive rate
NR
FP
between matches of ground truth GT and result AR on
a pixel-wise basis. The negative rate metric uses the number
of false negative #FN
p
and false positive pixels #FP
p
and is
defined via the arithmetic mean in contrast to the harmonic
mean used in the F-Score
seg
:
NR
=
1
2
NR
FN
+NR
FP
,
NR
FN
=
#FN
p
#TP
p
+#FN
p
,
NR
FP
=
#FP
p
#TN
p
+#FP
p
.
(29)
Misclassification penalty metric (MPM) [13]
Values misclassified pixels by their distances from the GT
object border
MPM
=
1
2
MPM
FN
+MPM
FP
,
MPM
FN
=
1
D
#FN
p
k=1
d
FN
(k),
MPM
FP
=
1
D
#FP
p
k=1
d
FP
(k),
(30)
where d
FN/FP
(k) is the distance of the kth false negative/false
positive pixel from the GT object border, and D is a
normalization factor computed from the sum over all
distances between FP and FN pixels and the object border.
Rate of misclassification metric (RMM) [13]
Describes the false segmented pixels by the distance to the
border of the object in pixel units
RMM
=
1
2
RMM
FN
+ RMM
FP
,
RMM
FN
=
1
#FN
p
#FN
p
k=1
d
FN
(k)
D
diag
,
RMM
FP
=
1
#FP
p
#FP
p
k=1
d
FP
(k)
D
diag
,
(31)
where D
diag
is the diagonal distance of the considered frame.
12 EURASIP Journal on Image and Video Processing
Weighted quality measure metric (WQM) [13]
Evaluates the spatial difference between GT and AR by the
sum of weighted effects of false positive and false negative
segmented pixels
WQM
= ln
1
2
WQM
FN
+WQM
FP
,
WQM
FN
=
1
#FN
p
#FN
p
k=1
w
FN
d
FN
(k)
d
FN
(k),
WQM
FP
=
1
#FP
p
#FP
p
k=1
w
FP
d
FP
(k)
d
FP
(k),
w
FP
d
FP
=
B
1
+
B
2
d
FP
+ B
3
, w
FN
d
FN
=
C·d
FN
.
(32)
TheconstantswereproposedasB
1
= 19, B
2
= 178.125, B
3
=
9.375, and C = 2[13].
Temporal accuracy takes video sequences into con-
sideration and assesses the motion of segmented objects.
Temporal and spatiotemporal measures are often used in
video surveillance, for example, misclassification penalty,
shape penalty, and motion penalty [17].
Misclassification penalty (MP
pix
)[17]
Penalizes the misclassified pixels that are farther from the GT
more heavily:
MP
pix
=
x,y
I(x, y, t)cham(x, y, t)
x,y
cham(x, y, t)
, (33)
where I(x, y, t) is an indicator function with value 1 if AR
and GT are different, and cham denotes the chamfer distance
transform of the boundary of GT.
Shape penalty (MP
shape
)[17]
Considers the turning angle function of the segmented
boundaries:
MP
shape
=
K
k
=1
Θ
t
GT
(k) −Θ
t
AR
(k)
2πK
, (34)
and Θ
t
GT
(k), Θ
t
AR
(k) denote the turning angle function of
the GT and AR,andK is the total number of points in the
turning angle function.
Motion penalty (MP
mot
)[17]
Uses the motion vectors
→
v
(t)ofGT and AR objects
MP
mot
=
→
v
GT
(t) −
→
v
AR
(t)
→
v
GT
(t)
+
→
v
AR
(t)
. (35)
Nghiem et al. [16, 34] propose further segmentation
measures adapted to the video surveillance application.
These measures take into account how well a segmentation
method performs in special cases such as appearance of
shadows (shadow contrast levels) and handling of split and
merge situations (split metric and merge metric).
4.3.1. Chosen segmentation measure subset
Due to the enormous costs and expenditure of time to gener-
ate pixel-accurate segmentation ground truth, we decided to
be content with an approximation of the real segmentation
data. This approximation is given by the already labeled
bounding boxes and enables us to apply our segmentation
metric to a huge number of sequences, which makes it easier
to get more representative results. The metrics we chose is
equal to the above mentioned object area metric proposed in
[15]:
(i) Prec
OAM
(22),
(ii) Sens
OAM
(23),
(iii) F-Score
OAM
(25).
The benefit of this metric is its independence from
assignments between GT and AR objects as described in
Section 4.2. Limitations are given by inexactness due to
the discrepancy between the areas of the objects and their
bounding boxes as well as the inability to take into account
the areas of occluded objects.
4.4. Object detection measures
In order to get meaningful values that represent the ability of
the system to fulfill the object detection tasks, the numbers
of correctly detected, falsely detected, or misdetected objects
are merged into appropriate formulas to calculate detection
measures like detection rates or precision and sensitivity.
Proposals for object detection metrics mostly concur in their
use of formulas, however the definition of a good detection
of an object differs.
4.4.1. Object-counting approach
The simplest way to calculate detection measures is to
compare the AR objects to the GT object according only to
their presence whilst disregarding their position and size.
Configuration distance (CD) [33]
Smithetal.[33] present the configuration distance, which
measures the difference between the number of GT and AR
objects and is normalized by the instantaneous number of
GT objects in the given frame
CD
=
#AR
o
−#GT
o
max
#GT
o
,1
, (36)
where #AR
o
is the number of AR objects and #GT
o
the
number of GT objects in the current frame. The result is
zero if #GT
o
= #AR
o
,negativewhen#GT
o
> #AR
o
,and
positive when #GT
o
< #AR
o
, which gives an indication of
the direction of the failure.
Axel Baumann et al. 13
Number of objects [15]
The collection of the metrics evaluated by [15] contains a
metric only concerning the number of objects, consisting of
a precision and a sensitivity value
Prec
NO
=
min
#AR
o
,#GT
o
#AR
o
,
Sens
NO
=
min
#AR
o
,#GT
o
#GT
o
.
(37)
The global values are computed by averaging the frame-wise
values taking into account only frames containing at least one
object. Further information about averaging can be found in
Section 4.11.
The drawback of the approaches based only on counting
objects is that multiple failures could compensate and
result in an apparently perfect values for these measures.
Due to the limited significance of measures based only on
object counts, most approaches for detection performance
evaluation contain metrics taking into account the matching
of GT and AR objects.
4.4.2. Object-matching approach
Object matching based on centroids as well as on the object
area overlap is described in detail in Section 4.2. Though the
matching based on object centroids is a quick and easy way
to assign GT and AR objects, it does not provide reliable
assignments in complex situations (Section 4.2.1). Since the
matching based on the object area overlap does not feature
these drawbacks (Section 4.2.2), we decided to determine
object correspondences via the overlap and to add this metric
to our environment. After the assignment step, precision and
sensitivity are calculated according to ETISEO metric M1.2.1
[15]. This corresponds to the following measures which we
added to our environment:
Prec
det
=
#TP
o
#TP
o
+#FP
o
,
(38)
Sens
det
=
#TP
o
#TP
o
+#FN
o
,
(39)
F-Score
det
=
2·Prec
det
·Sens
det
Prec
det
+Sens
det
.
(40)
Theaveragedmetricsforasequencearecomputedas
the sum of the values per frame divided by the number
of frames containing at least one GT object. Identical to
the segmentation measure, we use the harmonic mean of
precision and sensitivity for evaluating the balance between
these aspects.
The fact that only one-to-one correspondences are
allowed results in the deterioration of this metric in merge
situations. Thus, it can be used to test the capabilities of the
system to separately detect single objects, which is of major
importance in cases of groups of objects or occlusions.
Thepropertymentionedabovemakesthismetriconly
partly appropriate to evaluate the detection capabilities of
a system independently from the real number of objects
DetOvl Det
TP FN FP TP FN FP
TP FN FP TP FN FP
TP FN FP TP FN FP
TP FN FP TP FN FP
200 110
210 120
200 101
201
102
TP
FN
FP
Figure 11: Comparison of strict and lenient detection measures.
in segmented blobs. In test sequences where single persons
are merged into groups, for example, this metric gives the
illusion that something was missed, though there was just no
separation of groups of persons into single objects.
In addition to the strict metric, we use a lenient metric
allowing multiple assignments and being content with a
minimal overlap. Calculation proceeds in the same manner
as for the strict metric, except that due to the modified
method of assignment, the deviating definitions of TP, FP,
and FN result in these new measures.
(i) Prec
detOvl
,
(ii) Sens
detOvl
,
(iii) F-Score
detOvl
.
Figure 11 exemplifies the difference between the strict
and the lenient metric applied to two combinations for the
split and the merge case. The effects of the strict assignment
can be seen in the second column where each object is
assigned to only one corresponding object, and all the others
are treated as false detections, although they have passed the
distance criterion. The consequences in the merge case are
more FNs and in the split case more FPs.
There are metrics directly addressing the split and merge
behavior of the algorithm. In the split case, the number of AR
objects which can be assigned to a GT object is counted and
14 EURASIP Journal on Image and Video Processing
in the case of a merge, it is determined how many GT objects
correspond to an AR object. This is in accordance with the
ETISEO metrics M2.2.1 and M2.3.1 [15]. The definition of
the ETISEO metric M2.2.1 is
Split
=
1
#GT
f
·
GT
f
1
#GT
o
#GT
o
l=1
1
#
AR
o
−→ GT
o
(l)
, (41)
where #(AR
o
→ GT
o
(l)) is the number of AR objects for
which the matching criteria allow an assignment to the
corresponding GT objects and #GT
f
is the number of frames
which contain at least one GT object. For every frame, the
average inverse over all GT objects is computed. The value
for the whole sequence is then determined by summing the
values of every frame and dividing by the number of frames
in which at least one GT object occurs.
For this measure, the way of assigning the objects is of
paramount importance. When objects fragment into several
smaller objects, the single fragments often do not meet the
matching criteria used for the detection measures. Therefore,
a matching criterion that allows to assign AR objects which
are much smaller then the corresponding GT objects needs
to be used. For the ETISEO benchmarking [6], the distance
measure D5-overlapping [15] was used as it satisfies this
requirement.
Another problem is that in the case of complex scenes
with occlusions, fragments of one AR object should not
be assigned to several GT objects simultaneously as this
would falsely worsen the value of this measure. Each AR
object which represents a fragment should only be allowed
to be counted once. Therefore, the following split measure is
integrated in the presented ATE:
Split resistance (SR)
SR
=
1
#GT
o
·
#GT
o
l=1
1
1+#add. split fragments (l)
,
SR
AvM
=
1
#GT
f
·
GT
f
SR.
(42)
The assignment criteria used here are constructed to allow
minimal overlaps to lead to an assignment, thus avoiding the
overlooking of fragments.
The corresponding metric for the merge case presented
by ETISEO M2.3.1 [15]is
Merge
=
1
#GT
f
·
GT
f
1
#AR
o
#AR
o
l=1
1
#
GT
o
−→ AR
o
(l)
, (43)
where #(GT
o
→ AR
o
(l)) is the number of GT objects which
can be assigned to the corresponding AR objects due to the
matching criterion used.
For the merge case, the same problems concerning the
assignment must be addressed as for the split case. Thus, the
proposed metric for the merge case is
Merge resistance (MR)
MR
=
1
#AR
o
#AR
o
l=0
1
1+#add. merged objects (l)
,
MR
AvM
=
1
#AR
f
AR
f
MR.
(44)
The classification if there is a split or merge situation
can also be achieved by storing matches between GT and AR
objects in a matrix and then analyzing its elements and sums
over columns and rows [37]. A similar approach is described
by Smith et al. [33], which use configuration maps contain-
ing the associations between GT and AR objects to identify
and count configuration errors like false positives, false
negatives, merging and splitting. An association between a
GT and an AR object is given if they pass the coverage test,
that is, the matching value exceeds the applied threshold.
To infer FPs and merging, a configuration map from the
perspective of the ARs is inspected, and FNs and splitting are
identified by a configuration map from the perspective of the
GTs. Multiple entries indicate merging, respectively, splitting
and blank entries indicate FPs, respectively, FNs.
4.4.3. Chosen object detection measure subset
To summarize the section above, these are the object
detectionmeasuresusedinourATE.
(i) Detection performance (strict assignment):
(a) Prec
det
(38),
(b) Sens
det
(39),
(c) F-Score
det
(40).
(ii) Detection performance (lenient assignment):
(a) Prec
detOvl
,
(b) Sens
detOvl
,
(c) F-Score
detOvl
.
(iii) Merge resistance:
(a) MR (44).
(iv) Split resistance:
(a) SR (42).
In addition, we use a normalized measure for the rate of
correctly detected alarm situations, where an alarm situation
is a frame containing at least one object of interest.
Alarm correctness rate (ACR)
The number of correctly detected alarm and nonalarm
situations in relation to the number of frames:
ACR
=
#TP
f
+#TN
f
#frames
. (45)
Axel Baumann et al. 15
4.5. Object localization measures
The metrics above give insight into the system’s capability of
detecting objects. However, they do not provide information
of how precisely objects have been detected. In other words,
how precisely region and position of the assigned AR match
the GT bounding boxes.
This requires certain metrics expressing the precision
numerically. The distance of the centroids discussed in
Section 4.2.1 is one possibility, which requires normalization
to keep the desired range of values. The problem lies in
this very fact, since finding a normalization which does
not deteriorating the metric’s relevance is difficult. The
following section introduces our experiment and finally
explains why we are not completely satisfied with its results.
In order to make 0 the worst, and 1 the best value,
we have to transform the Euclidean distance used in the
distance definitions of the object centroid matching into a
matching measure by subtracting the normalized distance
from 1. Normalization commences along the larger of the
two bounding box’s diagonals. This results in the following
object localization measure definitions for each pair of
objects:
Relative object centroid distance (ROCD)
ROCD
=
x
GT
−x
AR
2
+
y
GT
− y
AR
2
max
d
GT
, d
AR
, (46)
Relative object centroid match (ROCM)
ROCM
= 1 −ROCD. (47)
In theory, the worst value 0 is reached as soon as the
centroid’s distance equals or exceeds the larger bounding
box’s diagonal. In fact, this case will not come about, since
these AR/GT combinations of the above-described matching
criteria are not meant to occur in the first place. Their
bounding boxes do not overlap anymore here. Unfortunately,
this generous normalization results in merely exploiting only
the upper possible range of values, and in only a minor
deviation between the best and worst value for this metric.
In addition, significant changes in detection precision are
represented only by moderate changes of the measure.
Another drawback is at hand. When an algorithm tends to
oversegment objects, it will have a positive impact on the
value of ROCM, lowering its relevance.
A similar problem occurs when introducing a metric
for evaluating the size of AR bounding boxes. One way
to resolve this would be to normalize the absolute region
difference [14], another would be using a ratio of AR and
GT bounding boxes’ regions. We added the metric relative
object area match (ROAM) to our ATE, which represents the
discrepancy of the sizes of AR and GT bounding boxes. The
ratio is computed by dividing the smaller by the larger size,
in order to not exceed the given range of value, that is,
Relative object area match (ROAM)
ROAM
=
min(A
GT
, A
AR
)
max(A
GT
, A
AR
)
. (48)
Information about the AR bounding boxes being too
large or too small compared to the GT bounding boxes is
lost in the process.
Still missing is a metric representing the precision of
the detected objects. Possible metrics were presented with
Prec
OAM
,Sens
OAM
,andF-Score
OAM
in Section 4.3.Insteadof
globally using this metric, we apply them to certain pairs of
GT and AR objects (in parallel to [33]) measuring the object
area coverage. For each pair, this results in values for Prec
OAC
,
Sens
OAC
,andF-Score
OAC
. As mentioned above, F-Score
OAC
is
identical to the computed dice coefficient (21).
The provided equations of the three different metrics that
evaluate the matching of GT and AR bounding boxes relate
to one pair in each case. In order to have one value for each
frame, the values, resulting in the object correspondences,
areaveraged.Theglobalvalueforawholesequenceisthe
average value over all frames featuring at least one object
correspondence.
Unfortunately, averaging raises dependencies to the
detection rate, which can lead to distortion of results when
comparing different algorithms. The problem lies in the fact
that only values of existing assignments have an impact
on the average value. If a system is parameterized to be
insensitive, it will detect only very few objects but these
precisely. Such a system will achieve much better results than
a system detecting all GT objects but not matching them
precisely.
Consequently, these metrics should not be evaluated
separately, but always together with the detection measures.
The more the values of the detection measures differ, the
more questionable the values of the localization measures
become.
4.5.1. Chosen object localization measure subset
Here is a summarization of the object localization measures
chosen by us:
(i) relative object centroid match:
(a) ROCM (47),
(ii) relative object area match:
(a) ROAM (48),
(iii) object area coverage:
(a) Prec
OAC
,
(b) Sens
OAC
,
(c) F-Score
OAC
.
4.6. Tracking measures
Tracking measures apply over the lifetime of single objects,
which are called tracks. In contrast to detection measures,
16 EURASIP Journal on Image and Video Processing
which evaluate the detection rate of anonymous objects for
every single frame, tracking measures compute the ability
of a system to track objects over time. The discrimination
between different objects is usually done via an unique ID
for every object. The tracking measures for one sequence are
thus not computed via an averaging of frame-based values,
but rather by using averaging over the frame-wise values
of the single tracks. The first step consists therefore of the
assignment of AR to GT tracks. Two different approaches can
be found for this task.
4.6.1. Track assignment based on trajectory matching
Senior et al. [10] match the trajectories. For this purpose,
they compute for every AR and GT track combination a
distance value which is defined as follows:
D
AR,GT
i
1
, i
2
=
1
N
AR,GT
i
1
, i
2
×
j
→
x
AR
i
1
, j
−
→
x
GT
i
2
, j
2
+
→
v
AR
i
1
, j) −
→
v
GT
i
2
, j
2
+
→
s
AR
i
1
, j
−
→
s
GT
i
2
, j
2
1/2
,
(49)
where N
AR,GT
(i
1
, i
2
) is the number of points in both tracks
AR
tr
(i
1
)andGT
tr
(i
2
),
→
x
AR
(i
1
, j)or
→
x
GT
(i
2
, j) is the centroid
of the bounding box of an AR or GT track at frame
j,
→
v
AR
(i
1
, j)or
→
v
GT
(i
2
, j) is the velocity and
→
s
AR
(i
1
, j)or
→
s
GT
(i
2
, j) is the vector of width and height of track i
1
or i
2
at frame j.
This way of comparing trajectories, which takes the
position, the velocities, and the objects’ bounding boxes
into account, is also used in a reduced version of (49)in
[11, 14, 30] considering only the position of the object:
D
AR,GT
i
1
, i
2
=
1
N
AR,GT
i
1
, i
2
j
→
x
AR
i
1
, j
−
→
x
GT
i
2
, j
.
(50)
The calculation of the distance matrix according to (50)is
included in Figure 12 and marked as Step 2. Step 1 represents
the analysis of temporal correspondence and hence the
calculation of the number of overlapping frames. In order
to actually establish the correspondence between AR and GT
tracks, a thresholding step (Step 3 in Figure 12)hastobe
applied. The resulting track correspondence is represented by
a binary mask, which is simply calculated by assigning a one
to those matrix elements which exceed a given threshold and
zero in the alternative case.
Track correspondence is established by thresholding this
matrix. Each track in the ground truth can be assigned to
one or more tracks from the results. This accommodates
fragmented tracks. Once the correspondence between the
ground truth and the result tracks is established, the follow-
ing error measures are computed between the corresponding
tracks:
False positive track error rate (TER
FP
)
TER
FP
=
#AR
tr
−#
AR
tr
−→ GT
tr
#GT
tr
, (51)
False negative track error rate (TER
FN
)
TER
FN
=
#AR
tr
−#
GT
tr
−→ AR
tr
#GT
tr
. (52)
Object detection lag
This is the time difference between the ground truth
identifying a new object and the tracking algorithm detecting
it. Time-shifts between tracks and an evaluation of (spatio-
)temporally separated GT and AR tracks using statistics are
discussedinmoredetailby[38].
If an AR track is assigned to a GT track, metrics are
needed to assess the quality of the representation by the AR
track. One criterion for that is the temporal overlap, respec-
tively, the temporal incongruity as rated in the following
metric.
Track incompleteness factor (TIF)
TIF
=
#FN
f
(i)+#FP
f
(i)
#TP
f
(i)
, (53)
where FN
f
(i) is the false negative frame count, that is, the
number of frames that are missing from the AR Tr ac k, FP
f
(i)
is the false positive frame count, that is, the number of frames
that are reported in the AR which are not present in the GT,
and TP
f
(i) is the number of frames present in both AR and
GT.
Once not only the presence but also the the correspon-
dence between the ground truth and the result tracks is
established according to the trajectory matching, the follow-
ing error measures are computed between the corresponding
tracks.
Track detection rate (TDR)
The track detection rate indicates the tracking completeness
of a specific ground truth track. The measure is calculated as
follows
TDR
=
#TP
f
(i)
#frames GT
tr
(i)
, (54)
where #frames GT
tr
(i) is the number of the frames of the ith
GT track. In [11], #TP
f
(i)isdefinedasthenumberofframes
of the ith GT track that correspond to an AR track.
Tracker detection rate (TRDR)
This measure characterizes the tracking performance of the
object tracking algorithm. It is basically similar to the TDR
measure, but considers entities larger than just single tracks
TRDR
=
i
#TP
f
(i)
i
#frames GT
tr
(i)
, (55)
Axel Baumann et al. 17
Ground truth (GT)
tracks Result tracks
Checking for temporal
correspondence and calculation of
number of overlapping frames
Calculation of distance d for each
temporal corresponding result track /
GT track combination
Calculation of a threshold matrix
mask (threshold depending on used
distance function d
ij)
Measure calculation, classification of
true positive and false negative
tracks
Statistical analysis of matrix
elements (e.g. averaging)
Step 1
Step 2
Step 3
Step 4
Step 5
GT track i
Result track j
Overlap o
ij
Frame no (time)
Result tracks
Result tracks
Result tracks
Result tracks
GT tracks
GT tracks
GT tracks
GT tracks
[o 11, o 12, , o 1Nr]
[o
21, o 22, , o 2Nr]
[o
Ng1, , o NgNr]
···
Ng×Nr correspondence
matrix with number of
overlapping frames
[d
11 , d 12, , d 1Nr]
[d
21 , d 22, , d 2Nr]
···
[d Ng1, , d NgNr]
Ng
×Nr distance matrix
[1 0
···11]
[0 1
···10]
[
············]
[0 1
···10]
Ng
×Nr binary matrix
[d
11, d 12, , d 1Nr]
[d
21, d 22, , d 2Nr]
···
[d Ng1, , d NgNr]
Ng
×Nr distance /
measure matrix
d
avg
d
ij
=
1
O
ij
f (BB,euclD, )
overlapping
frames
{
Figure 12: Overview of the measure calculation procedure as applied in [14]. Step 1 represents the analysis of temporal correspondence and
hence the calculation of the number of overlapping frames. The calculation of the distance matrix according to (50)isperformedinStep 2.
In order to actually establish the correspondence between AR and GT tracks, a thresholding step has to be applied (Step 3). The resulting
track correspondence is represented by a binary mask, which is simply calculated by assigning a one to those matrix elements which exceed
a given threshold and zero in the alternative case. In Step 4, the actual measures are computed. Further, additional analysis is performed in
Step 5.
18 EURASIP Journal on Image and Video Processing
where #frames GT
tr
(i) is the number of the frames of the ith
GT track.
False alarm rate (FAR)
The FAR measures also the tracking performance of the
object tracking algorithm. It is defined as follows
FAR
=
i
#FP
f
(i)
i
#frames AR
tr
(i)
, (56)
where #frames AR
tr
(i) is the number of the frames of the ith
AR track. In [11], FP
f
(i) is defined as one object of the ith
AR track, that is tracked by the system and does not have a
matching ground truth point.
Track fragmentation (TF)
Number of result tracks matched to a ground truth track
TF
=
1
#TP
GT
tr
i
#
AR
tr
−→ GT
tr
(i)
. (57)
Occlusion success rate (OSR)
OSR =
Number of successful dynamic occlusions
Total number of dynamic occlusions
. (58)
Tracking success rate (TSR)
TSR
=
Number of non-fragmented tracked GT tracks
#GT
tr
.
(59)
4.6.2. Track assignment based on frame-wise
object matching
The second approach to assign the AR to the GT tracks
is to use the same frame-wise object correspondences as
for the detection measures as mentioned in Section 4.4.
However, those correspondences are not always correct.
Ideally, each GT track is matched by exactly one AR track,
though it does not necessary hold in practice. To associate
identities properly it has been proposed that identification
associations can be formed on a “majority rule” basis [33],
where an AR track is assigned to the GT track with which
it has the maximal corresponding time, and a GT track is
assigned to the AR track which corresponds to it for the
largest amount of time. Based on the definitions above, four
tracking measures are introduced. Two of them measure the
identification errors.
Falsely identified tracker (FIT)
An AR track segment which passes the coverage test for a GT
track but is not the identifying AR track for it (see Figure 13):
FIT =
1
#frames
j
#FIT(j)
max
#GT
tr
(i)(j), 1
. (60)
AR
1
AR
2
AR
3
GT
1
GT
2
GT
3
FIT
FIO
Figure 13: Example for identification errors proposed by [33].
Three GT objects are tracked by three AR objects. A falsely identified
tracker error (FIT) occurs when GT
1
is tracked by a second
corresponding AR track AR
3
. A falsely identified object error (FIO)
occurs when an AR track swaps the corresponding GT track, here
this is the case for AR
2
swapping from GT
2
to GT
3
.Thetime
intervals where a FIT, respectively, FIO occur are marked.
Falsely identified object (FIO)
A GT track segment which passes the coverage test for an AR
but is not the identifying GT track (see Figure 13):
FIO =
1
#frames
j
#FIO(j)
max
#GT
tr
(j), 1
. (61)
The other two measures are similar to TDR and FAR but
more strict, because they rate only correspondences with the
identifying track as correct.
Tracker purity (TPU)
The tracker purity indicates the degree of consistency to
which an AR track identifies a GT track
TPU
=
#correct frames AR
tr
(i)
#frames AR
tr
(i)
, (62)
where #frames
AR
(i) is the number of frames of the ith AR
track and #correct frames
AR
(i) the number of frames that the
ith AR track identifies a GT track correctly.
Object purity (OPU)
The object purity indicates the degree of consistency to which
a GT track is identified by an AR track:
OPU
=
#correct frames GT
tr
(i)
#frames GT
tr
(i)
, (63)
where #frames GT
tr
(i) is the number of the frames of the
ith GT track and #correct frames GT
tr
(i) is the number of
frames that the ith GT track is identified by an AR track
correctly.
The ETISEO metrics [15] provide tracking measures
which are similar to the above-mentioned ones. Met-
ric M3.2.1 calculates a track-based Prec
track
,Sens
track
,
and F-Score
track
.TheSens
track
conforms to (52), because
Sens
track
= 1−TER
FN
, but the Prec
track
differs from 1−TER
FP
(51), because it refers to the number of AR tracks instead
of the number of GT tracks. Another metric in [15] is the
Axel Baumann et al. 19
“tracking time” (M3.3.1), which is the same as the OPU
above.
To assess the consistency of the object IDs, the metrics
persistence (M3.4.1) and confusion (M3.5.1) are used.
Persistence (Per)
Evaluates the persistence of the ID
Per
=
1
#GT
tr
i
1
#
AR
tr
−→ GT
tr
(i)
. (64)
Confusion (Conf)
Indicates the robustness to confusion along the time
Conf
=
1
#
GT
tr
−→ AR
tr
i
1
#
GT
tr
−→ AR
tr
(i)
, (65)
where #(AR
tr
→ GT
tr
(i)) indicates the number of AR tracks
that correspond to the ith GT track and vice versa for
#(GT
tr
→ AR
tr
(i)).
4.6.3. Chosen tracking measure subset
For our evaluations, the assignment of tracks is done via
frame-based correspondences as described in Section 4.6.2.
Using that strategy, we compute the following measures.
False positive track resistance (TR
FP
)
Assesses the ability of the system to prevent FP tracks, which
are AR tracks without any correspondence to a GT track:
TR
FP
= 1 −
#AR
tr
−#
AR
tr
−→ GT
tr
#AR
tr
. (66)
Note the division by #AR
tr
instead of #GT
tr
(compare to
(51)).
False negative track resistance (FNTR)
Assesses the ability of the system to prevent FN tracks, which
are GT tracks without any correspondence to an AR track
TR
FN
= 1 −TER
FN
. (67)
Track coverage rate (TCR)
Measures how long an AR track has correspondences to GT
tracks in relation to its lifetime
TCR
=
#ass. frames GT
tr
(i)
#frames GT
tr
(i)
, (68)
where #frames GT
tr
(i) is the number of frames of the ith GT
track and #ass. frames GT
tr
(i) is the number of frames that
the ith GT track is identified by at least one AR track.
Track fragmentation resistance (TFR)
Assesses the ability to track an GT object without changing
the ID of the AR track. The more AR tracks are assigned over
the GT track’s lifetime, the worse is the value of this metric:
TFR
=
1
#TP
GT
tr
i
1
#
AR
tr
−→ GT
tr
(i)
1:1
, (69)
where #(AR
tr
→ GT
tr
(i))
1:1
indicates the number of AR
tracks that correspond to the ith GT track. If there are
multiple correspondences at the same time for one GT
track, the best one is taken into account. GT tracks without
correspondences (FN
tr
) are omitted.
Tracking success rate (TSR)
Analogue to (59). We also adopt the four tracking measures
from [33] with partially small modifications.
Tracker purity (TPU)
Is identical to (62), but with N
AR
as the number of AR
tracks excluding FP tracks. Otherwise, the FP tracks would
dominate this measure and the changes that this measure is
established to assess would be occluded.
Object purity (OP)
Equal to (63).
To fulfill our normalization constraints, we transform the
errors FIT and FIO into resistances.
Falsely identified tracker resistance (FITR)
FITR
= 1 −
1
#ass. frames
AR,GT
j
#FIT(j)
max
#GT
tr
(j), 1
.
(70)
Falsely identified object resistance (FIOR)
FIOR
= 1 −
1
#ass. frames
AR,GT
j
#FIO(j)
max
#GT
tr
(j), 1
,
(71)
where #ass. frames
AR,GT
is the number of frames containing
at least one correspondence between a GT and an AR object.
Using the frame count of the sequence according to the
definition in [33] would give empty scenes an occluding
influence on the value of this measure. #FIT(j)and#FIO(j)
are the number of FIT and FIO, respectively, in frame j
according to the definitions of (60)and(61).
4.7. Event detection measures
The most important step for event detection measures is
the matching of GT data and AR data, which can be
20 EURASIP Journal on Image and Video Processing
AR
GT
123
4
A
B
CD
Time
Figure 14: Time-line of events. What is the best matching between
events?
solved by simple thresholding. Most of the proposals in
the literature match events by using the shortest time delay
between the events in GT and AR. In the event that the
time delay exceeds a certain threshold, matching fails. This
is a reliable approach for simple scenarios with few events.
However, considering real world scenarios, this approach
does not return the correct match. A simple example is
depicted in Figure 14, where one match might be A-1, B-
2, and C-4 and a second one might be A-1, B-2, C-3, D-
4, among other possible matches. Desurmont et al. [39]
propose a dynamic realignment algorithm using dynamic
programming to compute the best match between GT and
AR events. The algorithm incorporates a maximum allowed
delay between events.
The CREDS project [40] classifies correct detection
into three categories: perfect, anticipated, and delayed.Each
event in the GT data may be associated to a single correct
detection. Multiple overlaps in time are not covered in detail,
the first occurrence is matched and the remaining events
are treated as FP. The authors define a score function of
delay/anticipation and a ratio between GT event duration
(GT
ed
)andAR event duration (AR
ed
):
S
CD
(t,AR
ed
,GT
ed
) =
⎧
⎪
⎪
⎪
⎪
⎪
⎪
⎪
⎨
⎪
⎪
⎪
⎪
⎪
⎪
⎪
⎩
0, (t<B) ∨(t>D),
S
A − B
(t
−B), B ≤ t ≤ A,
S, A
≤ t ≤ 0,
S
D
(D
−t), 0 ≤ t ≤ D.
(72)
S represents the maximum score associated with a correct
detection. The authors compute it as follow:
S
=
⎧
⎪
⎪
⎪
⎨
⎪
⎪
⎪
⎩
50∗
2 −
1 −
AR
ed
GT
ed
2
,0≤
AR
ed
GT
ed
≤ 2,
50,
AR
ed
GT
ed
> 2.
(73)
The maximum tolerated delay is expressed by D in
milliseconds, whereas A represents the accepted anticipation
in milliseconds. B stands for the maximum tolerated antici-
pation in milliseconds. The values D, A,andB are dependent
on the event type (warning event, alarm event, or critical
event).
The ETISEO [15] project defined a set of metrics for
events to. Measures for correctly detected events over the
whole sequence are defined. In the first set of event detection
measures M5.1.1, only whether events occurred is compared
and not their time of occurrence nor object association. Time
constraints are added to M5.1.1 in the second measure set
M5.1.2. A last set of measures M5.3.1 is defined which facil-
itates correct detection in time and parameters. Parameters
are object classes, so called contextual zones (areas such as a
street, a bus stop) and involved physical objects. For instance,
an event “car parked in forbidden zone” has to be raised
once a physical object, which has been classified as car, is
idle for longer than a defined time interval in a contextual
zone which is marked as “no parking area.” The formulas for
measures M5.1.1, M5.1.2, and M5.3.1 are defined identically,
only the matching criteria are different. Prec
event
,Sens
event
,
and F-Score
event
are used by ETISEO [15]:
Prec
event
=
#TP
e
#TP
e
+#FP
e
,
Sens
event
=
#TP
e
#TP
e
+#FN
e
,
F-Score
event
=
2·Prec
event
·Sens
event
Prec
event
+Sens
event
.
(74)
TP relatestoamatchbetweenGT and AR.
4.7.1. Chosen event detection measure subset
We choose M5.1.2 defined in [15] with the dice coefficient
(21) for the matching of the time intervals as event detection
metric:
(i) Prec
event TI
,
(ii) Sens
event TI
,
(iii) F-Score
event TI
.
4.8. Object classification measures
Senior et al. [10] propose the measure Object type error which
simply counts the number of tracks with incorrect classifi-
cation. The definition is somewhat vague as it is unknown
if a track has to be classified more than fifty percent of the
time correctly to be treated as correctly classified. ETISEO
[15] uses different measures classes. A simple class (M4.1.1)
uses the number of correctly classified physical objects of
interest in each frame. The second measure class (M4.1.2)
matches, in addition to M4.1.1, the bounding boxes of
the objects. ETISEO distinguishes between misclassifications
caused by classification shortcomings and misclassifications
caused either in the object detection or the classification step:
Prec
class
=
#TP
c
#TP
c
+#FP
c
,
(75)
Sens
class
=
#TP
c
#TP
c
+#FN
c
,
(76)
Sens
class,det
=
#TP
c
#TP
c
+#FN
c,det
,
(77)
F-Score
class
=
2·Prec
class
·Sens
class
Prec
class
+Sens
class
,
(78)
F-Score
class,det
=
2·Prec
class
·Sens
class,det
Prec
class
+Sens
class,det
.
(79)
Axel Baumann et al. 21
#TP
c
refers to the number of objects types classified
correctly. #FN
c
is the number of false negatives caused by
classification shortcomings, for example, unknown class,
#FN
c,det
refers to the number of false negatives, caused by
object detection errors or by classification shortcomings.
In M4.1.3, the measures in M4.1.2 are enhanced by the
ID persistence criteria. Prec
class
,Sens
class
,andF-Score
class
are computed and used as measure. Due to the separation
between misclassifications, two Sens
class
and F-Score
class
measuresaredefinedineachmeasureclass.Themeasures
in M4.1.1 through M4.1.3 are computed at frame level.
Percentages for a complete sequence are computed as follows.
The sum of percentages per image divided by the number of
images containing at least one GT object.
Prec
class
,Sens
class
,andF-Score
class
are computed per
object type in M4.2.1. Therefore, the number of measures
equals the number of existing object types. The time
percentage of good classification is computed in M4.3.1:
GT
d
∩AR
d
,Type
AR
d
=
Type
GT
d
GT
d
∩AR
d
. (80)
GT
d
relates to the time interval in GT data, whereas AR
d
relates to the time interval in AR data. Nghiem et al. [34]
suggest to use M4.1.2.
4.8.1. Chosen classification measure subset
Class correctness rate (CCR)
Assesses the percentage of correctly classified objects. There-
fore, the types of the objects, which are assigned to each
other by the assignment step described in context of the
detection measures, are compared and the correct and false
classifications are counted:
CCR
=
1
#ass. frames
AR,GT
j
#CC(j)
#CC(j)+#FC(j)
, (81)
where #CC(j)and#FC(j) are the number of correctly,
respectively, falsely classified objects in frame j,and
#ass. frames
AR,GT
is the number of frames containing at least
one correspondence between GT and AR objects.
We also use a metric according to ETISEO’s M4.2.1,
which consists of two different specifications. The first
considers only the classification shortcomings and the other
includes the shortcomings of the detection to. With the first
specification, we agree, leading to the definition in (75), (76),
and (78).
Object classification performance by type
(i) Prec
class
(75),
(ii) Sens
class
(76),
(iii) F-Score
class
(78).
In the second specification, we differ from ETISEO
because we also take FP objects into account.
Object detection and classification performance by type
Prec
class,det
=
#TP
c
#TP
c
+#FP
c,det
,
Sens
class,det
=
#TP
c
#TP
c
+#FN
c,det
,
F-Score
class,det
=
2·Prec
class
·Sens
class,det
Prec
class
+Sens
class,det
,
(82)
where, in contrast to (75), FP
c,det
is used as the number of
false positives caused by shortcomings in the detection or
classification steps.
4.9. 3D object localization measures
3D object localization measures are defined in [15]. The
average, variance, minimum, and maximum of distances
between objects in AR as well as the trajectories of the objects
in GT are computed. Object gravity centers are used to
calculate the distances.
Average of object gravity center distance (AGCD) [15]
Measures the average of the distance between gravity centers
in AR and GT:
d
i
=
TOC
GT
(i) − TOC
AR
(i)
2
,AGCD=
1
N
N
i
d
i
,
(83)
where TOC(i) is the trajectory of the object’s center of gravity
at time i and N is the amount of elements.
Variance of object gravity center distance (VGCD) [15]
Computes the variance of the distance between gravity
centers in AR and GT:
VGCD
=
1
N
N
i
d
i
−AGCD
2
. (84)
Minimum and maximum distance of object gravity centers
(MIND, MAXD) [15]
Considers the minimum distance between centers of gravity
in AR and GT:
MIND
= inf{d ∈ D},MAXD= sup{d ∈ D}, (85)
where D is the set of all d
i
. Nghiem et al. [34] state that
detection errors on the outline are not taken into account
in [15]. Moreover there is no consensus on how to compute
the 3D gravity center of certain objects, like cars.
Note that when evaluating 3D information inferred from
2D data, the effects of calibration have to be taken into
account. If both AR and GT are generated from 2D data and
projected into 3D, the calibration error will be systematic.
22 EURASIP Journal on Image and Video Processing
If the GT is obtained in 3D, for example, using a differential
global positioning system (DGPS), and the AR still generated
from 2D images, then the effects of calibration errors have to
be taken into account.
4.10. Multicamera measures
Tracking across different cameras includes identifying an
object correctly in all views from different cameras. This
task, and possibly a subsequent 3D object localization
(Section 4.9), are the only differences to tracking within one
camera view only. Note that an object can be in several
views from different cameras at once, or it can disappear
from one view to appear in the view of another camera
some time later. The most important measure to quantify
the object identification is the ID persistence (64), which can
be evaluated for each view separately once the GT is labeled
accordingly and averaged afterwards. Again, the averaging
has to be chosen carefully, just as in the computation of mea-
sures within one camera view (Section 4.11). Multicamera
measures applying tracking measures (Section 4.6) using 3D
instead of 2D coordinates have been proposed for specific
applications such as tracking football players [41]orobjects
in trafficscenes[42].
4.11. The problem of averaging
At different stages during the computation of the measures,
single results of the measures are combined by averaging.
Within one frame, for example, the values for different
objects may be merged into one value for the whole frame.
The single frame-based values of the measures are then
aggregated to gain a value for the whole sequence. These
sequence-based values are again combined for a subset of
examined sequences to one value for each metric.
Regarding the performance profile for a set of different
sequences, it has to be known which averaging strategy
was used for the aggregation of the measures. The chosen
averaging strategy may tip the scales of the resulting measure
value. In the following sections, several issues concerning the
different averaging steps are highlighted.
4.11.1. Averaging within a frame
The metrics concerning object localization (Section 4.5)
are an example for the combination of measure values of
several objects to an aggregated value for one frame. The
unique assignment as used for the strict detection measures
(Section 4.4.2) provides a basis for the computation here.
For each GT object to which an AR object was assigned,
a value exists for the corresponding metric. Concerning
the averaging, two different possibilities exist. Either the
unassigned GT objects get the worst value of zero for not
being localized and the averaging is done via the number of
GT objects, or only the existing assignments are considered
and the averaging and normalization is done via their
number.
The first approach has the disadvantage of placing too
much emphasis on the detection performance and thus
masking the localization effects. A bad detection rate would
thus decrease the values of the localization significantly. The
second approach favors algorithms which detect only a few
objects but do so precisely. Algorithms, which find objects
which are hard to detect and localize precisely, are at a
disadvantage here. This disadvantage could be avoided by
using only these GT objects which were detected by both
algorithms in the averaging for the algorithm comparison.
4.11.2. Averaging within a sequence
Basically, there are two ways to combine object-based
measures for a sequence. One is to calculate a total value for
each GT track and then to average over all GT tracks. The
other way is to average the frame-wise results into one total
value for the whole sequence.
Averaging by track values
On the one hand, localization metrics for example do
not have to be combined frame-wise only, as described
above. They can be combined track-wise as well. In this
case, each measure is averaged over the lifetime of the
track. Similar to averaging frame-wise, time instants, when
the corresponding track cannot be assigned, have different
effects on the averaging. On the other hand, there are
pure track-based measures such as track coverage rate (68)
or track fragmentation resistance (69). On averaging track
values, the way in which FN tracks, which are GT tracks
that are never assigned to an AR track, are handled has to
be considered in both cases. Identical conclusions have to
be drawn as for frame-wise averaging regarding FN objects
mentioned above.
Averaging by frame values
Calculating an average value of a metric for the whole
sequence can be done in various ways. An important factor
in this is mainly the number of frames to average over. Which
way is more meaningful depends on the corresponding
metric. The problem is that for certain measures there is
not necessarily a defined value in all frames. For a frame,
which has no GT object, there is no value for example
for detection sensitivity. In parallel, there is no value for
detection precision for a frame lacking an AR object. As a
result of this, there is no value for the F-Score for frames
not featuring values for sensitivity nor precision. One way
to handle this is to define missing values, that is, assuming an
optimal value of 1 and dividing the sum of all frame values by
the number of frames in the sequence. As consequence, these
values would prefer sequences with only objects appearing
for a short duration. Another method is to sum up values
and divide by the number of frames, showing at least on GT
object [15]. This is an appropriate approach for those metrics
that can only be calculated when a GT object exists, as for the
detection sensitivity. There are drawbacks in this approach
for other metrics. The value for detection precision is also
defined in frames, not showing a GT object. It is defined
as 0. This results in FP objects being excluded from the
Axel Baumann et al. 23
averaging of the detection precision in frames not showing
a GT object. Such a method would result in strict detection
precision (38) and lenient detection precision (Section 4.4.2)
being incapable of representing an increase or decrease of
FP objects in empty scenes when comparing two algorithms.
This is not an issue when dividing by the number of frames
with AR objects in these situations, instead of using the
number of frames with GT objects. A deterioration of values
for detection precision as predicted can be ensured, when AR
objects are falsely detected in frames not showing GT objects.
Accordingly, the sum of all F-Score values has to be divided
by the number of frames showing at least one GT object or
at least one AR object.
4.11.3. Averaging over a collection of sequences
The single performance profiles for different sequences have
to be combined in the last step to an overall profile for
a sequence subset. The obvious approach is to sum the
sequence values for each measure and divide by the number
of sequences. The disadvantage is that the value of each
sequence is weighted the same for the overall value. As the
sequences differ greatly in length, number of GT objects, and
level of difficulty, this distorts the overall result. An extreme
example is a sequence with 200 000 frames and numerous
challenges for the algorithm being weighted the same as a
sequence with 200 frames showing only some disturbers,
but no objects of interest. For the latter, even one FP object
leads to a detection precision of zero. Combining these two
sequences equally weighted leads to a performance profile
which does not represent the performance of the algorithm
appropriately.
To avoid these effects, weights could be assigned to the
sequences and included in the computation of the averaging.
However, a sensible choice of the weighting factors is neither
easy nor obvious. A second possibility is the purposeful
selection of sequence subsets for which the averaging of the
measure values results in an adequately representative result.
5. EVALUATION
The above-mentioned metrics provide information about
various aspects of the system’s performance. As indicated
already, it is usually not possible to draw conclusions con-
cerning the differences in performance of two algorithms by
means of a single measure without considering the interplay
of interdependent measures. This section also shows how
to recognize strengths and weaknesses of an algorithm
by means of the metrics chosen in Section 4. Therefore,
considering various performance aspects, relevant combi-
nations of different metrics are listed and their evaluation
is explained starting with general remarks about measure
selection (Section 5.1)andsequencesubsets(Section 5.2).
The ATE (Section 3) is generally used to compare perfor-
mances of different versions of the video surveillance systems
in the development stage. Usually, two different versions
are chosen and their results compared. On the one hand,
this happens graphically by means of bar charts featuring
predefined subsets of calculated measures. Evaluating these
so-called performance profiles is described by means of two
examples in Section 5.3. One the other hand, a statistical
evaluation is done as will be described in Section 5.4.The
metrics used in the ATE (Section 3)areallnormalized,
so at evaluation time they can all be treated alike. This
simplifies the statistical evaluation of results as well as their
visualization.
5.1. Selecting and prioritizing measures
After having presented measures for each stage of a
surveillance system such as segmentation (Section 4.3),
object detection (Section 4.4), object localization
(Section 4.5
), tracking (Section 4.6), event detection
(Section 4.7), object classification (Section 4.8), 3D object
localization (Section 4.9), and multicamera tracking
(Section 4.10), is there any importance ranking between the
different families of measures? What are the most reliable
measures for an end-user? Is there a range or threshold for
some or all measures which qualifies a surveillance system
to be “good enough” for a user? The only general answer to
these questions is that it usually depends on the chosen task.
5.1.1. Balancing of false and miss detections
In assessing detection rates by means of precision and
sensitivity, for example, it was assumed that false and miss
detections are equally spurious. Based on this assumption,
the F-Score was used as a balancing measure. In fact,
depending on the application either FPsorFNscanrepresent
agreaterproblem.
Concerning live alarming systems, FPs are at least
distracting, since too many false alarms distract security
personnel. Consequently, parameterization makes the system
less sensitive to keep the false alarm rate low, thus accepting
missed events. For retrieval applications, FPs are less prob-
lematic, because they can be identified and discarded quickly.
FNs, on the other hand, would diminish the benefit of the
retrieval system and are therefore especially spurious.
In these cases, the F-Score is less useful, because nonequal
weighting of precision and sensitivity is necessary. The F-
Measure provides a solution for the discussed drawback by
adjusting the weighting.
5.1.2. Priority selection of measures
Depending on the performance aspect to be assessed, the
measures are also examined with different priorities. The
end-user may be interested in a specific event in a well-
defined scene, for example, “intrusion: detect an object going
through a fence from a public into a secure area” or “check
if there are more than 15 objects in the specified area at
the same time.” In scenarios like these, the end-user is most
interested in best performance regarding event detection
measures (detect all events without any false positives). In
comparison of different surveillance systems, the one with
the best event detection results is preferred. This is how i-
LIDS [7] benchmarks their participants.
24 EURASIP Journal on Image and Video Processing
For a developer of an existing system, the event measures
may be too abstract to get an insight if a small algorithm
change;anewfeatureoradifferent parameter set has
improved the system. Depending on the modification,
the most significant measure may be that for detection,
localization or tracking, or a combination of all of them.
In the case of evaluating, for example, the performance
of an algorithm for perimeter protection, it is first and
foremost important how many of the intruders are detected
in relation to the amount of false alarms. The values of the
event detection measures Prec
event
,Sens
event
,andF-Score
event
with respect to the event “Intrusion” are of most significance
here.
In a next step, false positive and false negative track resis-
tance (FPTR and FNTR), as well as the frame-based alarm
correctness rate (ACR), can be regarded. All other measures,
like the different detection or segmentation measures, are
only of interest if more precise information is asked for.
As a rule, this is the case if the coarse-granular results are
scrutinized. A meaningful evaluation for this task would
thus cover the above-mentioned measures as well as some
fine-granular like detection measures to support the results
further.
In the case of a less specific evaluation task, the usual
procedure is to start with coarse-granular measures and to
proceed to the more fine-granular measures. That means
that, similar to the example of perimeter protection above,
first of all the event detection measures are regarded,
continuing with tracking measures, which express whether
complete tracks were missed or falsely detected. The next
level is object based and includes the detection measures,
which express how well the detection of objects over time is
done. The finest level corresponds to pixel-based analysis of
the algorithm behavior and includes the segmentation and
object localization measures. Here, it is not analyzed whether
the objects are detected, but how well the detection is done
in terms of localization and precise segmentation.
The measures within the above-mentioned granularity
levels can be again prioritized from elemental measures to
others describing more detailed information. The tracking
measures, for example, can be structured by the following
aspects.
(i) A track was found (FNTR).
(ii) Duration of the detected track (TCR).
(iii) Continuity of the tracking (TFR, OP, FITR, ).
This is also motivated by the observation of dependencies
between different measures. An example is track fragmenta-
tion resistance (TFR) and track coverage rate (TCR). A value
indicating a good track fragmentation resistance becomes
less significant if the track coverage rate is bad because the
TFR is based on only a few matches. If the TFR changes for
the better, but the TCR for the worse, then it can be assumed
that the tracking performance deteriorates.
A complete prioritization of the presented measures is
still an open issue. It is a big challenge as the definition of
Frame 22 Frame 55 Frame 80
(a)
ACR
Object purity
Merge resistance
Split resistance
TR FScore
FNTR
FPTR
FScore
detOvl
Sens
detOvl
Prec
detOvl
FScore
det
Sens
det
Prec
det
FScore
OAM
Sens
OAM
Prec
OAM
0
0.1
0.2
0.3
0.4
0.5
0.6
0.7
0.8
0.9
1
(b)
9080706050403020100
Frames
0
0.2
0.4
0.6
0.8
1
Score
Prec
segm
Sens
segm
Prec
det
Sens
det
FScore
det
Merge resistance
(c)
Figure 15: Example 1: crossing of a person and a car, an extract
from the PETS 2001 training dataset 1. Simulation of algorithm
deficit by merging the two objects. (a) Three screen shots from the
sequence with bounding boxes of GT (top) and results of simulated
detection algorithm (bottom) added. (b) The performance profile
of the simulated algorithm result. (c) The temporal development of
selected measures displays selected measure values for each frame.
good performance depends often on the chosen task. The
amount of measures and their interdependencies further
complicate the prioritization.
Axel Baumann et al. 25
Table 2: Observations (F1–F6) of the behavior of the measures in the performance profile shown in Figure 15(b). Out of these observations,
the above listed assumptions (A1–A3) of the algorithm performance can be made.
F1 Sens
OAM
is nearly maximal, but Prec
OAM
is only around 0.85
F2 The strict detection measures behave the other way round: Prec
det
is maximal, but Sens
det
is approximately 0.7
F3 The lenient detection measures are maximal
F4 FP track resistance (FPTR) and FN track resistance (FPTR) are maximal
F5 Merge resistance is about 0.7
F6 Object purity is about 0.7
A1
F1, F3, F4
no regions with activity were overlooked
A2
F2, F3, F5
some objects were not separated but merged. This can be derived directly from the nonoptimal values of the merge resistance.
The observation is confirmed by the strict Sens
det
being nonoptimal in contrast to the lenient Sens
detOvl
A3
F6
at least one GT object is not being tracked correctly for a significant amount of time
5.2. Sequence subsets for scenario evaluation
As described in Section 2.3, it is important to establish the
results using an appropriate sequence subset. In the case
of perimeter protection, for example, it is of no use to
evaluate the algorithms using sequences containing scenarios
from a departure platform. Then, the performance of the
algorithm will depend on acquisition conditions as well as
sequence content, both containing more or less challenging
situations. For a better evaluation of the algorithms, dividing
the sequences into subsets and analyzing each condition
separately are often necessary.
Furthermore, different parameter settings might be used
in the system for day and night scenarios, or other acquisition
conditions. Then, the algorithm should be evaluated for
each of these scenarios separately on representative sequence
sets. However, in practice, the surveillance system will
either run on one parameter set the whole time, or it will
need to determine the different conditions itself and switch
the parameters automatically. Therefore, a wide variety of
acquisition conditions need to be evaluated for an overall
behavior of the system.
In the ATE, the algorithms are evaluated on all available
sequences. For the evaluation task, individual subsets of these
sequences can then be chosen for deeper investigations of
algorithm performance.
5.3. Performance profiles
Parallel visualization of multiple measure values represents
the performance profile for one or several aspects for the
different algorithm versions simultaneously. The bars of
the resulting measures of the two versions to be compared
are always arranged next to each other. This method
immediately highlights to improvements or deterioration.
Evaluating the performance profile requires experience, since
the metrics are subject to certain dependencies. Isolated
observation of some measures, for example, regarding
precision without sensitivity, is thus not very reasonable
either.
Due to the amount of different measures, displaying
them all together in a performance profile is not feasible.
For a specific evaluation task, typically only a certain subset
is of interest. For example, a developer who is interested in
evaluating changes to a tracking algorithm does not want to
regard classification measures. Therefore, a preselection of
measures to be displayed is usually done.
To demonstrate how metrics reflect the weaknesses of
algorithms, two short sections of the well-known PETS 2001
dataset [8] were chosen and typical errors like merging and
disturbance regions were simulated by labeling them. From
the manually generated AR data and the corresponding GT,
selected measures were computed and will be analyzed in the
following.
5.3.1. Example 1: reading performance profiles
Figure 15(a) shows the first simple example from the PETS
2001 training dataset 1, where the passing of a car and a
person can be seen. Here, it is simulated that the video
analysis system is not capable of tracking both objects
separately but rather merging them into a single object.
Usually, the measures are regarded without knowing
which errors the algorithm has made. With the help of
aperformanceprofile(seeFigure 15(b)), the performance
and shortcomings of the algorithm can be analyzed. Thus,
the task is to draw conclusions concerning the algorithm
behavior out of the observed measures. For our example, the
observations and subsequent assumptions can be found in
Ta bl e 2.
The temporal development of the measures
(Figure 15(c)) displays effectively the frames in which
measures are affected. The upward trend of the curve
representing Prec
OAM
is mostly due to the effects of the
approximation using the bounding box. At the beginning
of the merge, a large bounding box is spanned over both