Báo cáo hóa học: "Origin of Capacity Fading in Nano-Sized Co3O4 Electrodes: Electrochemical Impedance Spectroscopy Study" pdf
Bạn đang xem bản rút gọn của tài liệu. Xem và tải ngay bản đầy đủ của tài liệu tại đây (376.47 KB, 5 trang )
NANO EXPRESS
Origin of Capacity Fading in Nano-Sized Co
3
O
4
Electrodes:
Electrochemical Impedance Spectroscopy Study
Jin-Gu Kang Æ Young-Dae Ko Æ Jae-Gwan Park Æ
Dong-Wan Kim
Received: 26 August 2008 / Accepted: 11 September 2008 / Published online: 25 September 2008
Ó to the authors 2008
Abstract Transition metal oxides have been suggested as
innovative, high-energy electrode materials for lithium-ion
batteries because their electrochemical conversion reac-
tions can transfer two to six electrons. However, nano-sized
transition metal oxides, especially Co
3
O
4
, exhibit drastic
capacity decay during discharge/charge cycling, which
hinders their practical use in lithium-ion batteries. Herein,
we prepared nano-sized Co
3
O
4
with high crystallinity using
a simple citrate-gel method and used electrochemical
impedance spectroscopy method to examine the origin for
the drastic capacity fading observed in the nano-sized
Co
3
O
4
anode system. During cycling, AC impedance
responses were collected at the first discharged state and at
every subsequent tenth discharged state until the 100th
cycle. By examining the separable relaxation time of each
electrochemical reaction and the goodness-of-fit results, a
direct relation between the charge transfer process and
cycling performance was clearly observed.
Keywords Nano-sized Co
3
O
4
Á Li-ion batteries Á
Capacity fading Á Electrochemical impedance
spectroscopy Á Charge transfer reaction
Introduction
The development of rechargeable lithium-ion batteries with
higher specific capacity, higher power density, and longer
cycle life is one of the key issues in the field of portable
energy storage devices. The nanostructuring of electrode
materials has therefore recently attracted much attention
due to the short transport length of both electron and lith-
ium ions, higher electrode/electrolyte contact area, and
better accommodation of the strain during cycling [1–3].
Especially, nano-sized transition metal oxides (M
x
O
y
:
M = Co, Fe, Ni, Cu, Mn, etc.) are considered feasible
anode alternatives because of their high-specific capacities
induced by conversion reaction mechanism, which was first
proposed and elucidated by Poizot et al. [4]. This mecha-
nism is characterized by the full reduction of transition
metal oxides to nanograin metal particles embedded in the
electrochemically reversible amorphous Li
2
O matrix,
which differs from the classical Li insertion/deinsertion or
alloying/dealloying processes. Therefore, numerous studies
have performed electrochemical evaluation of such tran-
sition metal oxides as cobalt oxides, iron oxides, nickel
oxides, and copper oxides for application as the anode
material in lithium-ion batteries [4–10].
In particular, many investigations have recently focused
on nanostructure Co
3
O
4
as a promising anode alternative
due to its higher theoretical capacity (890 mAh/g) com-
pared to that of commercialized carbonaceous material
(theoretical capacity: 392 mAh/g) which is now becoming
limited owing to its low capacity. Extensive efforts have
been made with the aim of achieving high electrochemical
performances for lithium-ion batteries through the appli-
cation of one-dimensional (1D) Co
3
O
4
nanowires [11, 12],
nanostructured Co
3
O
4
thin films fabricated by electro-
chemical deposition method [13] or pulsed laser deposition
[14], nanoparticulate Co
3
O
4
powders [15–17], and nano-
particle Co
3
O
4
/carbon composites [18, 19]. However,
despite such efforts and the high reversible discharge and
charge capacities, almost all nano-sized Co
3
O
4
systems
exhibit unstable cycle characteristics upon cycling, and in
J G. Kang Á Y D. Ko Á J G. Park Á D W. Kim (&)
Nano-materials Research Center, Nano-science Research
Division, Korea Institute of Science and Technology,
Seoul 136-791, South Korea
e-mail:
123
Nanoscale Res Lett (2008) 3:390–394
DOI 10.1007/s11671-008-9176-7
particular suffer drastic capacity fading at a specific cycle
number [11–13, 15, 17–19]. This detrimental phenomenon
has been attributed to the aggregation of active nanograins
[18], eventually leading to the electrical disconnection of
active materials to current collector or conductive addi-
tives. Nevertheless, except for transmission electron
microscopy (TEM) observations [15], few experimental
approaches have been performed to examine this phe-
nomenon in detail.
In this letter, we report on the simultaneous observation
of variation in electrochemical impedance spectroscopy
(EIS) data upon cycling, in order to examine the origin of
the drastic capacity fading suffered in the nano-sized
Co
3
O
4
anode system. In addition, the intimate association
of cycling performance with the impedance elements in
equivalent circuit analogs by fit experimental data is
discussed.
Experimental
Co
3
O
4
nanopowders were prepared using the citrate-gel
method. Anhydrous citric acid, HOC(CH
2
CO
2
H)
2
ÁCO
2
H,
was added as the polymerization agent to Co(NO3)
2
Á6H
2
O
dissolved in 1 L deionized water under stirring. The molar
concentration of Co ions and the molar ratio of citric acid
to Co ions were adjusted to 0.18 M and 1.333:1, respec-
tively. The as-produced sol was dried at 100 °Cina
vacuum oven to produce purple, rigid, glassy gels. These
gels were calcined at 400 °C for 12 h in air atmosphere to
obtain the crystalline Co
3
O
4
nanopowders.
The morphological and structural characteristics of the
as-synthesized Co
3
O
4
powders were investigated using
powder X-ray Diffraction (XRD, Model M18XHF, Mac-
Science Instruments) pattern and TEM (Model JSM-6330F,
JEOL). In addition, the lattice fringes in a Co
3
O
4
nano-
particle observed by high resolution TEM (HRTEM) were
analyzed by means of fast Fourier transformation (FFT)
method to acquire crystallographic information.
To prepare positive electrodes for the electrochemical
tests, a mixture of 67 wt% Co
3
O
4
(2–3 mg) with 20 wt%
Super P carbon black (MMM Carbon, Brussels, Belgium)
and 13 wt% Kynar2801 binder (PVdF-HFP) dissolved in
1-methyl-2-pyrrolidinone (NMP) solvent was cast onto a
Cu foil. After eliminating the solvent in a vacuum oven at
100 ° C, Swagelok-type cells were assembled in an argon-
filled glove box. The assembled cells consisted of Co
3
O
4
-
based composites fabricated onto Cu foil as the positive
electrode, Li metal foil as the negative electrode, and
Celgard 2400 separator saturated with a 1 M LiPF
6
elec-
trolytic solution in 1:1 volume ratio of ethylene carbonate
to dimethyl carbonate. The cells underwent cyclic vol-
tammetry (CV) by collecting current signal with a
sweeping voltage (scan rate: 0.1 mV/s) over a range from
0.01 to 3.0 V in an electrochemical measurement unit
(Solartron 1280C, UK). Furthermore, the assemble cells
were galvanostatically cycled in the voltage window of
0.01–3.0 V at room temperature by means of an automatic
battery cycler (WBCS 3000, WonATech, Korea).
To provide direct experimental evidence for the origin of
the drastic decay of specific capacities from a certain point,
EIS measurements were performed on the same unit (So-
lartron 1280C, UK). A lithium-ion half cell with an initial
OCV over 3.0 V was galvanostatically (1C = 890 mA/g)
discharged to 0.01 V, after which the impedance spectra
were potentiostatically (0.01 V) obtained by imposing AC
perturbation of 5 mV amplitude over the frequency range
from 20 kHz to 1 mHz. Upon the following charge/dis-
charge cycles, these sequential steps were repeated from the
10th to 100th discharged states at an interval of 10 cycles. For
quantitative analysis, the data collected from the EIS mea-
surement was curve-fitted by using Z-view software (version
2.90).
Results and Discussions
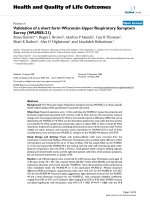
The XRD pattern depicted in Fig. 1a is indicative of the
formation of phase-pure Co
3
O
4
phase based on cubic spinel
structure (space group: Fd3m), showing the main Bragg’s
reflection peak in the (311) plane. Moreover, analysis of
the (311) peak with the Scherrer equation, D = 0.94k/(B
cos h), indicated that the primary particle size of the Co
3
O
4
nanopowders was approximately 20 nm (D: average
dimension of crystallites, k: wavelength of X-ray, B: full
width at half maximum of a reflection located at 2h).
Spherical nanoparticulate morphology with an average
particle size from 20 to 30 nm was identified in Fig. 1b and
c, which is in good agreement with result calculated by the
Scherrer equation. In addition, the high crystallinity of
these nanoparticles was clearly evident in the HRTEM
lattice fringes of the Co
3
O
4
nanoparticle in the magnifying
square region in Fig. 1c, as shown in Fig. 1d. The mea-
sured lattice spacings in the FFT pattern of Fig. 1e also
supported the formation of the Co
3
O
4
phase.
The galvanostatic cycling characteristics of nano-sized
Co
3
O
4
powders in the configuration of the Co
3
O
4
/Li half
cell were investigated over the 0.01–3.0 V voltage window
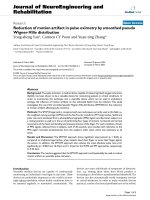
at a rate of C/5 (=178 mA/g) during 100 cycles. In the
charge/discharge voltage profiles in Fig. 2a, a long voltage
plateau appears near 1.05 V, in association with the con-
version reaction of Co
3
O
4
to Co and Li
2
O (Co
3
O
4
?
3Co ? 4Li
2
O). The following sloping part, where the cell is
reduced from 1.05 V down to 0.01 V, leads to the evolution
of an extra capacity due to the formation of Li-bearing
gel-like polymeric layers [7]. The variation of the discharge
Nanoscale Res Lett (2008) 3:390–394 391
123
and charge capacities with cycle number is exhibited in
Fig. 2b, along with the theoretical capacity (890 mAh/g,
dotted line). The first discharge and charge capacities were
1237 and 835 mAh/g, respectively, indicating a coulombic
efficiency of 73%. The capacity loss may have resulted from
the formation of a solid electrolyte interface (SEI) layer due
to electrolyte decomposition. The electrochemical cycling of
nano-sized Co
3
O
4
was stable for the initial 20 cycles, with
the capacity being maintained close to the theoretical
capacity. However, Fig. 2b shows the drastic capacity fad-
ing from the 20th cycle, suggesting a drastic loss in the
electrochemical activity for the Co
3
O
4
electrode.
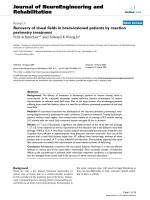
The family of Nyquist plots at each discharged state is
presented in Fig. 3a, with the data collected from high to
medium frequency ranges (20 kHz–10 Hz). An electro-
chemical process typically involves various reactions or
steps such as lithium-ion conduction inside SEI layers,
charge transfer at the SEI layers/electrolyte interface
(electrical double layer), electronic conduction through the
bulk composite electrode, solid-state diffusion, and pseudo-
capacitive behavior due to charge accumulation inside the
particle [20–22]. As the relaxation time constant is specific
to each individual reaction, the variation of each constant
among different reaction can be separated by sweeping an
AC frequency signal if a resoluble difference is detected
among them. From this point of view, two distinctive,
depressed semicircular arcs (not fully developed arc in
Section II due to high frequency limitation) can be
observed in the inset of Fig. 3a (20th cycle). Although
modeling of this impedance spectra by equivalent circuit
analogs usually introduces vagueness at low frequency
Fig. 1 a XRD pattern of nano-
sized Co
3
O
4
with cubic spinel
structure, b and c typical low-
magnification images of nano-
sized Co
3
O
4
, d magnified
HRTEM images of a selected
region in c, and e FFT pattern
calculated from a single Co
3
O
4
nanoparticle
Fig. 2 Galvanostatic electrochemical evaluation of nano-sized
Co
3
O
4
/Li half-cell at a rate of C/5 during 100 cycles: a discharge/
charge voltage profiles between 0.01 and 3.0 V at a rate of C/5, and b
plot of discharge/charge capacities against cycle number. The closed
and open circular symbols denote the discharge and charge capacities,
respectively. The closed triangular symbol indicates coulombic
efficiency
392 Nanoscale Res Lett (2008) 3:390–394
123
ranges, including Warburg diffusive and pseudo-capacitve
components, quantitative analysis can be performed by
using the generally accepted equivalent circuit at high-to-
medium frequency ranges, as depicted in the inset of
Fig. 3a.
An equivalent circuit is made up of a serial connection
of (I) R
el
, (II) R
sei
//CPE
sei
(CPE
sei
parallel to R
sei
), and (III)
R
ct
//CPE
dl
, which represent the ionic resistance of the
electrolyte, ionic conduction inside the SEI layers, and
charge transfer reaction at the electrode/electrolyte inter-
face, respectively. R
i
denotes the resistance of each process
and constant phase element (CPE
i
) stands for the capaci-
tance, rather than the pure capacitance (C), in order to reflect
the non-homogeneous nature of the porous composite
electrode, resulting in a depressed semicircular shape [23,
24]. By curve fitting of the Nyquist plots with this circuit
model, we obtained reliable quantitative values of each
circuit element supported by chi-square (v
2
) of the order of
10
-5
–10
-4
. Furthermore, both semicircles increased with
increasing cycle number, as shown in Fig. 3b in detail. This
indicated that lithium-ion conduction inside the SEI layers
and charge transfer at the electrode/electrolyte interface
became hindered upon subsequent cycles. As can be seen,
the distinctive feature of two semicircles began to vanish
from the 40th cycle, eventually transforming to one semi-
circle-like characteristic. This result may have arisen from
the evolution of indistinguishable relaxation times between
the two processes since the resistive components of both
reactions gradually increase.
By curve-fitting Nyquist plots in Fig. 3 for quantitative
analysis, the variation of R
sei
and R
ct
during cycling was
obtained (Fig. 4). The R
sei
values, as a measure of the hin-
drance for lithium-ion conduction through the SEI layers,
slightly decreased in the initial 50 cycles but then rapidly
increased in the following cycles. This behavior is indicative
of the stabilization of SEI layers achieved during the initial
50 cycles, which does not support the sudden decay of
capacity from the 20th cycle with R
sei
. Interestingly, R
ct
dramatically increased as the cycling continued from the
20th cycle. Considering that the charge transfer at the
electrode/electrolyte interface is usually interpreted as the
reaction expressed by the Butler–Volmer type equation [25,
26], the sudden change in feasible processes involved in
Fig. 3 a Family of Nyquist plots collected from the 1st and 10th–
100th discharged states (at 10-cycle intervals) over a frequency range
from 20 kHz to 10 Hz, including an equivalent circuit analog for
curve fitting. b Magnified view of Nyquist plots for the 20th, 40th,
70th, and 100th discharged states to show the disappearance of the
border between SEI and charge transfer contribution
Fig. 4 The resistive components of SEI and charge transfer reaction
according to the cycle number, as calculated from previous Nyquist
plots by curve fitting
Nanoscale Res Lett (2008) 3:390–394 393
123
charge transfer as the partial desolvation reaction, adsorp-
tion, and surface diffusion of lithium-ions on the electrode
surface are postulated as the origins of the drastic capacity
fading. Nano-sized electrode materials offer good charge
transfer kinetics due to their shorter path lengths. However,
Co
3
O
4
materials undergo a large volume change of around
100% due to the electrochemical conversion reaction,
thereby introducing mechanical stress and subsequent
microstructural failure that prevent efficient electronic
conductive paths and increase the charge transfer resistance
[7]. As mentioned earlier, the charge transfer resistance
should be increased by the hindrance to charge transfer
reaction at the electrode/electrolyte interface. Indeed, the
increase in internal defects and isolated active regions which
hardly react with the electrolyte can increase the charge
transfer resistance during continued cycling in nano-sized
Co
3
O
4
electrodes. Here, the trend in charge transfer resis-
tance was in good agreement with the charge and discharge
capacity behavior upon cycling shown in Fig. 2b. Therefore,
the origin of drastic capacity decay was attributed to the
increase in charge transfer resistance of the Co
3
O
4
elec-
trodes, i.e., the suppression of reaction between Li-ions and
electrons at the electrode/electrolyte interface upon cycling.
Conclusion
In the present work, Co
3
O
4
nanopowders were successfully
synthesized using the citrate-gel method. The XRD patterns
and TEM results demonstrated the formation of a cubic
spinel Co
3
O
4
material with homogeneous particle size
(average size: 20–30 nm). Using powerful AC EIS analysis,
we demonstrated unstable cycle features, drastic capacity
fading in nano-sized Co
3
O
4
, and the variation of resistive
components (SEI layers and charge transfer) according to
the cycle number. In addition, we clearly ascertained the
direct association of charge transfer resistance with capacity
fading features. Although further analytical study based on
AC impedance needs to be performed in order to reveal the
full complexity of this issue, the present study results have
illuminated the applicability of various new approaches for
examining the cycling stability performances of other
electrochemical conversion electrode materials.
References
1. J.M. Tarascon, M. Armand, Nature 414, 359 (2001). doi:10.1038/
35104644
2. A.S. Arico, P. Bruce, B. Scrosati, J.M. Tarascon, W.V. Schalkwijk,
Nat. Mater. 4, 366 (2005). doi:10.1038/nmat1368
3. C. Jiang, E. Hosono, H. Zhou, Nanotoday 1, 28 (2006)
4. P. Poizot, S. Laruelle, S. Grugeon, L. Dupont, J.M. Tarascon,
Nature 407, 496 (2000). doi:10.1038/35035045
5. D. Larcher, G. Sudant, J.B. Leriche, Y. Chabre, J.M. Tarascon, J.
Electrochem. Soc. 149, A234 (2002). doi:10.1149/1.1435358
6. S. Grugeon, S. Laruelle, R. Herrea-Urbina, L. Dupont, P. Poizot,
J. Electrochem. Soc. 148, A285 (2001). doi:10.1149/1.1353566
7. S. Laruelle, S. Grugeon, P. Poizot, M. Dolle, L. Dupont, J.M.
Tarascon, J. Electrochem. Soc. 149, A627 (2002). doi:10.1149/
1.1467947
8. D. Larcher, D. Bonnin, R. Cortes, I. Rivals, L. Personnaz, J.M.
Tarascon, J. Electrochem. Soc. 150, A1643 (2003). doi:10.1149/
1.1622959
9. A. Debart, L. Dupont, P. Poizot, J.B. Leriche, J.M. Tarascon, J.
Electrochem. Soc. 148, A1266 (2001). doi:10.1149/1.1409971
10. D. Larcher, C. Masquelier, D. Bonnin, Y. Charbre, V. Masson,
J.B. Leriche et al., J. Electrochem. Soc. 150, A133 (2003). doi:
10.1149/1.1528941
11. K.T. Nam, D.W. Kim, P.J. Yoo, C.Y. Chiang, N. Meethong,
P.T. Hammond et al., Science 312, 885 (2006). doi:10.1126/
science.1122716
12. K.M. Shaju, F. Jiao, A. Debart, P.G. Bruce, Phys. Chem. Chem.
Phys. 9, 1837 (2007). doi:10.1039/b617519h
13. S.L. Chou, J.Z. Wang, H.K. Liu, S.X. Dou, J. Power Sources 182,
359 (2008). doi:10.1016/j.jpowsour.2008.03.083
14. V. Pralong, J.B. Leriche, B. Beaudoin, E. Naudin, M. Mocrette,
J.M. Tarascon, Solid State Ion. 166, 295 (2004). doi:10.1016/
j.ssi.2003.11.018
15. S. Grugeon, S. Laruelle, L. Dupont, J.M. Tarascon, Solid State
Sci. 5, 895 (2003). doi:10.1016/S1293-2558(03)00114-6
16. X. Wang, X. Chen, L. Gao, H. Zheng, Z. Zhang, Y. Qian, J. Phys.
Chem. B 108, 16401 (2004). doi:10.1021/jp048016p
17. G.X. Wang, Y. Chen, K. Konstantinov, J. Yao, J.H. Ahn, H.K.
Liu, S.X. Dou, J. Alloy Comp. 340, L5 (2002). doi:
10.1016/S0925-8388(02)00005-1
18. R. Yang, Z. Wang, J. Liu, L. Chen, Electrochem. Solid-State Lett.
7, A496 (2004). doi:10.1149/1.1819861
19. S.A. Needham, G.X. Wang, K. Konstantinov, Y. Tournayre, Z.
Lao, H.K. Liu, Electrochem. Solid-State Lett. 9, A315 (2006).
doi:10.1149/1.2197108
20. J.R. Macdonald, Impedance Spectroscopy; Theory, Experiment,
and Applications, 2nd edn. (Wiley, New York, 2005), pp. 444–
446
21. M.D. Levi, D. Aurbach, J. Phys. Chem. B 101, 4630 (1997). doi:
10.1021/jp9701909
22. S. Kobayashi, Y. Uchimoto, J. Phys. Chem. B 109, 13322 (2005).
doi:10.1021/jp044283j
23. P. Yu, J.A. Ritter, R.E. White, B.N. Popov, J. Electrochem. Soc.
147, 2081 (2000). doi:10.1149/1.1393489
24. N. Sharma, G.V. Subba Rao, B.V.R. Chowdari, Electrochim.
Acta 50, 5305 (2005)
25. M. Nakayama, H. Ikuta, Y. Uchimoto, M. Wakihara, J. Phys.
Chem. B 107, 10603 (2003). doi:10.1021/jp036059k
26. S. Kobayashi, Y. Uchimoto, J. Phys. Chem. B 109, 13322 (2005).
doi:10.1021/jp044283j
394 Nanoscale Res Lett (2008) 3:390–394
123