Báo cáo hóa học: " Hot Photoluminescence in c-In2Se3 Nanorods" pptx
Bạn đang xem bản rút gọn của tài liệu. Xem và tải ngay bản đầy đủ của tài liệu tại đây (359.16 KB, 4 trang )
NANO EXPRESS
Hot Photoluminescence in c-In
2
Se
3
Nanorods
M. D. Yang Æ C. H. Hu Æ J. L. Shen Æ
S. M. Lan Æ P. J. Huang Æ G. C. Chi Æ
K. H. Chen Æ L. C. Chen Æ T. Y. Lin
Received: 10 July 2008 / Accepted: 11 September 2008 /Published online: 30 September 2008
Ó to the authors 2008
Abstract The energy relaxation of electrons in c-In
2
Se
3
nanorods was investigated by the excitation-dependent
photoluminescence (PL). From the high-energy tail of PL,
we determine the electron temperature (T
e
) of the hot
electrons. The T
e
variation can be explained by a model in
which the longitudinal optical (LO)-phonon emission is the
dominant energy relaxation process. The high-quality
c-In
2
Se
3
nanorods may be a promising material for the
photovoltaic devices.
Keywords InSe nanorods Á Hot photoluminescence Á
Energy relaxation
Introduction
The III–VI semiconductors have been the subject of many
investigations due to their peculiar electrical and optical
properties, and their potential applications in electronic and
optoelectronic devices [1–4]. Among these semiconduc-
tors, c-In
2
Se
3
has attracted attention because it is suitable
for use in photovoltaic applications [5]. In the recent years,
many researchers have been interested in the synthesis of
the nanoscale materials due to their unique properties and
novel applications in optoelectronic and electronic devices
[6–8]. Although some progress has been achieved regard-
ing the growth and characterization of c-In
2
Se
3
epilayers,
the c-In
2
Se
3
nanostructures have not been grown and
investigated yet. The c-In
2
Se
3
nanostructures may show
potential applications in optoelectronic device such as
lasers, light emitting diodes (LEDs), and solar cells, due to
their high surface-to-volume ratio.
When excess energy is supplied to a carrier by optical
excitation or an applied electric field, the energetic carrier
becomes hot. The hot carriers then relax toward less
energetic state by two competing processes, namely scat-
terings with other carriers and emission of phonons [9].
The understanding of this energy relaxation process con-
stitutes a direct probe of a very fundamental interaction in
condensed matter physics, namely, the electron–phonon
and electron–electron interactions. Also, the subject is of
obvious technological significance since many devices
work mostly in high-field conditions. High electric fields
may lead to carrier heating and, consequently, transport
effects related to the hot carrier distribution function. A
knowledge of hot carrier relaxation mechanisms is thus
essential not only for understanding the fundamental pro-
cess in semiconductor materials but also for evaluating
optical device performance.
M. D. Yang Á C. H. Hu Á J. L. Shen (&)
Department of Physics, Chung Yuan Christian University,
Chung-Li, Taiwan
e-mail:
S. M. Lan
Institute of Nuclear Energy Research, Longtan, Taoyuan 32546,
Taiwan
P. J. Huang Á G. C. Chi
Department of Physics, National Central University,
Chung-Li 320, Taiwan
K. H. Chen
Institute of Atomic and Molecular Sciences Academia Sinica,
Taipei, Taiwan
L. C. Chen
Center of Condensed Matter Science, National Taiwan
University, Taipei, Taiwan
T. Y. Lin
Institute of Optoelectronic Sciences, National Taiwan Ocean
University, Keelung, Taiwan
123
Nanoscale Res Lett (2008) 3:427–430
DOI 10.1007/s11671-008-9173-x
In this study, the single phase c-In
2
Se
3
nanorods on
silicon (111) substrates were grown by metal-organic
chemical vapor deposition (MOCVD). The excitation
power dependence of photoluminescence (PL) in c-In
2
Se
3
nanorods was studied. The high-energy tails of the low-
temperature PL were characterized by effective electron
temperatures which increase with increasing excitation
intensity. It is found the main path of energy relaxation of
the hot electrons in the c-In
2
Se
3
nanorods is the LO-phonon
emission.
Experiment
The c-In
2
Se
3
nanorods were grown on Si (111) substrates
by using an MOCVD system at atmospheric pressure with
a vertical reactor. The liquid MO, a TMIn compound, and
gaseous H
2
Se were employed as the reactant source
materials for In and Se, respectively. The gaseous N
2
was
used as the carrier gas in the process. The substrates used in
this experiment were cut from a 6-inch p-type vicinal
(111)-oriented Si wafer. Before the growth, Si substrates
were baked at 1100 °C for 10 min in gaseous HCl and H
2
to remove the native oxide. After the thermal etching
process, the reactor was cooled down to 425 °C and the
c-In
2
Se
3
started to grow. The gaseous flow rate of TMIn
was kept at 3 lmol/min and that of H
2
Se was controlled at
40 lmol/min. The gaseous H
2
Se was mixed with 85%
hydrogen and 15% H
2
Se. The c-In
2
Se
3
nanorods were
grown at 425 °C during a total growth time of 50 min. The
structure of the c-In
2
Se
3
nanorods was examined by the
X-ray diffraction (XRD) in a h–2h geometry. The XRD
measurements were performed by using the CuKa-radia-
tion (k = 1.541 A
˚
) to test the phases of samples. PL was
made using the Ar-ion laser operating at a wavelength of
514.5 nm. The room-temperature PL measurements were
performed using a confocal microscopy. The collected
luminescence was dispersed by a 0.75 m spectrometer and
detected with a photo-multiplier tube (PMT).
Results and Discussion
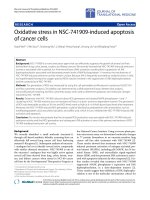
The morphology of the grown c-In
2
Se
3
nanorods was
investigated by the scanning electron microscopy (SEM).
The cross-sectional image of SEM for the c-In
2
Se
3
nano-
rods is shown in Fig. 1, indicating a high density and
narrow size distribution. The crystallographic face of each
nanorod is shown in the inset of Fig. 1, revealing the
hexagonal top end of the c-In
2
Se
3
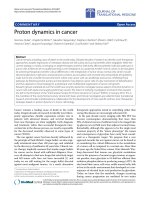
nanorods. The inset of
Fig. 2 shows the XRD pattern of c-In
2
Se
3
nanorods. A high
intensity of the XRD pattern from the Si (111) plane was
clearly observed at 2h = 28.44°. Furthermore, the XRD
reflection from the plane of c-In
2
Se
3
was also observed at
2h = 27.59°, confirming the hexagonal single phase for the
c-In
2
Se
3
nanorods [10]. The 300-K PL spectrum of the
c-In
2
Se
3
nanorods is shown in Fig. 2. A clear PL peak was
observed with the peak position of 1.95 eV, corresponding
to the near band gap edge emission [11]. Observation of the
room-temperature luminescence of the c-In
2
Se
3
nanorods
indicates the good quality of our sample.
In the process of the hot PL, the photoexcitation creates
energetic electrons in the conduction band, which relax
toward less energetic state by transferring energy to the
lattice (via the electron–phonon scattering) and other
electrons (via the electron–electron scattering). If the
electron–electron collision rate is larger than the phonon
emission rate, then the non-equilibrium electron population
in the electron gas relaxes toward a Maxwell distribution
and can be characterized by an T
e
(T
e
) which is higher than
the lattice temperature (T
l
)[12]. Figure 3(a–d) shows the
high-energy tail of the 15-K PL in c-In
2
Se
3
nanorods with
Fig. 1 The c-In
2
Se
3
nanorods morphology obtained by the cross-
section SEM image. The inset shows the top-view SEM image
24 28 32
1.8
XRD Intensity (a.u.)
2 θ (degree)
Si (111)
γ -In
2
Se
3
(006)
PL Intensity (a.u.)
Energy (eV)
2.0 2.2 2.4
Fig. 2 Room-temperature PL of the c-In
2
Se
3
nanorods. The inset
shows the XRD pattern of the c-In
2
Se
3
nanorods
428 Nanoscale Res Lett (2008) 3:427–430
123
different excitation power densities. The spectra show that
the high-energy tail of each PL decreases exponentially
with photon energy, revealing that the PL is related to the
hot carrier recombination. The high-energy tail of each PL
in Fig. 3 can be analyzed by the function [6]:
Ið"hwÞ$expðÀ"hw=E
0
Þ; ð1Þ
where E
0
is the specific energy. With low excitation power,
E
0
reflects the sample quality at low temperatures [6].
Under higher photoexcitation, E
0
can reflect the kinetic
energy of the thermalized electrons and a well-defined T
e
can be extracted. We have fitted the high-energy tail of PL
using Eq. 1, as shown by the solid lines in Fig. 3.
The inverse T
e
versus the excitation power is plotted as
the open squares in Fig. 4. The slope of the inverse T
e
,
displayed as the solid line, corresponds to a value of
19 meV. To find out whether this energy is related to the
phonon energy in c-In
2
Se
3
nanorods, we performed the
Raman scattering measurements. Figure 4 is the Raman
spectrum of c-In
2
Se
3
nanorods, displaying a clear peak
located at 152 cm
-1
, whose energy corresponds
to * 19 meV. Thus, the energy extracted from the slope of
the inverse T
e
is in good agreement with the phonon energy
measured from the Raman scattering. This indicates the
phonon scattering is very efficient in transferring energy
from electrons to the lattice. In other words, the phonon
emission is the dominant energy loss mechanism in the
energy relaxation processes of hot electrons in c-In
2
Se
3
nanorods.
To obtain the energy loss rate per electron from exper-
iments, the power balance equations were used. As the
steady-state electron population increases by increasing the
excitation density, enhanced electron–electron scattering
results in a larger fraction of the available energy being
shared with the electron gas. Thus, the T
e
is determined by
balancing the rate of generation for the energetic electrons
with the rate of energy loss from the electrons to the lattice.
For the photoexcitation, the pump power per electron P
e
given to the electron is [12]
P
e
¼
I
d
W
"hv
0
1
n
; ð2Þ
where I is the laser power absorbed per unit area, d is the
absorption length at laser energy, n is the carrier
concentration, and W is the part of the photon excess
energy obtained by electron. The carrier concentration n
was obtained from the room-temperature Hall-effect
measurements. The open square in Fig. 5 displays the T
e
as a function of the power input per electron (P
e
). If we
assume the dominant process for this relaxation is through
LO-phonon emission and T
e
is much larger than T
l
,then the
energy loss rate per electron due to the LO-phonon
scattering can be given by [13].
PðT
e
Þ¼
E
LO
s
ph
e
x
o
Àx
e
À 1
e
x
o
À 1
e
x
e
= 2
K
0
x
e
= 2ðÞ
ffiffiffiffiffiffiffiffiffiffiffi
p = x
e
p
"#
; ð3Þ
2.145
(B)
(A)
(C)
(D)
Energy (eV)
Intensity (a.u.)
2.150 2.155
Fig. 3 Measured (open squares) and fitted (solid line) of the high-
energy tail of the PL for different excitation power: (a) 353 W/cm
2
,
(b) 530 W/cm
2
,(c) 707 W/cm
2
,(d) 1414 W/cm
2
120 150 180 210
1
0.02
0.03
Raman Shift ( cm
-1
)
Intensity (a.u.)
Power (mW)
1/Tc
(K
-1
)
10
100
Fig. 4 The temperature dependence of PL spectra in the c-In
2
Se
3
nanorods. The inset shows the temperature dependence of peak
position in PL. The solid line in the inset shows the fit according to
Eq. 2
10
-11
10
-10
10
-9
30
45
60
Temperature (K)
Power loss per electron (W)
Fig. 5 The temperature dependence of PL intensity in c-In
2
Se
3
nanorods. The theoretical fit according to Eq. 3 is displayed as the
dashed line
Nanoscale Res Lett (2008) 3:427–430 429
123
where s
ph
is the effective phonon lifetime, E
LO
is the LO-
phonon energy, x
o
¼
E
LO
k
B
T
l
, x
e
¼
E
LO
k
B
T
e
, and K
0
is the modified
Bessel function of the order of zero. In the steady state, the
power input per electron P
e
is equal to the power loss to the
lattice through phonon scattering. Taking values of
19 meV, 1.12910
16
cm
-3
, 2.12, 2.41 eV, 4.8 9 10
-6
cm
for E
LO
, n, W, hm
0
, d, respectively, the solid line in Fig. 4
displays the fitted T
e
with the power loss per electron. Good
agreement between experiments and calculations indicates
that the model based on the carrier scattering by LO-pho-
non is able to explain the measured T
e
variation with
excitation power. It demonstrates again that the LO-phonon
emission is the dominant energy loss mechanism in the
energy relaxation processes of hot electrons in c-In
2
Se
3
nanorods.
Summary
In summary, the c-In
2
Se
3
nanorods were successfully
grown on Si (111) substrates by using MOCVD. A clear
room-temperature PL with the peak position of 1.95 eV
was observed, corresponding to the near band edge emis-
sion. The high-energy tail of PL can be characterized by an
effective T
e
which increases with increasing excitation
intensity. The relationship between the T
e
and the electron
energy loss rate can be explained by a model based on the
carrier scattering by the LO-phonons.
Acknowledgments This project was supported by the National
Science Council under the Grant numbers NSC 93-2112-M-033-010
and 93-2120-M-033-001, and the Center-of-Excellence Program on
Membrane Technology, the Ministry of Education, Taiwan.
References
1. J. Ye, T. Yoshida, Y. Nakamura, O. Nittono, Appl. Phys. Lett. 67,
3066 (1995). doi:10.1063/1.114866
2. A. Zubiaga, J.A. Garcia, F. Plazaola, V. Munoz-Sanjose, C.
Martinez-Tomas, Phys. Rev. B 68, 245202 (2003). doi:10.1103/
PhysRevB.68.245202
3. A.A. Homs, B. Mari, J. Appl. Phys. 88, 4654 (2000). doi:10.1063/
1.1308066
4. B. Gurbulak, Phys. Scr. 70, 197 (2004). doi:10.1088/0031-8949/
70/2-3/020
5. B. Gurbulak, M. Kundakci, A. Ates, M. Yildirim, Phys. Scr. 75,
424 (2007). doi:10.1088/0031-8949/75/4/008
6. T. Stoica, R.J. Meijers, R. Calarco, T. Richter, E. Sutter, H. Luth,
Nano Lett. 6, 1541 (2006). doi:10.1021/nl060547x
7. M. Law, J. Goldberger, P. Yang, Annu. Rev. Mater. Res. 34,83
(2004). doi:10.1146/annurev.matsci.34.040203.112300
8. I.H. Choi, P.Y. Yu, J. Appl. Phys. 93, 4673 (2003)
9. J. Shah, R.C.C. Leite, Phys. Rev. Lett. 22, 1304 (1969). doi:
10.1103/PhysRevLett.22.1304
10. A. Chaiken, K. Nauka, G.A. Gibson, H. Lee, C.C. Yang, J. Wu
et al., J. Appl. Phys. 94, 2390 (2003). doi:10.1063/1.1592631
11. K.J. Chang, S.M. Lahn, J.Y. Chang, Appl. Phys. Lett. 89, 182118
(2006). doi:10.1063/1.2382742
12. J. Shah, Solid-State Electron. 21, 43 (1978). doi:10.1016/0038-
1101(78)90113-2
13. K. Wang, J. Simon, N. Goel, D. Jena, Appl. Phys. Lett. 88,
022103 (2006). doi:10.1063/1.2163709
430 Nanoscale Res Lett (2008) 3:427–430
123