Báo cáo hóa học: " Fabrication and Properties of Ethylene Vinyl Acetate-Carbon Nanofiber Nanocomposites" docx
Bạn đang xem bản rút gọn của tài liệu. Xem và tải ngay bản đầy đủ của tài liệu tại đây (367.5 KB, 8 trang )
NANO EXPRESS
Fabrication and Properties of Ethylene Vinyl Acetate-Carbon
Nanofiber Nanocomposites
Jinu Jacob George Æ Anil K. Bhowmick
Received: 29 June 2008 / Accepted: 3 October 2008 /Published online: 25 October 2008
Ó to the authors 2008
Abstract Carbon nanofiber (CNF) is one of the stiffest
materials produced commercially, having excellent
mechanical, electrical, and thermal properties. The rein-
forcement of rubbery matrices by CNFs was studied in the
case of ethylene vinyl acetate (EVA). The tensile strength
was greatly (61%) increased, even for very low fiber con-
tent (i.e., 1.0 wt.%). The surface modification of the fiber
by high energy electron beam and gamma irradiation led to
better dispersion in the rubber matrix. This in turn gave rise
to further improvements in mechanical and dynamic
mechanical properties of EVA. The thermal conductivity
also exhibited improvements from that of the neat elasto-
mer, although thermal stability of the nanocomposites was
not significantly altered by the functionalization of CNFs.
Various results were well supported by the morphological
analysis of the nanocomposites.
Keywords Nanocomposite Á Carbon nanofiber Á
EVA Á Reinforcement Á Elastomers
Introduction
Carbon nanofibers (CNFs) that are much smaller than
conventional carbon fibers but significantly larger than
carbon nanotubes (CNTs) can be used to produce nano-
composites with excellent properties, which may open up
many new applications. They are available in diameters
ranging from 70 and 200 nm and length estimated to be
50–100 lm[1, 2]. CNFs generally exhibit a bamboo-like
conical structure as observed in transmission electron
micrographs (TEM) (J.J. George and A.K. Bhowmick,
personal communication).
Use of CNFs as reinforcement to improve properties of
various polymer matrix systems like polycarbonate, epoxy,
polyethylene, polypropylene, polymethyl methacrylate,
polyether ether ketone, and polystyrene has already been
demonstrated [3–20]. The results show enhancement in
mechanical [7–10, 19], thermal [7–9], and dielectric/elec-
trical [12–17] properties. The key technical challenges
which remain for such nanofiber-reinforced polymers are
the achievement of a homogeneous dispersion and good
interfacial bonding. The smaller diameter and greater sur-
face area of the nanofibers also imply stronger interactions
among the nanofibers; hence, it is often difficult to disperse
them into a polymer matrix. Thus, if the dispersion of the
nanofibers is less than ideal, it impairs the resultant nano-
composite properties. Making composites with optimal
properties requires adequate fiber-matrix adhesion, which
is governed by the chemical and physical interactions
occurring at the interface. If the fiber to matrix adhesion is
poor, a composite may fail at the interface, reducing in
particular the tensile strength.
In this article, elastomer grade ethylene vinyl acetate
(EVA) having 50% vinyl acetate (VA) content has been
chosen as the base matrix. The properties of the composites
formed with as-received CNFs and various treated nanof-
ibers are compared, with the idea that the modified CNFs
contain surface defect sites and surface polar groups, which
can form intermolecular interactions with the polar mole-
cules in the matrix polymer. The presence of such defect
sites and surface groups on the pristine CNFs is limited.
The quality of the nanofiber dispersion in the polymer
matrix is observed by TEM and is then correlated with the
mechanical, dynamic mechanical, and thermal properties to
J. J. George Á A. K. Bhowmick (&)
Rubber Technology Centre, Indian Institute of Technology,
Kharagpur 721302, India
e-mail:
123
Nanoscale Res Lett (2008) 3:508–515
DOI 10.1007/s11671-008-9188-3
provide insight into the role of the CNF surface modifi-
cation and interfacial interactions on the ultimate properties
of the resultant nanocomposites. In our earlier communi-
cations, we have shown that appropriate modifications of
graphite and multiwalled CNTs can enhance the physico
mechanical properties of the nanocomposites [21, 22].
Experimental
Materials
CNFs (as-grown grade PR-24 AG Pyrograf—IIITM) were
obtained from Applied Sciences Inc., USA. The CNF
consists of a mixture of two distinctive structures present in
the sample, relatively straight cylindrical tubes and the so-
called bamboo tube-like structures, arranged into loose
aggregates. The diameter of CNFs varied between 70 and
200 nm and length between 50 and 100 lm. CNFs used
had an aspect ratio (length-to-diameter) of over 500 in the
as-received state and is free of carbonaceous contamina-
tion. High-resolution TEM micrograph of the surface of
CNF shows stacking of graphene layers, distance between
graphitic planes being 0.334 nm.
EVA elastomer with 50% VA content was supplied by
Bayer (now Lanxess), Germany. The cross-linker for the
rubber phase, dicumyl peroxide (DCP, 99% pure), was
obtained from Hercules India. Triallyl cyanurate (TAC),
the co-agent, was procured from Fluka A G, Germany.
Tetrahydrofuran (THF) of LR grade, used as the solvent for
EVA, was obtained from MERCK (India) Ltd., Mumbai,
India.
Surface Treatment with High-energy Radiations
Electron Beam Irradiation
The CNFs were irradiated by electron beam (EB) accel-
erator (model ILU-6) at BARC, Mumbai, India. Irradiation
doses used were 50, 200, and 800 kGy (dose per pass was
fixed at 10 kGy) at room temperature. A FWT-60 dosim-
eter based on calibration obtained from gamma-radiation
was used for the EB dosimetry. The accelerator voltage
frequency was 100–120 MHz and the energy range was
0.5–2.0 MeV.
Gamma Irradiation
The CNF samples were irradiated with gamma rays at three
different doses -1, 5, and 10 kGy, using GC 5000 (Source:
Co-60) at a dose rate of 3.2 kGy/h. This was carried out at
the gamma irradiation facility in BARC, Mumbai, India.
Chemical Modifications
Amine Treatment
The amination of CNFs was done by treating 200 mg of the
sample with excess of hexamethylene diamine within a
50-mL thick-walled test tube at 130 ± 10 °C in an oil bath
for 24 h. The treated sample was then washed with alcohol
to remove the excess amine followed by washing with
distilled water to remove the alcohol present. The nanofi-
bers were then filtered using nylon membrane filter paper
of 0.45-lm pore size. It was then dried in vacuum oven at
80 °C for 4 h.
Acid Treatment
CNFs (200 mg) were sonicated with H
2
SO
4
/HNO
3
mixture
(3:1) for 3 h at 40 ° C. The treated samples were washed
with distilled water repeatedly until the pH of the mixture
came to 6. The nanofibers were then filtered using nylon
membrane filter paper of 0.45-lm pore size. These were
then dried in vacuum oven at 80 °C for 4 h.
Silane Treatment
CNFs were functionalized via refluxing with 1 g of vinyl-
silane in 25-mL of THF at 80 °C for 8 h. The free radical
reaction was initiated by benzoyl peroxide (0.1 g) added to
the mixture. Modified nanofibers were washed several
times with anhydrous THF.
Table 1 Sample designations
Sample
designation
Description
CNF Untreated carbon nanofiber
CNF
EB-800 kGy
CNF-treated with 800 kGy EB
CNF
c-1 kGy
CNF-treated with 1 kGy Gamma irradiation
ACNF Amine-treated carbon nanofiber
XCNF Acid-treated carbon nanofiber
SCNF Silane-treated carbon nanofiber
EVA Neat elastomer
EVA-1F EVA filled with 1 wt.% of untreated CNF
EVA-4F EVA filled with 4 wt.% of untreated CNF
EVA-8F EVA filled with 8 wt.% of untreated CNF
EVA-1F
EB
EVA filled with 1 wt.% of 800 kGy EB irradiated
CNF
EVA-1F
c
EVA filled with 1 wt.% of 1 kGy Gamma
irradiated CNF
EVA-1AF EVA filled with 1 wt.% of amine treated CNF
EVA-1XF EVA filled with 1 wt.% of acid treated CNF
EVA-1SF EVA filled with 1 wt.% of silane treated CNF
Nanoscale Res Lett (2008) 3:508–515 509
123
All the treated and untreated CNFs were analyzed using
different morphological, elemental, structural, and thermal
characterization techniques. The detailed results of various
characterizations were provided elsewhere (J.J. George and
A.K. Bhowmick, personal communication).
The sample designations are given in Table 1.
Preparation of EVA-CNF Nanocomposites
The nanocomposites were synthesized by using a solution-
mixing technique. EVA (5 g per batch) was dissolved in
50-mL of THF to make 10% solution of the rubber using a
mechanical stirrer. 0.05 g of DCP as the curing agent and
0.05 g of TAC as the co-agent were added to the rubber
solution. The solution was thoroughly stirred using a
mechanical stirrer. CNFs dispersed in THF were first
sonicated for 15 min and subsequently added to the rubber
solution while stirring at room temperature (27 °C). The
final solution was cast over Teflon trays and kept for air
drying followed by vacuum drying at 50 °C till there was
practically no weight variation. The dried films were
molded in a hot press at a pressure of 5 MPa at 150 °C for
an optimum cure time of 25 min, determined from a
Monsanto oscillating disc rheometer (100S).
Morphological Study
The microscopy was performed using a JEOL JEM-2010
(Japan), TEM operating at an accelerating voltage of
200 kV. The composite samples were cut by ultra-cryo-
microtomy using a Leica Ultracut UCT. Freshly sharpened
glass knives with cutting edge of 45° were used to get the
cryosections of 50–70 nm thickness. Since these samples
were elastomeric in nature, the temperature during ultra-
cryomicrotomy was kept at -50 °C (which was well below
the glass transition temperature of EVA). The cryosections
were collected individually on sucrose solution and directly
supported on a copper grid of 300-mesh size.
Morphological comparison of untreated and acid-treated
CNFs was performed using an SEM model JSM800 man-
ufactured by JEOL at 20 kV acceleration voltage at room
temperature.
Mechanical and Dynamic Mechanical Analysis
The mechanical properties of the nanocomposites were
evaluated by a universal testing machine (Zwick 1445) on
dumbbell specimens, punched out from the cast films using
an ASTM Die C. All the tests were carried out as per
ASTM D 412-99 method at 25 ± 2 ° C at a crosshead
speed of 500 mm/min. The average values of three tests for
tensile strength, tensile modulus, and elongation at break
are reported for each sample.
Dynamic mechanical thermal characteristics of the
composite films (0.4–0.6-mm thick) were evaluated by
using a DMTA IV (Rheometric Scientific) under tension
mode. All the data were analyzed using RSI Orchestrator
application software on an ACER computer attached to the
machine. The temperature sweep measurements were made
from -35 to 20 °C. The experiments were carried out at a
frequency of 1 Hz at a heating rate of 2 °C/min. The strain
amplitude used in the DMA test was 0.01% and the soak
time at -35 °C was 3 min. The storage modulus (E
0
) and
the loss tangent (tan d) data were recorded for all the
samples under identical conditions.
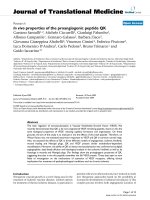
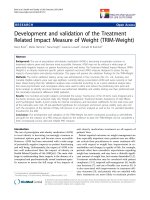
Fig. 1 TEM micrographs of
representative nanocomposites
a EVA-1F, b EVA-4F, c EVA-
8F, d EVA-1F
EB
, e EVA-1F
c
,
and f EVA-1SF
510 Nanoscale Res Lett (2008) 3:508–515
123
Swelling Analysis
The swelling studies of the rubber specimens were carried
out in toluene at ambient conditions (27 °C) for 72 h.
Volume fraction of rubber, V
r
, was calculated using the
following equation [20]
V
r
¼
ðD ÀFTÞq
À1
r
ðD ÀFTÞq
À1
r
þ A
0
q
À1
s
; ð1Þ
where, V
r
is the volume fraction of rubber in the swollen
gel, D the de-swollen weight of the composites, F the
fraction insoluble, T the initial weight of the sample, and A
0
the amount of solvent imbibed. q
r
is the density of the
rubber, while q
s
is density of the swelling solvent.
Thermal Conductivity
The thermal conductivity of the various nanocomposites
was measured as per ASTM C177. The thermal conduc-
tivity was calculated using the equation
K ¼
Wt
A dT
; ð2Þ
where W is the power in Watts (here 4 W), K the thermal
conductivity, t the thickness of sample, A the area of the
sample, and dT the temperature difference between the two
plates.
Thermal Degradation Studies
Thermal stability of the composites was investigated by
thermo gravimetric analysis (TGA) by using a Perkin–
Elmer TGA instrument (Model: Pyris Diamond TG/DTA)
from ambient to 800 °C at a programed heating rate of
20 °C/min in nitrogen. A sample weight of approximately
10 mg was taken for all the measurements. The weight loss
against temperature was recorded. Differential thermo
gravimetric analysis (DTG) of the composites was repre-
sented in terms of the first derivative plots of the TGA
curves. The data points denote the weight loss/time against
temperature at the specified heating rate.
Results and Discussion
Morphological Study by TEM
Figure 1a–f displays the TEM photographs of EVA-1F,
EVA-4F, EVA-8F, EVA-1F
EB
, EVA-1F
c
, and EVA-1SF. It
can be seen that the CNFs are well dispersed in the EVA
matrix up to 4 wt.% loading although there is presence of a
few agglomerates. However, at a higher loading of 8 wt.%,
the agglomerations start dominating, as evident from
Fig. 1c. Various modified CNF filled nanocomposites
exhibit better dispersion of the nanofibers. This can be due
to the improved filler–polymer interaction developed
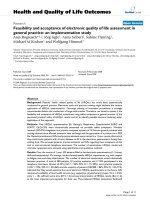
Fig. 2 a Effect of filler loading on the mechanical properties of
nanocomposites. b Effect of EB irradiation dose on the mechanical
properties of nanocomposites. c Effect of gamma irradiation dose on
the mechanical properties of nanocomposites
Nanoscale Res Lett (2008) 3:508–515 511
123
because of the presence of polar groups covalently attached
on the fiber surfaces in addition to generation of surface
defects. The amount of defects on CNFs has been estimated
by calculating the I
D
/I
G
intensity ratio from the Raman
spectra, where, I
D
and I
G
are the intensities of well-known
D and G band peaks of carbon materials, respectively
(J.J. George and A.K. Bhowmick, personal communica-
tion). The ratio between the disorder and the order
transition (I
D
/I
G
) gives the information about the genera-
tion of surface defects due to functionalization. I
D
/I
G
value
of untreated CNF is 0.64. The various modified samples
CNF
EB-800 kGy
, CNF
c-1 kGy
, ACNF, XCNF, and SCNF
have I
D
/I
G
values of 0.77, 0.78, 0.70, 0.84, and 0.68,
respectively. This shows that after various modifications,
the amount of surface defects has increased. The presence
of surface defects increases the effective surface area of
nanofibers and hence their interaction with polymer chains.
The relative concentration of oxygen, attached to C=O
group increases by 5.5% from 28.9 (untreated) to 30.5%
after EB irradiation and increases by 13.1% from 28.9 to
32.7% after gamma irradiation. Similarly, ACNF and
SCNF exhibit presence of respective polar functional
groups (J.J. George and A.K. Bhowmick, personal
communication).
Mechanical and Dynamic Mechanical Analysis
Plotted in Fig. 2a is the variation of tensile properties of
EVA with the incorporation of different amounts of
untreated CNF. The tensile strength exhibits a continuous
increment up to 4 wt.% CNF loading, indicating finer
fiber–polymer interaction up to that level (confirmed from
swelling experiments). An improvement of tensile strength
of 61 and 125% is observed after the addition of 1 and
4 wt.% of CNFs, respectively. Further addition of CNF
(8 wt.%) exhibits a decline in tensile strength due to poor
dispersion and agglomeration of filler particles, as observed
in TEM photograph. The addition of CNF imparts
improvement in tensile modulus as well, as expected from
the addition of any filler. The modulus exhibits a tremen-
dous increment of 350 and 520% with the addition of 4 and
8 wt.% of CNF, respectively. The elongation at break, on
the other hand, shows steep decrement with the amount of
CNF.
The effects of various high-energy treatments of CNFs
on the tensile properties of EVA nanocomposites are dis-
played in Fig. 2b and c. All the tensile properties show
increment with EB dose up to 800 kGy. On the other hand,
gamma irradiation of 1 kGy provides best tensile proper-
ties, beyond which there is no significant improvement. In
Table 2, the tensile properties of EB, gamma, and various
chemically treated CNF-reinforced nanocomposites are
also compared with those of virgin EVA and untreated
CNF-reinforced nanocomposite at 1 wt.% loading. Maxi-
mum improvement in tensile modulus occurs for the
samples EVA-1F
c
and EVA-1SF. The increments are 33
and 31% over the untreated CNF-filled composite, while
the samples EVA-1F
EB
and EVA-1AF display increments
of 20 and 25%, respectively (Table 2). The acid treatment
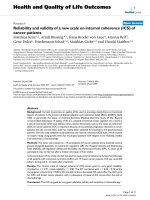
adversely affected the nanocomposite tensile properties (cf.
EVA-1XF). This may be due to the degradation undergone
by the CNF upon acid treatment. The decrease in tensile
properties of XCNF-filled samples are due to the breakage
of the nanofibers. This is evident from the SEM pictures
displayed in Fig. 3a and b.
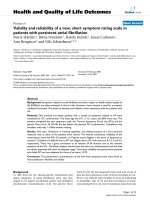
The tan d and storage modulus (inset) of the various
nanocomposites with 1, 4, and 8 wt.% untreated CNFs and
1 wt.% treated CNFs are plotted as a function of temper-
ature in Fig. 4a–c. At -30.8 °C(T
g
of EVA), a modest
enhancement of 5% in the storage modulus is observed
Table 2 Tensile properties of various nanocomposites
Sample Tensile
strength (MPa)
Elongation
at break (%)
Modulus at 100%
elongation (MPa)
EVA 5.05 ± 0.15 490 ± 30 0.74 ± 0.17
EVA-1F 8.14 ± 0.20 410 ± 20 1.04 ± 0.21
EVA-1F
EB
8.53 ± 0.11 465 ± 20 1.25 ± 0.12
EVA-1F
c
8.60 ± 0.15 440 ± 15 1.38 ± 0.15
EVA-1AF 8.25 ± 0.12 432 ± 25 1.30 ± 0.10
EVA-1XF 6.86 ± 0.18 323 ± 30 1.02 ± 0.16
EVA-1SF 8.50 ± 0.10 436 ± 15 1.36 ± 0.14
Fig. 3 SEM micrographs of a
untreated and b acid-treated
CNFs
512 Nanoscale Res Lett (2008) 3:508–515
123
when 1 wt.% untreated CNF was added to the neat EVA
(Table 3). A further increment in the CNF loading to
4 wt.%, enhances the storage modulus by 15% over that of
the neat elastomer at the same temperature. The storage
modulus of EVA-8F is 16% greater than that of unfilled
EVA, at 20 °C.
The glass transition temperature (T
g
) for EVA occurs
at -30.8 °C and there is a marginal shift of 2.4 °CinT
g
toward higher temperature (Table 3) for EVA-1F. A
significant shift of 6.6 °C is observed for the nanocom-
posite with 4 wt.% untreated CNF. For the composite
with 8 wt.% CNF loading, the T
g
is shifted toward lower
temperature region (*2 °C from that of 4 wt.% CNF-
filled sample), showing that at higher loadings filler–filler
interactions start dominating the filler–polymer interac-
tions. The tan d peak heights of all the nanocomposites
are lower than that of the neat EVA film, which confirms
the increase in filler–polymer interaction. When molecu-
lar mobility is restricted due to the presence of
reinforcing fibers, it results in not only enhanced glass
transition temperature, but also in decreased tan d peak
magnitude. The loss modulus versus temperature plots of
the nanocomposites with varying filler loadings provide a
similar trend (data not shown here). The glass transition
temperature appears at still lower temperature. There is
only single T
g
of the nanocomposites and there is no
separate transition for confined EVA chains as effected
by CNF.
Thus, the optimum enhancement in the glass transition
for EVA-1AF indicates that there exists a significant
restriction on the segmental mobility of these polymer
chains, which in turn suggests that the polymer chains are
in close proximity and interact significantly with the
nanofibers and this is further confirmed from the solvent
swelling studies.
Swelling Studies
Table 4 reports the volume fraction of rubber (V
r
) in each
of the cured nanocomposite samples along with that of the
virgin EVA elastomer. V
r
is considered as a measure of the
crosslink density of the sample which in turn represents the
extent of interaction developed between the reinforcement
and the matrix. The higher the V
r
, the higher will be the
polymer–filler interaction. It can be observed from the
table that as the CNF content increases up to 4 wt.%, the
value of V
r
increases and then shows a decrease at higher
loading. This is in agreement with the results obtained from
the results of mechanical and dynamic mechanical prop-
erties. Both high-energy as well as chemically modified
(except acid treated) CNF-reinforced composites exhibit
increased V
r
values, indicating increased interaction due to
the presence of polar groups and defect sites on the
nanofiber surface.
Fig. 4 a Tan d versus temperature and storage modulus versus
temperature (inset) plots of nanocomposites with different filler
loadings. b Tan d versus temperature and storage modulus versus
temperature (inset) plots of EB irradiated CNF-filled nanocomposites.
c Tan d versus temperature and storage modulus versus temperature
(inset) plots of gamma-irradiated CNF-filled nanocomposites
Nanoscale Res Lett (2008) 3:508–515 513
123
Thermal Conductivity
CNFs have a superior intrinsic thermal conductivity of
about 2000 W/mK. However, there is difficulty in trans-
lating this intrinsic property in to a strong composite
property due to the large number of interfaces that any
thermal signal must cross. Addition of CNFs significantly
improves the thermal conductivity of EVA even at low
loading (Fig. 5).
The thermal conductivity shows an increment of 70 and
188% with incorporation of 1 and 4 wt.% of CNFs,
respectively. All the modified CNFs except acid treated one
give rise to improved thermal conductivity for the nano-
composites, as compared to untreated CNF-filled sample.
The samples EVA-1F
EB
and EVA-1F
c
exhibit increments
of 2 and 7%, respectively, over that of EVA-1F, whereas
EVA-1AF and EVA-1SF show improvements of 10 and
29%, respectively. These enhancements are attributed to
the better dispersion and interaction of the nanofibers
within the rubber matrix after modification.
Thermal Degradation Studies of Nanocomposites
The thermal decomposition behavior of all the nanocom-
posites is shown in Fig. 6. The CNF-filled nanocomposites
display higher thermal stability compared with virgin EVA.
The maximum rates of degradation and corresponding
temperatures for various nanocomposites are reported in
Table 5. The temperature of maximum rate of degradation,
T
Max
, is marginally shifted by 3 and 8 °C for EVA-1F and
EVA-4F, respectively. This might have resulted from the
good interaction between EVA and CNFs and can be
explained by the restrictions on the mobility of the mac-
romolecules imposed by the CNFs. Since these fibers have
nanodimensions, they impose a vast number of restriction
sites, causing a reduction in tension induced by thermal
excitation in the carbon–carbon bond. Consequently, the
Table 3 Dynamic mechanical analysis data of various
nanocomposites
Sample T
g
(°C) Storage modulus (MPa) Tan d
T
g
20 °C T
g
20 °C
EVA -30.8 7.68 6.10 1.09 0.22
EVA-1F -29.4 7.38 6.13 0.85 0.17
EVA-4F -24.2 7.56 6.20 0.89 0.16
EVA-8F -26.4 8.38 7.07 0.69 0.14
EVA-1F
EB
-29.4 7.86 6.17 0.85 0.17
EVA-1F
c
-30.4 7.87 6.24 0.85 0.17
EVA-1AF -21.5 7.84 6.28 0.98 0.16
EVA-1XF -27.2 7.79 6.09 0.92 0.15
EVA-1SF -25.9 7.92 6.15 0.93 0.16
Table 4 Volume fraction of rubber in the swollen polymer mass (V
r
)
of various samples
Sample Volume fraction of rubber (V
r
)
EVA 0.11
EVA-1F 0.17
EVA-4F 0.28
EVA-8F 0.24
EVA-1F
EB
0.19
EVA-1F
c
0.20
EVA-1AF 0.19
EVA-1XF 0.14
EVA-1SF 0.20
Fig. 5 Thermal conductivity of various nanocomposites
Fig. 6 TGA and DTG plots of various nanocomposites
514 Nanoscale Res Lett (2008) 3:508–515
123
thermal stability of the polymer increases significantly.
However, various modified CNF-reinforced composites do
not show any significant improvement in thermal stability
at 1 wt.% loading when compared to the untreated CNF-
filled ones. EVA-1XF reduces T
Max
because of the reasons
described earlier.
Conclusions
Introduction of a small amount of CNFs can lead to
improved performance of EVA. At 4 wt.% CNF loading,
the modulus and the tensile strength of the nanocomposite
increased substantially. However, similar improvements
were not observed at higher (8 wt.%) nanofiller loading
due to filler agglomeration. Surface treatment of CNFs with
high-energy irradiations of EB and gamma irradiation
resulted in improved fiber to matrix interaction, which was
supported by swelling resistance studies. This in turn
enhanced the dispersion and wetting properties of the
nanofibers leading to further improvements in mechanical,
dynamic mechanical, and thermal properties of the nano-
composites. At similar loading of filler (1 wt.%), EVA-1SF
and EVA-1F
c
exhibited the best overall properties. The
morphological studies revealed that the modified CNFs
were better dispersed and distributed in the elastomer
matrix at low loadings.
Acknowledgment The authors acknowledge the financial assistance
provided by DRDO, New Delhi, India.
References
1. . Accessed 12 December 2007
2. G.G. Tibbetts, M.L. Lake, K.L. Strong, B.P. Rice, Compos. Sci.
Technol. 1709, 67 (2007)
3. P. He, Y. Gao, J. Lian, L. Wang, D. Qian, J. Zhao, W. Wang, M.J.
Schulz, X.P. Zhou, D. Shi, Composites Part A 1270, 37 (2006)
4. T. Prasse, J.Y. Cavaille, W. Bauhofer, Compos. Sci. Technol.
1835, 63 (2003)
5. Y.K. Choi, K. Sugimoto, S.M. Song, Y. Gotoh, Y. Ohkoshi, M.
Endo, Carbon 43(10), 2199 (2005)
6. W. Brandl, G. Marginean, V. Chirila, W. Warschewski, Carbon
5, 42 (2004)
7. M.C. Galetz, T. Bla, H. Ruckdaschel, J.K.W. Sandler, V. Alts-
tadt, U. Glatzel. J. Appl. Polym. Sci. 4173, 104 (2007)
8. K. Lozano, S. Yang, R.E. Jones, Carbon 2329, 42 (2004)
9. S. Kumar, H. Doshi, M. Srinivasarao, J.O. Park, D.A. Schiraldi,
Polymer 1701, 43 (2002)
10. J. Zeng, B. Saltysiak, W.S. Johnson, D.A. Schiraldi, S. Kumar,
Composites Part B 173, 35 (2004)
11. J. Sandler, A.H.W. Indle, P. Werner, V. Altstadt, M.V. Es, M.S.P.
Shaffer, J. Mater. Sci. 2135, 38 (2003)
12. Y. Yang, M.C. Gupta, K.L. Dudley, R.W. Lawrence, Nanotech-
nology 1545, 15 (2004)
13. S. Yang, R. Benitez, A. Fuentes, K. Lozano, Compos. Sci.
Technol. 1159, 67 (2007)
14. E. Hammel, X. Tang, M. Trampert, T. Schmitt, K. Mauthner, A.
Eder, P. Potschke, Carbon 1153, 42 (2004)
15. R.L. Jacobsen, D.G. Glasgow, in Proceedings of the American
Society for Composites, 14th Technical Conference (Applied
Sciences, Inc., Cedarville, OH, 1999), p. 987
16. A. Michael, K. Hilmar, T. Barney, A. Max, V. Richard, Polym.
Prepr. (Am. Chem. Soc. Div. Polym. Chem.) 47(1), 476 (2006)
17. Y. Yang, M.C. Gupta, K.L. Dudley, R.W. Lawrence, Nanotech-
nology 1545, 15 (2004)
18. C. Gauthier, L. Chazeau, T. Prasse, J.Y. Cavaille, Compos. Sci.
Technol. 335, 65 (2005)
19. P. Richard, T. Prasse, J.Y. Cavaille, L. Chazeau, C. Gauthier, J.
Duchet, Mater. Sci. Eng. A 344, 352 (2003)
20. Y. Gao, P. He, J. Lian, M.J. Schulz, J. Zhao, W. Wang, X. Wang,
J. Zhang, X. Zhou, D. Shi, J. Appl. Polym. Sci. 103(6), 3792
(2007)
21. J.J. George, A. Bandyopadhyay, A.K. Bhowmick, J. Appl.
Polym. Sci. 108(3), 1603 (2008). doi:10.1002/app.25067
22. J.J. George, R. Sengupta, A.K. Bhowmick, J. Nanosci. Nano-
technol. 8(4), 1913 (2008)
Table 5 Thermal degradation data of various nanocomposites
Sample Temperature at
which maximum
degradation occurs (°C)
Maximum rate
of degradation
(°C/min)
EVA 462 1.46
EVA-1F 465 1.45
EVA-4F 470 1.35
EVA-1F
EB
465 1.46
EVA-1F
c
465 1.43
EVA-1AF 465 1.44
EVA-1XF 459 1.50
EVA-1SF 466 1.43
Nanoscale Res Lett (2008) 3:508–515 515
123