Báo cáo hóa học: " Effects of Shape and Strain Distribution of Quantum Dots on Optical Transition in the Quantum Dot Infrared " doc
Bạn đang xem bản rút gọn của tài liệu. Xem và tải ngay bản đầy đủ của tài liệu tại đây (867.27 KB, 6 trang )
NANO IDEAS
Effects of Shape and Strain Distribution of Quantum Dots
on Optical Transition in the Quantum Dot Infrared
Photodetectors
X F. Yang Æ X S. Chen Æ W. Lu Æ Y. Fu
Received: 24 July 2008 / Accepted: 11 September 2008 / Published online: 21 October 2008
Ó to the authors 2008
Abstract We present a systemic theoretical study of the
electronic properties of the quantum dots inserted in
quantum dot infrared photodetectors (QDIPs). The strain
distribution of three different shaped quantum dots (QDs)
with a same ratio of the base to the vertical aspect is cal-
culated by using the short-range valence-force-field (VFF)
approach. The calculated results show that the hydrostatic
strain e
H
varies little with change of the shape, while the
biaxial strain e
B
changes a lot for different shapes of QDs.
The recursion method is used to calculate the energy levels
of the bound states in QDs. Compared with the strain, the
shape plays a key role in the difference of electronic bound
energy levels. The numerical results show that the defer-
ence of bound energy levels of lenslike InAs QD matches
well with the experimental results. Moreover, the pyramid-
shaped QD has the greatest difference from the measured
experimental data.
Keywords Quantum dots Á PL spectrum Á Strain Á
QDIP
Introduction
Due to three-dimensional confinement for electrons in the
quantum-dot structure, quantum-dot infrared photodetec-
tors (QDIPs) have attracted much attention for theoretical
and experimental studies in recent years [1–3]. One
important characteristic for QDIPs is the sensitivity to
normal-incidence infrared radiation which is advantage to
focal plane arrays. The longer lifetime of excited electrons
inspirited by the greatly suppressed electron–phonon
interaction makes the QDIPs have another advantages of
displaying low dark current, large detectivity, and better
response [4]. The introduction of strain may provide a
facile way to fabricate various wavelength from mid-
wavelength to long-wavelength multicolor infrared (IR)
detectors via InAs or InGaAs quantum dot (QD) capped by
GaAs, InGaAs, InP, or GaInP. Meanwhile, the geometry
shape of QDs always results in quite different responding
wavelength for QDIPs [5]. Nowadays, more complicated
nanostructures, such as QD molecules are investigated for
the potential use of photoelectric devices [6]. It is well
known that the much sensitivity of QD’s bound energy
levels to the shape, size, and strain provides the detector
greater potential to obtain the ideal responding wavelength
for the application of medical or molecular application. So
the study of the shape, size, and strain of QD system has
been an interesting subject for the development and pre-
cious controlling of the QDIPs structure.
Much theoretical and experimental work has been done
to explore the effect of the shape, size, or strain of QDs on
the bound energy levels or the possible optical transition.
The bound energy levels in fat lenslike QD basing on the
quantum-well approximate theoretical results have a bigger
difference by comparing to the experimental results. In
wojs’ work, the energy levels of lenslike In
0.5
Ga
0.5
As/
X F. Yang (&) Á X S. Chen Á W. Lu (&)
National Lab for Infrared Physics, Shanghai Institute
of Technical Physics, Chinese Academy of Sciences,
500 Yutian Road, 200083 Shanghai, China
e-mail: xfl
W. Lu
e-mail:
Y. Fu
Department of Theoretical Chemistry, School of Biotechnology,
Royal Institute of Technology, AlbaNova, Stockholm 106 91,
Sweden
123
Nanoscale Res Lett (2008) 3:534–539
DOI 10.1007/s11671-008-9175-8
GaAs QD were studied as a function of the dot’s size, and
found that the parabolic confining potential and its corre-
sponding energy spectrum were shown to be and excellent
approximation [7]. Here, we calculate the strain energy of
self-assembled QDs with the short-range valence-force-
field (VFF) approach to describe inter-atomic forces by
using bond stretching and bending. The role of strain (for
three different shapes) in determining the bound levels is
analyzed in detail. Considering three different shape QDs
with the same ratio of the base to the vertical aspect 3:1,
the bound energy levels are calculated by the recursion
method [3]. The theoretical results show that the difference
of bound energy levels of lenslike InAs QD matches with
the experimental results. While the bound energy levels of
pyramid-shaped QD have the biggest difference from the
measured experimental data. Though the bound-to-contin-
uum transition of the truncated pyramid QD is mostly
acceptable because the behavior is much similar to the
structure of the well-studied quantum-well infrared pho-
todetectors (QWIPs), the bound ground states of electrons
and holes are very far from the experimental results.
The paper is organized as following, in the section
‘‘Sample Preparations and Experimental Results,’’ the
investigated experimental device and experimental results
such as AFM/TEM images, the photoluminescence (PL),
and photocurrent (PC) spectrums are described. In the
section ‘‘Theoretical Results and Discussions,’’ the exact
strain distributions of pyramid, truncated pyramid, and
lenslike-shaped InAs/GaAs QD are calculated by the short-
range VFF approach, and the energy levels of the bound
states are calculated by the recursion method. The final
section discusses the summary.
Sample Preparations and Experimental Results
Figure 1 shows a schematic of the QDIP structure. The
sample was grown on semi-insulating GaAs (001) sub-
strates by using the solid-source molecular beam epitaxy
(MBE). Five layers of nominally 3.0 momolayer (ML) InAs
(quantum dots) were inserted between highly Si-doped
bottom and top GaAs 1000 nm contact layers with doping
density 1 9 10
18
cm
-3
. Each layer of InAs is capped by
21 ML spacer GaAs material to form the InAs QDs, and
the five layers of GaAs/InAs are called S-QD. In addition
there is a 50 nm GaAs layer inserted between the S-QD
regions and bottom (top) Si-doped GaAs contact layers,
respectively.
The typical constant-mode ambient atomic force
microscopy (AFM) data and the cross-sectional TEM for
the counterpart samples are present in Fig. 2a and b,
respectively. The average height of quantum dots is about
GaAs(001) substrate
GaAs
GaAs
n+ GaAs contact Si layer
n+ GaAs contact Si layer
IR
Bias:
e
-
S-GaAs
3ML
InAs
Fig. 1 Typical QDIP structure of GaAs/InAs material
0
4
8
1
2
1
6
2
0
2
4
2
0
4
0
6
0
8
0
1
0
0
3
8
0
3
4
0
Height(Å)
Island Count
Width(Å)
3
0
0
2
6
0
2
2
0
1
8
0
1
4
0
50nm
(a)
(b)
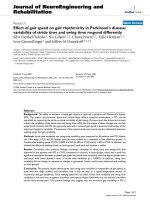
Fig. 2 a Typical AFM-determined island size distribution. b Cross-
sectional TEM images ofQDIP structure
Nanoscale Res Lett (2008) 3:534–539 535
123
74 ± 16 A
˚
, and the quantum dot density has a range from
613/um
2
to 733/um
2
. The average quantum dot width with
the range from 228 to 278 A
˚
represents the full width at
half maximum (FWHM) of AFM scan profile. Figure 2b
shows that the cross-sectional transmission electron
microscope images on the S-QD counterpart. It is noted
that the quantum dot density in the lower layer is higher
than that in the upper layer.
The near-infrared photoluminescence (PL) as a function
of energy at 77 K is shown in Fig. 3. A main peak corre-
sponding to the quantum dot ground state transitions is
centered at 1.058 eV and a small broad shoulder due to
smaller quantum dots or InAs wetting layer appears at
1.216 eV. Figure 4 shows the intra-band photocurrent as a
function of energy at 77 K in the absence of bias. It is well
known that the intra-band photocurrent can present more
direct information on the quantum dot electronic states. An
obvious intra-band photocurrent peak appears at
170.675 meV.
Theoretical Results and Discussions
Strain and Confinement Profile
Here, we adopt the short-range VFF approach to describe
interatomic forces in terms of band stretching and bending
[8, 9]. The model has been widely applied in bulk and
alloys [10–14], as well as low-dimensional systems [15,
16]. It was further developed to an enharmonic VFF model
by Bernard and Zunger for Si–Ge compounds, alloys and
superlattices [17]. In the VFF model, the deformation of a
lattice structure is completely specified when the location
of every atom in a strained state is given [18], and the
elastic energy of a bond is minimal in its three-dimensional
bulk lattice structure. For small deformations, the bond
energy can be written as a Taylor expansion in the varia-
tions of the bond length and the angles between the bond
and its nearest neighbor bonds. Under the rubric of short-
range contributions and by following the general notations
in Ref. [9–14], the elastic energy of an interatomic bond
(by setting the elastic energy at equilibrium as the zero
reference) can be written in the harmonic form,
E
i
¼ K
ir
dr
2
i
þ K
iX
r
2
i0
X
6
j¼1
dX
2
ij
þ K
irr
dr
i
X
6
j¼1
dr
j
ð1Þ
with j = 1,2 6 denoting the six nearest neighbor bonds in
zinc blende structure. dr
i
is the variation of the length of
bond i, and dX
ij
is the variation of the angle between the
i’th and the jth bonds. The total elastic energy is the sum of
all bond energies E
elastic
¼
P
i
E
i
: The numerical values of
K’s for VFF bonds of zinc blende bulk materials are easily
obtained from elastic coefficients C
11
, C
12
, and C
44
listed
in Ref. [17]. Table 1 lists the C and K values for InAs and
GaAs. Note that K’s values depend slightly on the tem-
perature of the material due to the temperature dependence
of the lattice constant. The dependence, however, is small.
The values listed in Table 1 are obtained for the materials
at 100 K.
The local band edges employing the following formulas
for the conduction (CB), the heavy hole (HH), and the light
hole (LH) bands can be approximated as:
100 200 300 400 500
0
5
10
15
20
25
× 1000
Photocurrent (nA)
Ener
g
y (eV)
170.675
Fig. 4 The intra-band photocurrent (PC) at 77 K and 0 bias
Table 1 Values of C’s [19] and K’s (at 100 K) of zincblende InAs
and GaAs bulk materials
InAs GaAs
C
11
(GPa) 83.29 122.1
C
12
(GPa) 45.26 56.6
C
44
(GPa) 39.59 60.0
K
r
(GPaA
˚
) 170.13 215.09
K
X
(GPaA
˚
) 9.59 15.41
K
rr
(GPaA
˚
) 59.315 74.85
1. .1 1.01 21.31.4
0
5
10
15
20
25
30
PL Intensity (a.u.)
Ener
g
y (eV)
1.058
1.216
Fig. 3 The near infrared photoluminescence (PL) spectra at 77 K
536 Nanoscale Res Lett (2008) 3:534–539
123
V
CB
ðrÞ¼E
CB
þ a
c
e
H
ðrÞ
V
HH
ðrÞ¼E
VB
þ a
v
e
H
ðrÞþ
b
2
e
B
ðrÞ
V
LH
ðrÞ¼E
VB
þ a
v
e
H
ðrÞÀ
b
2
e
B
ðrÞ;
ð2Þ
where the hydrostatic strain e
H
and the biaxial strain e
B
are
defined as
e
H
ðrÞ¼e
xx
ðrÞþe
yy
ðrÞþe
zz
ðrÞ
e
B
ðrÞ¼e
xx
ðrÞþe
yy
ðrÞÀ2e
zz
ðrÞ
ð3Þ
V
HH
and V
LH
are the heavy-hole and light-hole bands, a
c
,
a
v
and b are the deformation potentials, and E
CB/VB
are the
unstrained band edge energies. Notice that the sheer-strain-
induced HH–LH coupling and split-off contributions are
ignored. In our calculation we adopt the parameters from
Ref. [17].
The investigated three different shaped InAs QDs fol-
lows pyramid-shaped (with the four facets being (111),
ð
"
111Þ; ð1
"
11Þ; and ð
"
1
"
11ÞÞ InAs QD with the height and base
being 81 and 162 A
˚
, respectively, truncated pyramid-
shaped (with the four facets being same with these of
pyramid-shaped QD) InAs QD with the height and base
being 80 and 168 A
˚
, respectively, and lense-shaped InAs
QD with the height and diameter being 80 and 240 A
˚
,
respectively. The distribution and value of strain is mainly
determined by two factors. The first factor is the shape and
volume of QD. Based on InAs and GaAs technology and
the Stranski-Krastanov self-assembly technique, the QD
can have different shape and symmetry, which therefore
has effect on the strain distribution in QD and the corre-
sponding band offset. The second one is the degree of
anisotropy of elastic property, which is described by elastic
constants. In our calculation, the QDIP system is made up
of InAs/GaAs. So, the second term has the same impact on
the strain distribution. In the following, we will have a look
at the relationship of the strain distribution and the shape of
QDs. The typical results are shown in Fig. 5. The hydro-
static strain e
H
makes the height of CB lower, but the
height changes are almost same for different shape of QDs.
While the biaxial strain e
B
is rather complex for the three
different shapes. For the lens-shaped QD, the InAs lattice is
compressed by GaAs in the growth plane and stretched in
the plane, which is vertical to the growth plane. The pyr-
amid-shaped QD is more complex. The lattice of the top of
QD is stretched in the growth plane, and in the central
e
B
= 0, which means that there is no splitting for the
valence band in the position. The compressing and
stretching condition of bottom in the pyramid QD is the
same as the lens-shaped QD. The difference of QD shape
makes the strain distribution rather different, and the cal-
culated strain distribution of truncated-pyramid QD
resembles to that of the pyramid-shaped QD. The existence
of GaAs coating makes the strain distribution at the top of
the three different shapes of QD to present different char-
acters as: e
H
\ 0 and e
B
\ 0 for lenslike and truncated-
pyramid QD; and e
H
\ 0 and e
B
[ 0 for pyramid-shaped
QD. Figure 6 shows the calculated confinement potential
distribution induced with the strain for three different
shaped QD. The potential has different characters. The
-12 -8 -4 0 4 8 12
ε
H
-0.07500
0.07000
(a)
-12 -8 -4 0 4 8 12
-12
-8
-4
0
4
8
12
ε
B
(b)
-12
-8
-4
0
4
8
12
-12
-8
-4
0
4
8
12
XAxis(nm)
ZAxis(nm)
ε
H
(c)
-12 -8 -4 0 4 8 12
-12 -8 -4 0 4 8 12
-12
-8
-4
0
4
8
12
-0.1300
0.1200
ε
B
(d)
Fig. 5 The calculated strain
distribution of the pyramid and
lens-shaped QD at x-z plane,
where a ? c are hydrostatic
strain from -0.075 (blue) to
0.07 (red) and b ? c) are biaxial
strain from -0.13 (blue) to 0.12
(red)
Nanoscale Res Lett (2008) 3:534–539 537
123
difference of electron energy levels mainly comes from the
difference of shape because there is little change in the
value of e
H
for different shaped QDs. The role of hydro-
static strain e
H
makes the height of CB less. The splitting of
hole potential is determined by biaxial strain e
B
, which
changes a lot when the shape varies.
The Calculation and Analysis of the Energy Level
The recursion method is used to calculate the energy levels
of three different shaped QDs [20]. For the experimental
data, the broadening (FWHM) of the PC spectrum and the
first peak of the PL spectrum are 34.01 and 29.34 meV,
respectively. The broadening is 131.42 meV for the second
peak. The much greater difference in the FWHM implies
the possibility that the second peak comes from wetting
layer, but not from the bound levels of QDs. So for the
simplicity of comparing with the experimental results, we
only calculate all the energy levels of electron and the
bound ground energy level of hole with the corresponding
results shown in Fig. 6 (dotted line).
Next, we present the change in energy level for three
different shape QDs. From Fig. 6, some results are found.
The energy difference between the ground states of hole
and electron is 0.990 eV for pyramid QD, 1.215 eV for
truncated pyramid QD, and 1.053 eV for lens-shaped QD,
respectively. The possible bound-to-bound transition of
electronic inter-subbands is 254.1 meV for pyramid QD
and 156.4 meV for lens-shaped QD. There is only one
bound state in conduction band, so the possible transition
of different energy levels is bound-to-continuum state with
the energy being 199.3 meV. From the experimental data,
the PL spectrum presents the ground state transition from
electron to hole with the value being 1.058 eV. Compared
with the experimental data, the corresponding calculated
value has the difference (d
PL
) of 6.43% for pyramid QD,
14.8% for truncated-pyramid QD, and 0.47% for lens-
shaped QD. Also the differences (d
PC
) from the measured
PC peak (170.675 meV) are 48.88%, 16.77%, and 8.36%
for pyramid, truncated-pyramid, and lens-shaped QD,
respectively. The compared results show that the energy
difference of the lens-shaped QD is the most favored for
the possible QD structure. Though the transition of the
bound-to-continuum transition for truncated pyramid QD is
mostly acceptable because the behavior is much like the
well-studied QWIP structure, the energy difference of the
bound ground states between electron and hole is rather
far from the experimental results. The pyramid is not
possible to be the shape of our investigated QD for the
biggest difference of 48.88%. If we define a parameter r to
estimate whether the shape or size is the most favored to
QD of investigated QDIP structure, the most suitable
expression should be
r ¼
ffiffiffiffiffiffiffiffiffiffiffiffiffiffiffiffiffiffiffiffi
d
2
PL
À d
2
PC
2
r
with d
PL
and d
PC
being the difference of calculated and
measured PL and PC spectrum, respectively. In our cal-
culation, r is 34.86%, 15.82%, and 5.92% for pyramid,
truncated-pyramid, and lens-shaped QD, respectively. For
the lens-shaped QD, r has the least value, which means the
QDIP structure is constructed by the lens-shaped QD. The
lens-shaped InAs/GaAs QD is observed by many
researchers, and in this way our calculation can get a good
agreement with the measured data. Also the PL, PC spec-
trum, and r provide us a way to find out the most suitable
shape and size of QD which makes r the minimum. The
different shape of QDs can have different response wave-
length as described in our calculation. The results mean
that one can obtain the ideal response wavelength of QDIP
structure by controlling the growth condition to change the
shape of QDs.
-0.2
0.0
0.2
0.4
0.6
0.8
1.0
1.2
1.4
1.6
1.8
-0.2
0.0
0.2
0.4
0.6
0.8
1.0
1.2
1.4
1.6
1.8
-30 -20 -10 0 10 20 30 -30 -20 -10 0 10 20 30 -30 -20 -10 0 10 20 30
-0.2
0.0
0.2
0.4
0.6
0.8
1.0
1.2
1.4
1.6
1.8
Energy (EV)
Z Axis (nm)
0.0809 eV
1.1339 eV
1.2903 eV
0.0978 eV
1.0884 eV
1.3425 eV
1.4633 eV
pyramid QD
0.09247 eV
1.3083 eV
Truncated pyramid QD
CB
HH
LH
lens QD
Fig. 6 The calculated
bandoffset (doted ? line) and
energy level (dotted line) of the
three differentshaped QD when
strain is included
538 Nanoscale Res Lett (2008) 3:534–539
123
Summary
In summary, we have studied the strain distribution of self-
assembled QD by the short-range VFF approach to
describe inter-atomic forces in terms of bond stretching and
bending. The strain-driven self-assembled process of QD
based on lattice mismatch has been clearly demonstrated.
The recursion method is used to calculate the bound energy
levels of QD for three different shapes but at the same ratio
3:1 for the base to the vertical aspect. For the three dif-
ferent shaped QD, the hydrostatic strain e
H
has a little
change. The results indicate that the difference of bound
energy is mainly controlled by the shape. The biaxial strain
e
B
changes a lot with the shape. Moreover, the strain and
the shape both play key role in determining the ground
state of hole. The results show that the difference of bound-
to-bound energy levels of lenslike InAs QD matches well
with the experimental data, while the pyramid-shaped QD
has the biggest difference from the measured data. Though
the bound-to-continuum transition for truncated pyramid
QD is mostly acceptable because the behavior is much like
the well-studied QWIP structure, the bound ground states
between electron and hole value is rather far from the
experimental results. Also the biggest difference of 48.88%
makes the pyramid an impossible shape for our investi-
gated QD. Our theoretical investigation provides a feasible
method for finding the most seemly geometry and size of
QDIP structure by adjusting the shape/size of QD and the
comparing theoretical and experimental results. It is useful
in designing the ideal QDIPs device.
Acknowledgments The project is partially supported by the
National Natural Science Foundation of China (Grant No:10474020),
CNKBRSF 2006CB13921507, and Knowledge Innovation Program
of CAS.
References
1. M.A. Naser, M.J. Deen, D.A. Thompson, Spectral function and
responsivity of resonant tunneling and superlattice quantum dot
infrared photodetectors using Green’s function. J. Appl. Phys.
102, 083108 (2007)
2. V. Ryzhii, V. Mitin, M. Stroscio, On the detectivity of quantum-
dot infrared photodetectors, Appl. Phys. Lett. 78, 3523 (2001)
3. Z.H. Chen, O. Baklenov, E.T. Kim, I. Mukhametzhanov, J. Tie,
A. Madhukar, Z.M. Ye, J.C. Campbell, Normal incidence InAs/
Al
x
Ga
1-x
As quantum dot infrared photodetectors with undoped
active region, J. Appl. Phys. 89, 4558 (2000)
4. S.Y. Wang, S.D. Lin, H.W. Wu, C.P. Lee, Low dark current
quantum-dot infrared photodetectors with an AlGaAs current
blocking layer, Appl. Phys. Lett. 78, 1023 (2000)
5. J. Jiang, S. Tsao, T. O’Sullivan, W. Zhang, H. Lim, T. Sills, K.
Mi, M. Razeghi, G. J. Brown, M.Z. Tidrow, High detectivity
InGaAs/InGaP quantum-dot infrared photodetectors grown by
low pressure metalorganic chemical vapor deposition, Appl.
Phys. Lett. 84, 2166 (2004)
6. S.S. Li, J.B. Xia, Electronic structure of N quantum dot molecule,
Appl. Phys. Lett. 91, 092119 (2007)
7. A. Wojs, P. Hawrylak, S. Fafard, L. Jacak, Electronic structure
and magneto-optics of self-assembled quantum dots, Phys. Rev.
B 54, 5604 (1996)
8. M.J.P. Musgrave, J.A. Pople, A general valence force field for
diamond, Proc. R. Soc. Lond A 268, 474 (1962)
9. P.N. Keating, Effect of invariance requirements on the elastic
strain energy of crystals with application to the diamond struc-
ture, Phys. Rev. 145, 637 (1966)
10. M.A. Nusimovici, J.L. Birman, Lattice dynamics of wurtzite:
CdS, Phys. Rev. 156, 925 (1967)
11. R.M. Martin, Elastic properties of ZnS structure semiconductors,
Phys. Rev. B 1, 4005 (1970)
12. R. Ramani, K.K. Mani, R.P. Singh, Valence force fields and the
lattice dynamics of beryllium oxide, Phys. Rev. B 14, 2659
(1976)
13. T. Saito, Y. Arakawa, Atomic structure and phase stability of
In
x
Ga
1-x
N random alloys calculated using a valence-force-field
method, Phys. Rev. B 60, 1701 (1999)
14. T. Takayama, M. Yuri, K. Itoh, T. Baba, J.S. Harris, Jr., Theo-
retical analysis of unstable two-phase region and microscopic
structure in wurtzite and zinc-blende InGaN using modified
valence force field model, J. Appl. Phys. 88, 1104 (2000)
15. H. Jiang, J. Singh, Strain distribution and electronic spectra of
InAs/GaAs self-assembled dots: an eight-band study, Phys. Rev.
B 56, 4696 (1997)
16. O. Stier, M. Grundmann, D. Bimberg, Electronic and optical
properties of strained quantum dots modeled by 8-band kÁp the-
ory, Phys. Rev. B 59, 5688 (1999)
17. J.E. Bernard, A. Zunger, Strain energy and stability of Si-Ge
compounds, alloys, and superlattices, Phys. Rev. B 44, 1663
(1991)
18. J.L. Birman, Theory of the piezoelectric effect in the zincblende
structure, Phys. Rev. 111, 1510 (1958)
19. I. Vurgaftman, J.R. Meyer, L.R. Ram-Mohan, Band parameters
for III-V compound semiconductors and their alloys, J. Appl.
Phys. 89, 5815 (2001)
20. Y. Fu, M. Willander, W. Lu, X.Q. Liu, S.C. Shen, C. Jagadish, M.
Gal, J. Zou, D. J.H. Cockayne, Strain effect in a GaAs-
In
0.25
Ga
0.75
As-Al
0.5
Ga
0.5
As asymmetric quantum wire, Phys.
Rev. B 61, 8306 (2000)
Nanoscale Res Lett (2008) 3:534–539 539
123