Báo cáo hóa học: " Study on the Electric Conductivity of Ag-Doped DNA in Transverse Direction" pptx
Bạn đang xem bản rút gọn của tài liệu. Xem và tải ngay bản đầy đủ của tài liệu tại đây (322.68 KB, 6 trang )
NANO EXPRESS
Study on the Electric Conductivity of Ag-Doped DNA
in Transverse Direction
Ge Ban Æ Ruixin Dong Æ Ke Li Æ Hongwen Han Æ
Xunling Yan
Received: 5 October 2008 / Accepted: 30 December 2008 / Published online: 17 January 2009
Ó to the authors 2009
Abstract In this article, we reported a novel experiment
results on Ag-doped DNA conductor in transverse direc-
tion. I–V characteristics were measured and the relative
conductances were calculated for different silver ions
concentrations. With the increase of the concentration of
silver ions, the conductive ability of DNA risen rapidly, the
relative conductance of DNA enhanced about three mag-
nitudes and reached a stable value when Ag
?
concentration
was up to 0.005 mM. In addition, Raman spectra were
carried out to analyse and confirm conduction mechanism.
Keywords Ag-doped DNA Á Gold electrode Á
Relative conductance Á Increase Á Raman spectra
Introduction
Deoxyribose nucleic acid (DNA) has taken centre stage in
biophysical chemistry research during the past few dec-
ades. The elucidation of the molecular structure 50 years
ago and the translation of the genetic code revolutionized
the field of biotechnology. They sparked the creation of
whole new industries based on this knowledge and on the
various tools and technologies that have subsequently
developed. Biologically, the function of DNA is to code
functional proteins that are the expressed form of heredi-
tary, genetic information. But in the past few years, the
discovery that DNA can conduct electrical current has
made it an interesting candidate for other roles that nature
did not intend for this molecule [1]. There has recently
been an increased interest in charge transport in DNA, due
to both its relevance in physiological reactions and its
potential use in molecular electronics [2–4]. Previous
studies have looked into the effect of the base sequence and
structural distortions on charge transport and the interplay
among different transport mechanisms [5–7]. However,
much of the research so far has focused on how charge
flows along the DNA helix axis. Very few experimental
studies have looked into the transport properties of DNA in
the transverse direction.
Electrical property of DNA has been investigated
intensively for possible use in molecular devices [8–13].
There is a wide range of spectra in the previous results
from Anderson insulator to superconductor [14–17]. To
investigate the electrical property of DNA, other approa-
ches may be needed. Chemical doping is a prominent
strategy for controlling the electrical properties of materi-
als, as demonstrated in semiconductors [18], electrically
conductive polyacetylene [19] and high-Tc superconduc-
tors [20]. There have been a few previous studies on the
electrical property of chemically doped DNA [10–12]. But
few of them have paid attention to the electrical property of
doped DNA in the transverse direction, which is expected
to use in DNA sequencing through nanopore.
In this article, we report novel experimental results on
chemical doping effect on Ag-doped DNA. We adopted
Ag
?
as a dopant, which is expected to occupy the space
between guanine (G) and cytosine (C) to form two rigid
bonds [21, 22]. Ag
?
is substituted for H
?
which was pre-
viously bound to nitrogen atom in guanine. Then the Ag
?
takes an electron out of a double bond in cytosine and
becomes 4d
9
5s
1
5p
1
structure, which corresponds to hole
G. Ban (&) Á R. Dong Á K. Li Á H. Han Á X. Yan
School of Physical Science and Information Technology,
Liaocheng University, Liaocheng, Shandong 252059, China
e-mail:
R. Dong
e-mail:
123
Nanoscale Res Lett (2009) 4:321–326
DOI 10.1007/s11671-008-9245-y
doping. Under such experimental design, we have prepared
Ag-doped DNA at different Ag
?
concentrations and mea-
sured their transverse conductance. On the basis of the
transverse I–V measurement and the results of Raman
spectra, we discuss the chemical doping effect on
Ag-doped DNA conductor.
Materials and Methods
Materials
The calf thymus DNA was purchased in fiber from the
Sigma Company and directly used without further purifi-
cation. Silver nitrate (AR), ultrapure water and gold target
(99.999%) were also used in our experiment.
Experimental Methods
Ag-doped DNA was prepared with different dopant con-
centrations as follows. Three mixtures were made by
mixing 0.16 mg/L calf thymus DNA with 0.0005, 0.005,
and 0.05 mM/L AgNO
3
according to 1:1 proportion
(mixture I, II and III) and put into quartz cuvettes,
respectively. UV–vis spectra were recorded using UV-3310
(Hitachi) to affirm that calf thymus DNA has integrated
with silver ions and find out optimal concentrations of two
reactants, respectively.
The I–V measurement was performed at room temper-
ature under the 40% humidity. First, gold film electrode
was grown on a piece of fresh cleaved mica, which was
made by the technology of laser molecular-beam epitaxy
with a high-quality target of gold. Second, according to the
UV-spectra results, Ag-doped DNA that was made by
mixing 0.16 mg/L calf thymus DNA with Ag
?
of
0–0.01 mM was stretched on the gold film, respectively.
The last step was that the conductive diamond tips of AFM
(NT-MDT CO.) were used as the other electrode to mea-
sure the transport properties of a single double-stranded
DNA and DNA bundles in the transverse direction. The tip
switched from tapping mode to connect mode when the
conversion operation of samples had been changed from
scanning to curving. The setpoints at connect mode were
determined by the F–Z curves. The DCP11 (NT-MDT)
diamond tips were used in our experiment and their spring
constant of the cantilevers was 5.5 N/m.
To determine the Ag binding site, we measure Raman
spectra of Ag-doped DNA at confocal Raman micro-
spectroscopy (British Renishaw) in the range of 400–
1,800 cm
-1
, with NIR 780 nm laser whose power was
maintained at 25 mW and the spectral resolution was less
than 2 cm
-1
. Spectrometer scans, data collection, and
processing were controlled by a personal computer. The
liquid sample was put into a quartz glass capillary for
Raman measurement and the ratio of Ag
?
to nucleotide of
the sample was as same as mixture II.
Results and Discussion
UV-Spectra
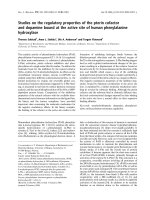
Generally speaking, the interaction between DNA and
positive ions will be detected by absorption spectra.
Figure 1 shows the UV–vis absorption spectra of the DNA
solutions and mixture I, II, and III. The magnification of
section cut is given on the right.
The UV–vis absorption spectra exhibit the absorption
peak of native DNA at 258 nm, but the peak cannot be
found from 250 to 330 nm for AgNO
3
. It is found that
silver ions could cause a hypochromic effect on DNA. The
peak of mixture I is at 264.5 nm, indicating that reaction
occurs between silver ions and DNA. The peak of mixture
II shifts to 268 nm and the mixture III almost has not any
more shifts, marking that the combination between DNA
and silver ions reaches saturation. So the maximum con-
centration of silver ions used in the next experiment was
0.01 mM.
Fig. 1 Absorption spectra of
DNA in the absence and
presence of Ag ions. a: pure
DNA; b: mixture I; c: mixture
II; and d: mixture III
322 Nanoscale Res Lett (2009) 4:321–326
123
Electrical Properties
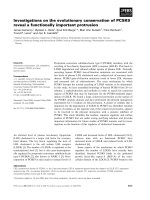
Nature DNA was stretched onto the gold electrode surface
and then the current–voltage (I–V) characteristic of mole-
cule was measured as described in Sect. 2.2. The image of
Ag-doped DNA samples at different Ag
?
concentrations
and I–V measurement points by Atomic force microscopy
(AFM) are shown in Fig. 2. Differences between nature
and Ag-doped DNA were barely found from the AFM
images. There is a line composed of seriate 30 points
across this rope to avoid excursion of tips. The I–V curves
were obtained from each point existed along the line. When
the tip touched the Ag-doped DNA rope, I–V curves from
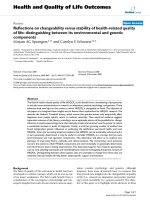
different points appeared. In our experiment, the single
DNA rope was distinguished from DNA bundles by using
the method shown in Fig. 3. Figure 3b is a height profile
taken along the line marked in Fig. 3a. The difference in
height between Ag-doped DNA and gold electrode is clear.
The measured height of Ag-doped DNA is 1–2 nm. About
10% DNA boundles of 3–30 nm was also found in our
AFM samples.
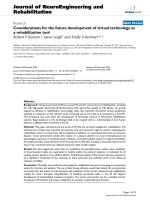
Figure 4 shows the I–V curves of DNA(a) and Ag-doped
DNA(b-f) in transverse direction. The curves present
almost linear and symmetric behavior in the bias range of
-0.2 to 0.2 V. With the increase of the concentration of
silver ions, the conductive ability of DNA rises rapidly and
reaches a stable state at 0.005 mM. The calculated con-
ductance of DNA and Ag-doped DNA with 0.01 mM Ag
?
were about 0.062 9 10
-9
and 74.5 9 10
-9
us, respectively.
Moreover, any hysteresis was not found in all curves. In
addition, we found that I–V curve of DNA showed a little
excursion. The reason for this is studied further.
Considering the effects of electrodes, the relative con-
ductance of Ag-doped DNA is calculated by I–V curve and
is the average of many points on DNA for each Ag
?
concentration (The relative conductance is the ratio of the
conductance of Ag-doped DNA ropes to the conductance
of the loop which was composed of tip, gold electrode, and
inner circuitry of AFM). The relationship between relative
conductance of Ag-doped DNA and Ag
?
concentration is
presented in Table 1 and pictured in Fig. 5a. This figure is
interesting. First, the relative conductance of DNA is
improved obviously and enhanced about three magnitudes
after silver ions were added. Second, the conductance of
Ag-doped DNA increases almost linearly and just stays at
the same order of magnitude when the concentration of
Fig. 2 Image of DNA rope stretched on the gold electrode surface
Fig. 3 a DNA image; b a
height profile taken along the
line marked in a
Nanoscale Res Lett (2009) 4:321–326 323
123
silver ions ranges from 0.0005 to 0.005 mM. Third, there
was rather little change in relative conductance when the
concentration of silver ions is from 0.005 to 0.01 mM.
By Lagrange interpolation method, we can fit a curve as
shown in Fig. 5b, its function is
c ¼ 0:0006 þ 152:94x þ 289950x
2
À 1:71093 Â 10
8
x
3
þ 3:15758 Â 10
10
x
4
À 1:74268 Â 10
12
x
5
where c and x stand for the relative conductance and the
concentrations of silver ions, respectively. The fitted curve
shows a good agreement with the available experimental
result when the concentration is below 0.0025 mM.
We can also find that Ag-doped DNA boundles which
were about 10% in our AFM samples showed almost non-
Ohmic I–V behavior or as same as natural DNA. This result
shows that the conductance was from single DNA and
there was little electric current through DNA bundles.
It has been suggested that Ag
?
forms three types of
complexes with DNA (type I, type II, type III) when
[Ag
?
]:[nucleotide] ratio is greater than 0.5 [23–27]. In type
I complex, Ag
?
binds to N7 positions of guanine and
adenine. The metal ion forms interstrand bifunctional AT
and GC adducts in type II complex and binds to other
positions in type III complex. In our experiment, the ratio
was more than 0.5 for the lowest Ag
?
concentration so that
three complexes exist simultaneity, and then Ag
?
‘‘bridge’’
would be build through DNA ropes in transverse direction
between the electrodes. This ‘‘bridge’’ increases the con-
ductance sharply.
The Analysis of Conduction Mechanism by Raman
Spectra
The Raman spectra of calf thymus DNA(a) and Ag-doped
DNA(b) are presented in the Fig. 6. The frequency of
Raman lines and their assignments are shown in Table 2.It
is found that Raman bands assigned to guanine and adenine
at 1,576, 1,487, 1,418, 1,375 and 727 cm
-1
shift 4–9 cm
-1
Table 1 The Relative conductance varied with different concentrations of silver ions added in DNA
Concentrations of silver ions (mM): 0 0.0005 0.001 0.0025 0.005 0.01
Relative conductance: 0.0006 0.13009 0.30223 0.58505 0.91638 0.92164
Fig. 5 The curves of the relative conductance varied with different
concentrations of silver ions added in DNA. a The curve of
experiment data. b The fitting curve which shows a good agreement
with the available experiment result when the concentration is below
0.0025 mM
Fig. 4 Image of I–V curves of DNA (a) and Ag-doped DNA (b–f): a
pure DNA; b–f, Ag-doped DNA with 0.0005, 0.001, 0.0025, 0.005,
and 0.01 mM silver ions
324 Nanoscale Res Lett (2009) 4:321–326
123
to lower wavenumbers after Ag
?
combine with DNA. The
bands at 1,091 and 788 cm
-1
, assigned to the symmetric
stretching vibration of O
–
P=O and O–P–O diester shift to
1,085 and 781 cm
-1
, respectively. It is also noted that the
band assigned to B-DNA has no change in frequency, but
its intensity decreases sharply. Moreover, the band at 1,249
and 1,047 cm
-1
assigned to thymine and stretching
vibration of C–O in sugar have no obvious shifts. The
result suggests that binding of Ag
?
caused the changes of
DNA structure, especially in stacking of base pairs,
hydrogen bond.
According to the Raman spectra analysis, the interaction
between calf thymus DNA and Ag
?
can cause monophasic
transitions to the conformation of DNA. Ag
?
interacts with
DNA forming three distinct complexes marked I, II and III
with progressively higher amounts of Ag
?
. Complex I has
been assigned to a modified B conformation, whereas
complex II reflects a novel B-conformation in which the
base pair tilt and roll significantly. It can also be noted that
the intensity of the broad band from 1,371 to 1,569 cm
-1
raises obviously and the band at 1,665 cm
-1
becomes
broad. It is expected that the changes are caused by type III.
Conclusion
In conclusion, we report the charge transport properties of
double stranded Ag-doped DNA in the direction perpen-
dicular to the backbone axis. The relative conductance of
DNA is enhanced by three orders of magnitude. The origin
of the novel results may be that a Ag
?
bridge is build
through DNA ropes in transverse direction. The results
may give some references for the research of molecular
devices and sequencing DNA through nanopore.
Acknowledgements This work was supported by the grant number
60571062 of the National Natural Science Foundation of China.
References
1. V. Bhalla, R.P. Bajpai, L.M. Bharadwaj, EMBO Rep. 4, 442
(2003). doi:10.1038/sj.embor.embor834
2. D. Banerjee, S.K. Pal, Chem. Phys. Lett. 432, 257 (2006). doi:
10.1016/j.cplett.2006.10.018
3. F.L. Gervasio, Comput. Phys. Commun. 177, 27 (2007). doi:
10.1016/j.cpc.2007.02.109
4. E.J. Merino, A.K. Boal, J.K. Barton, Curr. Opin. Chem. Biol. 12,
229 (2008). doi:10.1016/j.cbpa.2008.01.046
5. G. Cunibertil, L. Cracol, D. Porath, C. Dekker, Phys. Rev. B 65,
241314 (2002). doi:10.1103/PhysRevB.65.241314
6. R.G. Endres, D.L. Cox, R.R.P. Singh, Rev. Mod. Phys. 76, 195
(2004). doi:10.1103/RevModPhys.76.195
7. J. Lagerqvist, M. Zwolak, M.D. Ventra, Nano. Lett. 6, 779
(2006). doi:10.1021/nl0601076
8. A.J. Storm, J. Noort, S. Vries, C. Dekker, Appl. Phys. Lett. 79,
3881 (2001). doi:10.1063/1.1421086
9. E. Braun, Y. Eichen, U. Sivan, G. Ben-Yoseph, Nature 139, 775
(1998). doi:10.1038/35826
10. A. Rakitin, P. Aich, C. Papadopoulos, Y. Kobzar, A.S. Vedeneev,
J.S. Lee, J.M. Xu, Phys. Rev. Lett. 86, 3670 (2001). doi:
10.1103/PhysRevLett.86.3670
11. H.Y. Lee, H. Tanaka, Y. Otsuka, K.H. Yoo, J.O. Lee, T. Kawai,
Appl. Phys. Lett. 80, 1670 (2002). doi:10.1063/1.1456972
12. Z. Kutnjak, C. Filipic, R. Podgornik, L. Nordenskiold, N.
Korolev, Phys. Rev. Lett. 90, 098101 (2003). doi:10.1103/
PhysRevLett.90.098101
13. E. Meggers, M.E. Michel-Beyerle, B. Giese, J. Am. Chem. Soc.
120, 12950 (1998). doi:10.1021/ja983092p
14. Y. Zhang, R.H. Austin, J. Kraeft, E.C. Cox, N.P. Ong, Phys. Rev.
Lett. 89, 208202 (2002)
15. H.W. Fink, C. Schonenberger, Nature 398, 407 (1999). doi:10.1038/
18855
16. D. Porath, A. Bezryadin, S.D. Vries, C. Dekker, Nature 403, 635
(2000). doi:10.1038/35001029
17. A.Y. Kasumov, M. Kociak, S. Gueron, B. Reulet, V.T. Volkov,
D.V. Klinov, H. Bouchiat, Science 291, 280 (2001). doi:10.1126/
science.291.5502.280
Fig. 6 Raman spectra of calf thymus DNA in aqueous solution a
nature DNA, b Ag-doped DNA
Table 2 The assignment of Raman spectra of DNA and Ag-doped
DNA
Raman shift/cm
-1
Assignment
DNA Ag-doped DNA
1,665 1,666–1,650 G, A
1,576 1,569 G, A
1,487 1,480 G, A
1,418 1,409 A, G
1,375 1,371 T, A, G
1,249 1,249 T
1,091 1,085 O–P=O symmetric stretching vibration
1,047 1,047 Deoxyribose C–O stretching vibration
830 830 B-conformation
788 781 O–P–O diester symmetric stretching
vibration
727 716 A
Nanoscale Res Lett (2009) 4:321–326 325
123
18. G.L. Pearson, J. Bardeen, Phys. Rev. 75, 865 (1949). doi:10.1103/
PhysRev.75.865
19. C.K. Chiang, C.R. Fisher, Y.W. Park, A.J. Heeger, H. Shirakawa,
E.J. Louis, S.C. Gau, A.G. Diarmid, Phys. Rev. Lett. 39, 1098
(1977). doi:10.1103/PhysRevLett.39.1098
20. J.G. Bednortz, K.A. Muller, Z. Phys. B 64, 199 (1986)
21. R.H. Jensen, N. Davidson, Biopolymers 4, 15 (1966). doi:10.1002/
bip.1966.360040104
22. H. Mayama,T. Hiroya, K. Inagaki, S.Tanda, K. Yoshikawa, Chem.
Phys. Lett. 397, 101 (2004). doi:10.1016/j.cplett.2004.08.061
23. R.E. Izatt, J.J. Christensen, J.H. Ryting, Chem. Rev. 71, 439
(1971). doi:10.1021/cr60273a002
24. F.E. Rossetto, E. Nieboer, J. Inorg. Biochem. 54, 167 (1994)
25. H. Arakawa, J.F. Neault, H.A. Tajmir-Riahi, Biophys. J. 81, 1580
(2001)
26. H. Ukeda, S. Maeda, T. Ishii, M. Sawmura, Anal. Biochem. 251,
206 (1997). doi:10.1006/abio.1997.2273
27. Z. Hossain, F. Huq, J. Inorg. Biochem.91, 398(2002). doi:10.1016/
S0162-0134(02)00454-3
326 Nanoscale Res Lett (2009) 4:321–326
123