Báo cáo hóa học: " Study of Materials Deformation in Nanometric Cutting by Large-scale Molecular Dynamics Simulations" docx
Bạn đang xem bản rút gọn của tài liệu. Xem và tải ngay bản đầy đủ của tài liệu tại đây (517.78 KB, 8 trang )
NANO EXPRESS
Study of Materials Deformation in Nanometric Cutting
by Large-scale Molecular Dynamics Simulations
Q. X. Pei Æ C. Lu Æ H. P. Lee Æ Y. W. Zhang
Received: 22 December 2008 / Accepted: 27 January 2009 / Published online: 18 February 2009
Ó to the authors 2009
Abstract Nanometric cutting involves materials removal
and deformation evolution in the surface at nanometer
scale. At this length scale, atomistic simulation is a very
useful tool to study the cutting process. In this study, large-
scale molecular dynamics (MD) simulations with the
model size up to 10 millions atoms have been performed to
study three-dimensional nanometric cutting of copper. The
EAM potential and Morse potential are used, respectively,
to compute the interaction between workpiece atoms and
the interactions between workpiece atoms and tool atoms.
The material behavior, surface and subsurface deformation,
dislocation movement, and cutting forces during the cutting
processes are studied. We show that the MD simulation
model of nanometric cutting has to be large enough to
eliminate the boundary effect. Moreover, the cutting speed
and the cutting depth have to be considered in determining
a suitable model size for the MD simulations. We have
observed that the nanometric cutting process is accompa-
nied with complex material deformation, dislocation
formation, and movement. We find that as the cutting depth
decreases, the tangential cutting force decreases faster than
the normal cutting force. The simulation results reveal that
as the cutting depth decreases, the specific cutting force
increases, i.e., ‘‘size effect’’ exists in nanometric cutting.
Keywords Molecular dynamics Á Nanometric cutting Á
Materials deformation Á Large-scale simulation
Introduction
Nanometric cutting is a tool-based materials removal
technique to remove materials at nanometer scale thickness
in the surface. Nanometric cutting can be used to produce
micro/nano-components with nanoscale surface finish and
sub-micron level form accuracy for many applications such
as micro-electro-mechanical systems (MEMS) and nano-
electro-mechanical systems (NEMS) [1, 2]. Understanding
the material removal mechanism and mechanics at atom-
istic scale in the surface, such as deformation evolution,
chip formation, machined surface, cutting forces, and
friction, is a critical issue in producing high precision
components. However, as the nanometric cutting process
involves only a few atomic layers at the surface, it is
extremely difficult to observe the cutting process and to
measure the process parameters through experiments.
Therefore, theoretical analysis plays a major role in
obtaining information on nanometric cutting. The widely
used finite element method based on continuum mechanics
for the analysis of conventional cutting is not appropriate to
analyze the nanometric cutting process because of the
discrete nature of materials at such a small length scale;
therefore molecular dynamics (MD) simulation has
become a very useful tool in the study of nanometric
cutting.
A number of studies have used the MD simulations to
analyze the nanometric cutting process [3–9]. The typical
studies among them include: Maekawa et al. [3] studied
the role of friction between a single-crystal copper and a
diamond-like tool in nano-scale orthogonal machining. The
Morse type potentials were used for the interactions
between Cu–Cu, Cu–C, and C–C atoms; Zhang et al. [4]
studied the wear and friction on the atomic scale and
identified four distinct regimes of deformation consisting
Q. X. Pei (&) Á C. Lu Á H. P. Lee Á Y. W. Zhang
Institute of High Performance Computing, 1 Fusionopolis Way,
Singapore 138632, Singapore
e-mail:
123
Nanoscale Res Lett (2009) 4:444–451
DOI 10.1007/s11671-009-9268-z
of no-wear, adherence, plowing, and cutting regimes;
Komanduri et al. [5–7] carried out MD simulations of
nanometric cutting of single-crystal copper and aluminum.
They investigated the effects of crystal orientation, cutting
direction and tool geometry on the nature of deformation,
and machining anisotropy of the material; more recently,
Zhang et al. [9] used MD simulations to study the sub-
surface deformed layers in the atomic force microscopy
(AFM)-based nanometric cutting process.
All those previous studies have provided much help in
understanding nanometric cutting. However, as the MD
simulation of nanometric cutting is compute-intensive,
small simulation models with a few thousands to tens of
thousands of atoms were used in the reported studies to
reduce the computing time. Although those small models
have provided a lot of information on the nanometric cut-
ting processes, a small model may induce significant
boundary effects that make the results unreliable. For
example, if the model is not large enough, the widely used
fixed-atoms boundary in MD simulations may have strong
effect on the dislocation movement and thus will affect the
motion of atoms at the cutting surface. Besides, in most of
the reported studies, the simulation models are two-
dimensional or quasi-three-dimensional (plane strain) due
to the limitation on the model size. Therefore, there is a
need for large-scale MD simulations of three-dimensional
(3D) nanometric cutting processes.
Another limitation of previous studies on MD simula-
tions of nanometric cutting of metals is that the Morse
potential has been widely adopted to model the interatomic
force between metal atoms. Morse potential is a pair
potential which considers only two-body interactions; thus,
it provides a rather poor description of the metallic bond-
ing. The strength of the individual bond in metals has a
strong dependence on the local environment. It decreases
as the local environment becomes too crowded due to the
Pauli’s ‘‘exclusion principle’’ and increases near surfaces
and in small clusters due to the localization of the electron
density. The pair potential does not depend on the envi-
ronment and, as a result, cannot reproduce some of the
characteristic properties of metals, such as the much
stronger bonding of atoms near surfaces. The EAM
potential, which has been specially developed for metals
[10–12], can better describe the metallic bonding. There-
fore, the EAM potential gives a more realistic description
of the behavior and properties of metals than the Morse
potential. Our previous study [13] showed that the two
different potentials resulted in quite different simulation
results and suggested that the EAM potential should be
used in MD simulation of nanometric cutting.
In this article, we present large-scale 3D MD simula-
tions of nanometric cutting of copper. In our simulations,
the EAM potential is employed for the interactions
between Cu atoms in the workpiece. We first studied the
model size effect on the simulation results with three dif-
ferent model sizes of about 2, 4, and 10 million atoms.
Then, we used the 4-million-atom model, which is shown
to be large enough to eliminate the boundary effect, to
study the detailed materials deformation, dislocation
movement, and cutting forces during the cutting processes.
Simulation Models and Conditions
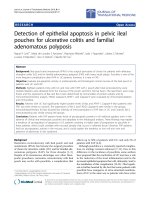
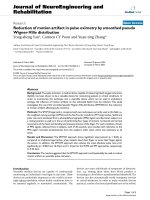
Figure 1a–c show three simulation models for our large-
scale MD simulations of nanometric cutting. The work-
piece sizes are 40 9 20 9 30 nm containing 2,053,594
atoms, 40 9 40 9 30 nm containing 4,098,686 atoms, and
70 9 44 9 40 nm containing 10,137,600 atoms. The dia-
mond tool contains 8446 carbon atoms. The cutting is
along the x direction, which is taken as the [100] direction
of the FCC lattice of copper. The boundary conditions of
Fig. 1 The MD simulation models with the number of atoms in the
workpiece being around a 2 millions, b 4 millions and c 10 millions.
The corresponding workpiece dimensions are 40 9 20 9 30 nm,
40 9 40 9 30 nm, and 70 9 44 9 40 nm, respectively. The cutting
tools are in light grey color and the cutting chips ahead the cutting
tools are shown in colors ranging from red to light blue
Nanoscale Res Lett (2009) 4:444–451 445
123
the cutting simulations include: (1) three layers of atoms at
the bottom of the workpiece materials (lower z plane) are
kept fixed; (2) periodic boundary conditions are maintained
along the y direction.
In nanometric cutting, as the cutting depth can be as
small as a few nanometers, the edge of the cutting tool is
not sharp compared with this very small cutting depth. The
edge radius of the cutting tool is usually much larger than
the cutting depth. Therefore, in our large-scale MD simu-
lations, we use a round edge cutting tool with an edge
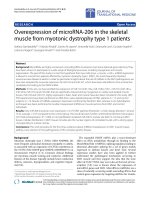
radius of 6 nm instead of a sharp cutting tool. The geom-
etry of the cutting tool is shown in Fig. 2. The tool
thickness is 3.2 nm with the tool rake angle a and the tool
clearance angle b being 12°.
The cutting speed used in the MD simulations ranges
from 50 to 500 m/s, while the cutting depth ranges from
0.8 to 4 nm. The cutting is in the (001) plane and along the
[100] direction of the workpiece. The initial temperature of
the workpiece is 300 K. The three layers of atoms adjacent
to the fixed-atom boundary at the workpiece bottom are set
as the thermostat atoms, in which the temperatures are
maintained at 300 K by rescaling the velocities of the
atoms. The velocity Verlet algorithm with a time step of
2 fs is used for the time integration of Newton’s equations
of motion.
The interatomic forces in MD simulations are calculated
from the interatomic potentials. The Morse potential is
relatively simple and computationally inexpensive com-
pared to the EAM potential. The Morse potential is as
follows:
/ r
ij
ÀÁ
¼D exp À2a r
ij
Àr
0
ÀÁÂÃ
À2exp Àa r
ij
Àr
0
ÀÁÂÃÈÉ
ð1Þ
where / r
ij
ÀÁ
is a pair potential energy function; D is the
cohesion energy; a is the elastic modulus; r
ij
and r
0
are the
instantaneous and equilibrium distance between atoms, i
and j, respectively.
The EAM method, which has been evolved from the
density-function theory, is based upon the recognition that
the cohesive energy of a metal is governed not only by the
pair-wise potential of the nearest neighbor atoms, but also
by embedding energy related to the ‘‘electron sea’’ in
which the atoms are embedded. For EAM potential, the
total atomic potential energy of a system is expressed by
the following equation:
E
tot
¼
1
2
X
i;j
U r
ij
ÀÁ
þ
X
i
F
i
q
i
ðÞ ð2Þ
where U
ij
r
ij
ÀÁ
is the two-body interaction energy between
atoms, i and j, with separation distance, r
ij
; F
i
is the
embedding energy of atom, i;
"
q
i
is the host electron density
at site, i, induced by all other atoms in the system, which is
given by the following equation:
"
q
i
¼
X
j6¼i
q
j
r
ij
ÀÁ
ð3Þ
where q
j
r
ij
ÀÁ
is the contribution to the electronic density at
atom, i, due to atom, j, at distance, r
ij
, from the atom, i.
There are three different atomic interactions in the MD
simulations of nanometric cutting processes: (1) the inter-
action in the workpiece; (2) the interaction between the
workpiece and the tool; and (3) the interaction in the tool.
For the interaction between the copper atoms in the
workpiece, we used the EAM potential for copper con-
structed by Johnson [14]. For the interaction between the
copper workpiece and the diamond tool, as there is no
available EAM potential between Cu and C atoms, we still
use the Morse potential for the workpiece–tool interaction
with the parameters adopted from reference [4] being
D = 0.087 eV, a = 5.14, and r
0
= 2.05 A
˚
. Since the dia-
mond tool is much harder than the copper workpiece, it is a
good approximation to take the tool as a rigid body.
Therefore, the atoms in the tools are fixed relative to each
other, and no potential is needed for the interaction among
the tool atoms.
Dislocations play a crucial role in the plastic deforma-
tion of materials. However, accurately identifying
dislocations at room temperature in MD simulations is a
very difficult task due to thermal vibration of atoms. This
might be the reason why almost all the previous MD
studies of dislocations were carried out at extremely low
temperature of 0 K or 1 K [15–21]. The widely used
methods to identify dislocations and other lattice defects in
MD simulations are the atomic coordinate number [15], the
slip vector [16], and the centro-symmetry parameter [17].
We compared these different methods and found that the
methods of atomic coordinate number and the slip vector
would become less effective in identifying the lattice
Fig. 2 The geometry of the cutting tool. The tool edge radius
r = 6 nm. The rake angle a = 12° and clearance angle b = 12°. The
tool thickness L = 3.2 nm
446 Nanoscale Res Lett (2009) 4:444–451
123
defects at finite temperature due to thermal fluctuations of
atoms. Therefore, we have chosen to use the centro-sym-
metry parameter, which is less sensitive to the temperature
increase. In a centro-symmetric material (such as copper
and other FCC metals), each atom has pairs of equal and
opposite bonds among its nearest neighbors. As the mate-
rial is distorted, these bonds will change direction and/or
length, but they will remain equal and opposite under
homogeneous elastic deformation. If there is a defect
nearby, however, this equal and opposite relation no longer
holds. In a perfect bulk FCC lattice, each atom has 12
nearest-neighbor bonds or vectors. The centro-symmetry
parameter for each atom is defined as follows:
CSP ¼
X
i¼1;6
R
!
i
þ R
!
iþ6
2
ð4Þ
where R
i
and R
i?6
are the vectors corresponding to the six
pairs of opposite nearest neighbors in the FCC lattice. By
definition, the centro-symmetry parameter is zero for an
atom in a perfect FCC material under any homogeneous
elastic deformation and non-zero for an atom which is near
a defect such as a cavity, a dislocation, or a free surface.
The large-scale MD simulations of nanometric cutting
are carried out on the IBM p575 supercomputer at the
Institute of High Performance Computing (IHPC). The
multi-processor parallel computing is used for the simula-
tions. The parallel computing is realized by using message
passing interface (MPI) library. The calculation time for
each simulation case depends on the model size, cutting
speed, cutting distance, as well as the number of CPUs
used. For example, it took about 3 weeks to finish the
simulation run for the 10-millino-atom model with the
cutting speed of 100 m/s using 32 CPUs.
Simulation Results
The Simulation Model Size
For a MD simulation, the larger the model size, the less
obvious the boundary effect on the simulation results.
However, a very large model will take unnecessarily long
computing time. Therefore, it is necessary to study the
model size effect, so that we can find a suitable model size
for the MD simulations of nanometric cutting. The model
size should be moderate with diminished boundary effect
on the simulation results.
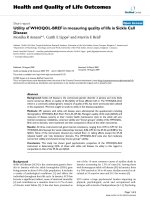
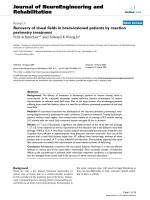
We first performed MD simulations using the 2-million-
atom model in Fig. 1a with a cutting speed of 100 m/s and a
cutting depth of 4 nm. The simulation results of the
2-million-atom model are shown in Fig. 3a, from which one
can see that the lattice defects generated from the cutting
exist in the whole subsurface region between the periodic
boundaries (see the front view). The centro-symmetry
Fig. 3 The simulation results of the different model sizes: a 2-million-
atom model, b 4-million-atom model and c 10-million-atom model. The
lower figures are front views of the models. The cutting depth is 4 nm
and the cutting speed is 100 m/s. The blue color shows the dislocations
formed inside the workpieces during cutting
Nanoscale Res Lett (2009) 4:444–451 447
123
parameter (CSP) is used to identify the lattice defects. In
Fig. 3a–c, the atoms inside the model with CSP smaller
than three are all eliminated in the visualizations, as these
atoms are assumed to be in perfect FCC configuration. Note
that the isolated atoms distributed inside the model are not
lattice defects. Those atoms having CSP above three are due
to the thermal vibration of atoms at finite temperature. The
periodic boundary condition in y direction implies that both
the workpiece and the cutting tool repeat in this direction.
The repeated cutting tools may make the stresses at the
periodic boundary regions higher due to stress superposition
arising from the interaction of stress fields. The stress
interaction is helpful for the dislocations in the cutting
regions to slide to the periodic boundaries and also helpful
for new dislocations to be generated at the periodic
boundaries. This phenomenon was also reported by Saraev
et al. [21] in their study of the nanoindentation of copper. As
lattice defects exist in the periodic boundaries in the sim-
ulation results, the 2-million-atom model is not large
enough to eliminate the boundary effect at the periodic
boundaries, though it is quite large compared with the
models used in the reported works on MD simulation of
nanometric cutting.
Thereafter, we performed simulations using the 4-mil-
lion-atom model in Fig. 1b with the workpiece thickness
(y direction) two times that of the 2-million-atom model. The
simulation results in Fig. 3b show that the 4-million-atom
model could eliminate the boundary effect of the periodic
boundaries. We also carried out simulations with the
10-million-atom model in Fig. 1c. In the 10-million-atom
model, the workpiece is larger than that of the 4-million-
atom model in all the three dimensions with very obvious
increase in both the x and z directions to test the boundary
effects in these two directions. We found that the simulation
results with the 10-million-atom model, shown in Fig. 3c,
did not show obvious difference from those of the 4-million-
atom model. Therefore, for the cutting speed of 100 m/s and
cutting depth of 4 nm, the 4-million-atom-model is shown to
be large enough to ignore the boundary effect in the
simulations.
MD simulations were also carried out to study the effect
of cutting speed and cutting depth on the boundary effect.
The simulation results show that reducing cutting speed
results in more obvious boundary effect, while reducing
cutting depth results in less obvious boundary effect. This
is because a slower cutting speed means longer cutting
time, and therefore the dislocations have more time to
move and are more possible to reach the boundaries, which
makes the boundary effect stronger. A smaller cutting
depth means less material deformation, and therefore
results in a weaker boundary effect. As the cutting speed
and cutting depth may make the boundary effect stronger,
it is important to consider those process parameters in
choosing the model size for MD simulations of nanometric
cutting.
Material Deformation, Dislocations, and Cutting Forces
We now analyze the nanometric cutting process of the
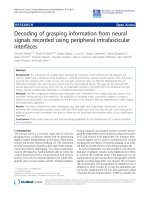
4-million-atom model. Figure 4a–c show the cross-sectional
views of the x–z plane at three different cutting distances of 8,
12, and 16 nm, respectively. In this simulation case, the
cutting speed is 100 m/s and the cutting depth is 0.8 nm. It
can be seen from the figures colored by CSP that the work-
piece materials deform during cutting and the material
removal takes place via the chip formation as in conventional
cutting. The materials in front of and beneath the tool are
away from the perfect FCC lattice. Dislocations and other
lattice defects are generated in these regions. It can be clearly
observed that the dislocations emit from the cutting region
and some of them glide deep into the workpiece.
Figure 5a–c present the side views of the 3D lattice
defects at the cutting distances of 8, 12, and 16 nm,
respectively. In the figures, the defect-free atoms in the
workpiece are removed from the visualization. Note that
the isolated atoms distributed inside the model are not
Fig. 4 The simulated nanometric cutting process at the cutting
distances of (a) 8 nm, (b) 12 nm and (c) 16 nm. The cutting depth is
0.8 nm and cutting speed is 100 m/s. The figures are shown in the
cross-sectional views. The light blue color shows the cutting chips
and dislocations inside the workpiece
448 Nanoscale Res Lett (2009) 4:444–451
123
lattice defects. They are left in the figures due to the
thermal vibration of atoms. Although the CSP method is
not perfect in identifying the lattice defects at finite tem-
perature, it is more accurate than other methods such as the
atomic coordinate number and the slip vector. It can be
seen from Fig. 5a–c that lattice defects are formed in the
workpiece during the cutting process. Moreover, a dislo-
cation loop is generated and moves in the 10
1
ÂÃ
direction.
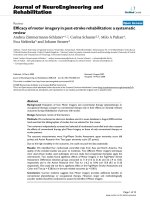
The cutting forces in the MD simulations are obtained
by summing the atomic forces of all the workpiece atoms
on the tool atoms. The variations of the cutting forces with
the cutting distance during the cutting process for this
simulation case are shown in Fig. 6. It can be seen that both
the tangential cutting force, Fx, and the normal cutting
force, Fz, increase at the start of the cutting. Then the
cutting forces tend to remain steady during the rest of
the cutting process. The formation of dislocations results in
the release of the accumulated cutting energy, which cor-
responds to the temporary drop of the cutting force.
The fluctuation of the cutting forces in Fig. 6 is due to
the formation of dislocations and their complex local
movement in the cutting region. It is also observed from
Fig. 6 that the normal cutting force, Fz, shows stronger
fluctuation than the tangential cutting force, Fx. This is
because at this very small cutting depth, the normal cutting
force is higher than the tangential cutting force, and
therefore the normal cutting force undergoes stronger
fluctuation. With a larger cutting depth as discussed in next
section, the magnitude of normal cutting force is close to
that of the tangential cutting force, and so magnitude of the
force fluctuations is also close. The simulated cutting force
in the thickness direction of the workpiece (y direction) is
not shown here as it is very small with its time-averaged
value over the whole cutting process being zero.
Effect of Cutting Depth on the Cutting Process
For nanometric cutting, it is interesting to understand how
the cutting depth influences the cutting process. Figure 7a–c
show material deformation, chip formation, and dislocations
during the cutting process for the cutting depths of 0.8, 2.0,
and 4.0 nm, respectively. It can be seen that a larger cutting
depth results in more workpiece material deformation
around the tool and bigger cutting chip. Moreover, a larger
cutting depth results in more lattice defects and dislocations
in the cutting regions. However, the isolated dislocation
loops is not observed in the cutting process for the cut-
ting depth of 2.0 nm, though they are observed for the
cutting depths of 0.8 and 4.0 nm. This shows that the dislo-
cation activity is very complex in the nanoscale cutting
process.
Figure 8 shows the time-averaged tangential and normal
cutting forces during the cutting process for the different
cutting depths. It can be seen that both tangential and
normal cutting forces decrease as the cutting depth
decreases. However, the tangential cutting force decreases
faster than the normal cutting force. Consequently, the ratio
of normal force to tangential force changes from smaller
Fig. 5 Side views of the lattice defects during the nanometric cutting process at the cutting distances of (a) 8 nm, (b) 12 nm and (c) 16 nm. The
formation and movement of a dislocation loop inside the workpiece can be clearly seen
0
20
40
60
80
100
120
0 2 4 6 8 10121416
Cutting distance (nm)
Cutting force (nN)
Tangential force Fx
Normal force Fz
Fig. 6 Variations of the cutting forces with the cutting distance
Nanoscale Res Lett (2009) 4:444–451 449
123
than 1.0 for the cutting depth of 4.0 nm to greater than 1.0
for the cutting depths of 2.0 and 0.8 nm. This shows that
for nanoscale cutting with small cutting depth, as the tool
edge radius is quite large compared to the cutting depth, the
nanoscale cutting is more similar to the conventional
grinding with a large negative tool rake angle.
Figure 9 shows the variations of the resultant cutting
force and the specific cutting force with cutting depth. Here
the resultant cutting force, Fr, is the vector sum of the
tangential force, Fx, and normal force, Fz. Note that the
average cutting force along the thickness direction Fy is
zero. The specific cutting force, Fs, is the resultant cutting
force divided by the cutting depth. It can be seen that with
the decrease of cutting depth the resultant cutting force
decreases. However, the specific cutting force increases
rapidly with the decrease of cutting depth, which shows a
very obvious ‘‘size effect’’. The ‘‘size effect’’ on the spe-
cific cutting force in nanometric cutting can be explained
by the metallic bonding. The special feature of metallic
bonding is that the strength of the individual bond has a
strong dependence on the local environment. The bonding
becomes stronger at the surface due to the localization of
the electron density. The smaller the cutting depth, the
larger the ratio of cutting surface to cutting volume, and
thus the bigger the specific cutting force.
Conclusions
We have performed a series of large-scale 3D MD simu-
lations using the EAM potential to study the nanometric
cutting process. Three different model sizes of 2-million-
atom, 4-million-atom, and 10-million-atom are used with
different cutting speeds and cutting depths. It is shown that
the 2-million-atom model, though quite large compared
with the models used in the previously reported studies, is
not large enough to eliminate the boundary effect for
the simulation conditions used. It is also shown that the
4-million-atom model is large enough to eliminate the
boundary effect at the cutting speed of 100 m/s and cutting
Fig. 7 Material deformation and dislocations for the cutting depths of (a) 0.8 nm, (b) 2.0 nm and (c) 4.0 nm. The blue color shows the
dislocations inside the workpieces
0
40
80
120
160
200
240
0 0.5 1 1.5 2 2.5 3 3.5 4 4.5
Cutting depth (nm)
Average cutting force (nN)
Tangential force Fx
Normal force Fz
Fig. 8 Variations of the time-average cutting forces with the cutting
depth
0
50
100
150
200
250
300
0.8 2 4
Cutting depth (nm)
Average cutting force (nN)
Resultant force Fr
Specific force Fs
Fig. 9 The resultant cutting force and the specific cutting force for
the different cutting depths of 0.8, 2.0 and 4.0 nm
450 Nanoscale Res Lett (2009) 4:444–451
123
depth of up to 4 nm. A detailed study on the material
deformation, lattice defects, dislocation movement, and
cutting forces during the cutting process is made with the
4-million-atom model. It is observed that the nanometric
cutting process is accompanied by complex material
deformation, chip formation, lattice defect generation, and
dislocation movement. It is found that as the cutting depth
decreases, both the tangential and normal cutting forces
decreases; however, the tangential cutting force decreases
faster than the normal cutting force. It is also found that as
the cutting depth decreases, the specific cutting force
increases, which reveals that the ‘‘size effect’’ exists in
nanometric cutting.
Acknowledgments This work has been supported by the Agency
for Science, Technology and Research (A*STAR), Singapore. Thanks
also go to the staffs of the Computational Resource Centre at the
Institute of High Performance Computing, who have provided the
assistance in the large-scale computing and visualization.
References
1. E. Masayoshi, O. Takahito, MEMS/NEMS by Micro Nanoma-
chining. IEIC Tech. Rep. 103, 13 (2003)
2. H.W. Schumacher, U.F. keyser, U. Zeitler, R.J. Haug, K. Ebert,
Controlled mechanical AFM machining of two-dimensional
electron systems: fabrication of a single-electron transistor.
Physica E 6, 860 (2000). doi:10.1016/S1386-9477(99)00230-1
3. K. Maekawa, A. Itoh, Friction and tool wear in nano-scale
machining–a molecular dynamics approach. Wear 188, 115–122
(1995). doi:10.1016/0043-1648(95)06633-0
4. L. Zhang, H. Tanaka, Towards a deeper understanding of wear
and friction on the atomic scale–a molecular dynamics analysis.
Wear 211, 44 (1997). doi:10.1016/S0043-1648(97)00073-2
5. R. Komanduri, N. Chandrasekaran, L.M. Raff, MD simulation of
nanoscale cutting of single crystal aluminum–effect of crystal
orientation and direction of cutting. Wear 242, 60 (2000). doi:
10.1016/S0043-1648(00)00389-6
6. R. Komanduri, N. Chandrasekaran, L.M. Raff, Molecular dynam-
ics simulation of atomic-scale friction. Phys. Rev. B 61, 14007
(2000). doi:10.1103/PhysRevB.61.14007
7. R. Komanduri, N. Chandrasekaran, L.M. Raff, MD simulation of
exit failure in nanoscale cutting. Mater. Sci. Eng. A 311,1
(2001). doi:10.1016/S0921-5093(01)00960-1
8. T.H. Fang, C.I. Weng, Three-dimensional molecular dynamics
analysis of processing using a pin tool on the atomic scale.
Nanotechnology 11, 148–153 (2000). doi:10.1088/0957-4484/11/
3/302
9. J.J. Zhang, T. Sun, Y.D. Yan, Y.C. Liang, S. Dong, Molecular
dynamics simulation of subsurface deformed layers in AFM-
based nanometric cutting process. Appl. Surf. Sci. 254, 4774
(2008). doi:10.1016/j.apsusc.2008.01.096
10. M.S. Daw, M.I. Baskes, Embedded-atom method: derivation and
application to impurities, surfaces, and other defects in metals.
Phys. Rev. B 29, 6443 (1984). doi:10.1103/PhysRevB.29.6443
11. M.W. Finnis, J.E. Sinclair, A simple empirical N-body potential
for transition metals. Philos. Mag. A 50, 45 (1984). doi:10.1080/
01418618408244210
12. M.S. Daw, S.M. Foiles, M.I. Baskes, The embedded-atom
method: a review of theory and applications. Mater. Sci. Rep. 9,
251 (1993). doi:10.1016/0920-2307(93)90001-U
13. Q.X. Pei, C. Lu, F.Z. Fang, H. Wu, Nanoscale cutting of copper:
a molecular dynamics study. Comput. Mater. Sci. 37, 434 (2006).
doi:10.1016/j.commatsci.2005.10.006
14. R.A. Johnson, Analytic nearest-neighbor model for fcc metals.
Phys. Rev. B 37, 3924 (1988). doi:10.1103/PhysRevB.37.3924
15. J. Li, K.J. Van Vliet, T. Zhu, S. Yip, S. Suresh, Atomistic
mechanisms governing elastic limit and incipient plasticity in
crystals. Nature 418, 307 (2002). doi:10.1038/nature00865
16. A. Zimmerman, C.L. Kelchner, J.C. Hamilton, S.M. Foiles,
Surface step effects on nanoindentation. Phys. Rev. Lett. 87,
165507 (2001). doi:10.1103/PhysRevLett.87.165507
17. C.L. Kelchner, S.J. Plimpton, J.C. Hamilton, Dislocation nucle-
ation and defect structure during surface indentation. Phys. Rev.
B 58, 11085 (1998). doi:10.1103/PhysRevB.58.11085
18. O. Kum, Orientation effects of elastic-plastic deformation at
surfaces: nanoindentation of nickel single crystals. Mol. Simul.
31, 115 (2005). doi:10.1080/08927020412331308502
19. Y.H. Lin, S.R. Jian, Y.S. Lai, P.F. Yang, Molecular dynamics
simulation of nanoindentation-induced mechanical deformation
and phase transformation in monocrystalline silicon. Nanoscale
Res. Lett. 3, 71 (2008). doi:10.1007/s11671-008-9119-3
20. T. Tsuru, Y. Shibutani, Atomistic simulation of elastic defor-
mation and dislocation nucleation in Al under indentation-
induced stress distribution. Model Simul. Mater. Sci. Eng. 14,
S55 (2006). doi:10.1088/0965-0393/14/5/S07
21. D. Saraev, R.E. Miller, Atomic-scale simulations of nanoindenta-
tion-induced plasticity in copper crystals with nanoscale-sized
nickel coatings. Acta Mater. 54, 33 (2006). doi:10.1016/j.actamat.
2005.08.030
Nanoscale Res Lett (2009) 4:444–451 451
123