Tools for Business Decision Management Makers_2 docx
Bạn đang xem bản rút gọn của tài liệu. Xem và tải ngay bản đầy đủ của tài liệu tại đây (914.97 KB, 33 trang )
and volume are strictly straight-line ones. In real life, this is unlikely to be the case.
This is probably not a major problem, since, as we have just seen,
– break-even analysis is normally conducted in advance of the activity actually
taking place. Our ability to predict future cost, revenue and so on is somewhat
limited, so what are probably minor variations from strict linearity are unlikely to
be significant, compared with other forecasting errors; and
– most businesses operate within a narrow range of volume of activity; over short
ranges, curved lines tend to be relatively straight.
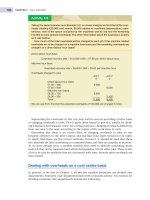
l Stepped fixed cost. Most types of fixed cost are not fixed over all volumes of activity.
They tend to be ‘stepped’ in the way depicted in Figure 3.2. This means that, in prac-
tice, great care must be taken in making assumptions about fixed cost. The problem
is heightened because most activities will probably involve various types of fixed
cost (for example rent, supervisory salaries, administration costs), all of which are
likely to have steps at different points.
l Multi-product businesses. Most businesses do not offer just one product or service.
This is a problem for break-even analysis since it raises the question of the effect of
additional sales of one product or service on sales of another of the business’s pro-
ducts or services. There is also the problem of identifying the fixed cost of one
particular activity. Fixed cost tends to relate to more than one activity – for example,
two activities may be carried out in the same rented premises. There are ways of
dividing the fixed cost between activities, but these tend to be arbitrary, which calls
into question the value of the break-even analysis and any conclusions reached.
WEAKNESSES OF BREAK-EVEN ANALYSIS
75
We saw above that, in practice, relationships between costs, revenues and volumes of
activity are not necessarily straight-line ones.
Can you think of at least three reasons, with examples, why that may be the case?
We thought of the following:
l Economies of scale with labour. A business may do things more economically where
there is a high volume of activity than is possible at lower levels of activity. It may, for
example, be possible for employees to specialise.
l Economies of scale with buying goods or services. A business may find it cheaper to
buy in goods and services where it is buying in bulk, as discounts are often given.
l Diseconomies of scale. This may mean that the per-unit cost of output is higher at
higher levels of activity. For example, it may be necessary to pay higher rates of pay to
workers to recruit the additional staff needed at higher volumes of activity.
l Lower sales prices at high levels of activity. Some consumers may only be prepared to
buy the particular product or service at a lower price. Thus, it may not be possible
to achieve high levels of sales activity without lowering the selling price.
Activity 3.10
Despite some practical problems, break-even analysis and BEP seem to be widely
used. The media frequently refer to the BEP for businesses and activities. For example,
there is seemingly constant discussion about Eurotunnel’s BEP and whether it will
ever be reached. Similarly, the number of people regularly needed to pay to watch a
football team so that the club breaks even is often mentioned. This is illustrated in
Real World 3.5, which is an extract from an article discussing the failure of Plymouth
Argyle FC, the Coca-Cola Championship football club, to spend all of its player trans-
fer income on new players.
M03_ATRI3622_06_SE_C03.QXD 5/29/09 3:30 PM Page 75
Real World 3.7 provides a more formal insight into the extent to which managers in
practice use break-even analysis.
CHAPTER 3 COST–VOLUME–PROFIT ANALYSIS
76
REAL WORLD 3.5
Pilgrims not progressing through the turnstiles
This year, Argyle have raked in plenty of income, in addition to their gate receipts. The sale of
players has brought in over £8 million. Their expenditure has been nowhere near that sum.
The failure to sign adequate replacements for the departed players could put Argyle’s
Championship status in jeopardy. Yes, the Pilgrims have to retain some of their transfer
income to help them cope with running costs – they do not break even on current gates –
but the best way to increase attendances is to provide an attractive and successful team.
Source: Metcalf, R., ‘Argyle viewpoint’, Western Morning News, 15 September 2008.
REAL WORLD 3.6
Breaking even is breaking out all over
Setanta sets its break-even target
Setanta Sports Holdings Ltd, the satellite TV broadcaster and rival of BSkyB, has a break-
even point of about 1.5 million subscribers. By April 2009, Setanta plans to have 4 million
subscribers.
Source: Fenton, B., ‘Setanta chases fresh targets’, Financial Times, 23 July 2008.
Superjumbo break-even point grows
German industrial group EADS is developing the Airbus A380 aircraft. The aircraft can
carry up to 555 passengers on each flight. When EADS approved development of the
plane in 2000, it was estimated that the business would need to sell 250 of them to break
even. By 2005, the break-even number had increased to 270, but by early 2008 the cost
of development had increased to the point where it was estimated that it would require
sales of 400 of the aircraft for it to break even. Expected total sales of the aircraft could
be about 1,000 over its commercial lifetime.
Source: ‘EADS and the A380’, Financial Times, 27 February 2008.
City Link to break even
City Link, the parcel delivery business owned by Rentokil Initial plc, was expected only to
break even in 2008. This was as a result of inadequate management information systems,
which led to loss of customers.
Source: Davoudi, S. and Urry, M., ‘Rentokil plunge spurs break-up fears’, Financial Times, 28 February 2008.
Real World 3.6 shows specific references to break-even point for three well-known
businesses.
FT
M03_ATRI3622_06_SE_C03.QXD 5/29/09 3:30 PM Page 76
If we cast our minds back to Chapter 2, where we discussed relevant costs for decision
making, we should recall that when we are trying to decide between two or more
possible courses of action, only costs that vary with the decision should be included in the
decision analysis.
For many decisions that involve relatively small variations from existing practice,
and/or relatively limited periods of time, fixed cost is not relevant to the decision, because
it will be the same irrespective of the decision made.
This is because either
l fixed cost elements tend to be impossible to alter in the short term
or
l managers are reluctant to alter them in the short term.
Using contribution to make decisions –
marginal analysis
USING CONTRIBUTION TO MAKE DECISIONS – MARGINAL ANALYSIS
77
REAL WORLD 3.7
Break-even analysis in practice
A survey of management accounting practice in the United States was conducted in 2003.
Nearly 2,000 businesses replied to the survey. These tended to be larger businesses, of
which about 40 per cent were manufacturers and about 16 per cent financial services; the
remainder were across a range of other industries.
The survey revealed that 62 per cent use break-even analysis extensively, with a further
22 per cent considering using the technique in the future.
Though the survey relates to the US, in the absence of UK evidence it provides some
insight into what is likely also to be practice in the UK and elsewhere in the developed world.
Source: 2003 Survey of Management Accounting, Ernst and Young, 2003.
Ali plc owns premises from which it provides a PC repair and maintenance service.
There is a downturn in demand for the service, and it would be possible for Ali plc to
carry on the business from smaller, cheaper premises.
Can you think of any reasons why the business might not immediately move to
smaller, cheaper premises?
We thought of broadly three reasons:
1 It is not usually possible to find a buyer for existing premises at very short notice and it
may be difficult to find available alternative premises quickly.
2 It may be difficult to move premises quickly where there is, say, delicate equipment to
be moved.
3 Management may feel that the downturn might not be permanent, and would thus be
reluctant to take such a dramatic step and deny itself the opportunity to benefit from a
possible revival of trade.
Activity 3.11
M03_ATRI3622_06_SE_C03.QXD 5/29/09 3:30 PM Page 77
We shall now consider some types of decisions where fixed cost can be regarded as
irrelevant. In making these decisions, we should have as our key strategic objective the
enhancement of owners’ (shareholders’) wealth. Since these decisions are short-term in
nature, this means that wealth will normally be increased by trying to generate as
much net cash inflow as possible.
In marginal analysis we concern ourselves just with costs and revenues that vary
with the decision and so this usually means that fixed cost is ignored. This is because
marginal analysis is usually applied to minor alterations in the level of activity, so it
tends to be true that the variable cost per unit will be equal to the marginal cost, which
is the additional cost of producing one more unit of output. Whilst this is normally the
case, there may be times when producing one more unit will involve a step in the fixed
cost. If this occurs, the marginal cost is not just the variable cost; it will include the
increment, or step, in the fixed cost as well.
Marginal analysis may be used in four key areas of decision making:
l accepting/rejecting special contracts;
l determining the most efficient use of scarce resources;
l make-or-buy decisions;
l closing or continuation decisions.
We shall now consider each of these areas in turn.
Accepting/rejecting special contracts
To understand how marginal analysis may be used in decisions as to whether to accept
or reject special contracts, let us consider the following activity.
CHAPTER 3 COST–VOLUME–PROFIT ANALYSIS
78
‘
‘
Cottage Industries Ltd (see Example 3.1 and Activity 3.6) has spare capacity in that its
basket makers have some spare time. An overseas retail chain has offered the business
an order for 300 baskets at a price of £13 each.
Without considering any wider issues, should the business accept the order?
(Assume that the business does not rent the machine.)
Since the fixed cost will be incurred in any case, it is not relevant to this decision. All we
need to do is see whether the price offered will yield a contribution. If it will, the business
will be better off by accepting the contract than by refusing it.
£
Additional revenue per unit 13
Additional cost per unit (12)
Additional contribution per unit 1
For 300 units, the additional contribution will be £300 (that is, 300 × £1). Since no fixed-
cost increase is involved, irrespective of what else is happening to the business, it will be
£300 better off by taking this contract than by refusing it.
Activity 3.12
As ever with decision making, there are other factors that are either difficult or
impossible to quantify. These should be taken into account before reaching a final deci-
M03_ATRI3622_06_SE_C03.QXD 5/29/09 3:30 PM Page 78
sion. In the case of Cottage Industries Ltd’s decision concerning the overseas customer,
these could include the following:
l The possibility that spare capacity will have been ‘sold off’ cheaply when there
might be another potential customer who will offer a higher price, but, by the time
they do so, the capacity will be fully committed. It is a matter of commercial judge-
ment as to how likely this will be.
l Selling the same product, but at different prices, could lead to a loss of customer
goodwill. The fact that a different price will be set for customers in different coun-
tries (that is, in different markets) may be sufficient to avoid this potential problem.
l If the business is going to suffer continually from being unable to sell its full pro-
duction potential at the ‘usual’ price, it might be better, in the long run, to reduce
capacity and make fixed-cost savings. Using the spare capacity to produce marginal
benefits may lead to the business failing to address this issue.
l On a more positive note, the business may see this as a way of breaking into the
overseas market. This is something that might be impossible to achieve if the busi-
ness charges its usual price.
The most efficient use of scarce resources
Normally, the output of a business is determined by customer demand for particular
goods or services. In some cases, however, output will be determined by the productive
capacity of the business. Limited productive capacity might stem from a shortage of
any factor of production – labour, raw materials, space, machine capacity and so on.
Such scarce factors are often known as key or limiting factors.
Where productive capacity acts as a brake on output, management must decide on
how best to meet customer demand. That is, it must decide which products, from the
range available, should be produced and how many of each should be produced.
Marginal analysis can be useful to management in such circumstances. The guiding
principle is that the most profitable combination of products will occur where the con-
tribution per unit of the scarce factor is maximised. Example 3.2 illustrates this point.
USING CONTRIBUTION TO MAKE DECISIONS – MARGINAL ANALYSIS
79
A business provides three different services, the details of which are as follows:
Service (code name) AX107 AX109 AX220
Selling price per unit (£)504065
Variable cost per unit (£) (25) (20) (35)
Contribution per unit (£)252030
Labour time per unit (hours) 5 3 6
Within reason, the market will take as many units of each service as can be pro-
vided, but the ability to provide the service is limited by the availability of labour,
all of which needs to be skilled. Fixed cost is not affected by the choice of service
provided because all three services use the same facilities.
The most profitable service is AX109 because it generates a contribution of
£6.67 (£20/3) an hour. The other two generate only £5.00 each an hour (£25/5
and £30/6). So, to maximise profit, priority should be given to the production
that maximises the contribution per unit of limiting factor.
Example 3.2
M03_ATRI3622_06_SE_C03.QXD 5/29/09 3:30 PM Page 79
Our first reaction might be that the business should provide only service AX220, as
this is the one that yields the highest contribution per unit sold. If so, we would have
been making the mistake of thinking that it is the ability to sell that is the limiting factor.
If the above analysis is not convincing, we can take a random number of available labour
hours and ask ourselves what is the maximum contribution (and, therefore, profit) that
could be made by providing each service exclusively. Bear in mind that there is no
shortage of anything else, including market demand, just a shortage of labour.
CHAPTER 3 COST–VOLUME–PROFIT ANALYSIS
80
A business makes three different products, the details of which are as follows:
Product (code name) B14 B17 B22
Selling price per unit (£) 25 20 23
Variable cost per unit (£) 10 8 12
Weekly demand (units) 25 20 30
Machine time per unit (hours) 4 3 4
Fixed cost is not affected by the choice of product because all three products use
the same machine. Machine time is limited to 148 hours a week.
Which combination of products should be manufactured if the business is to pro-
duce the highest profit?
Product (code name) B14 B17 B22
Selling price per unit (£) 25 20 23
Variable cost per unit (£) (10) (8) (12)
Contribution per unit (£) 15 12 11
Machine time per unit (hours) 4 3 4
Contribution per machine hour £3.75 £4.00 £2.75
Order of priority 2nd 1st 3rd
Therefore produce:
20 units of product B17 using 60 hours
22 units of product B14 using 88 hours
148 hours
This leaves unsatisfied the market demand for a further 3 units of product B14 and 30 units
of product B22.
Activity 3.13
What steps could be taken that might lead to a higher level of contribution for the busi-
ness in Activity 3.13?
The possibilities for improving matters that occurred to us are as follows:
l Consider obtaining additional machine time. This could mean obtaining a new machine,
subcontracting the machining to another business or, perhaps, squeezing a few more
hours a week out of the business’s own machine. Perhaps a combination of two or
more of these is a possibility.
l Redesign the products in a way that requires less time per unit on the machine.
l Increase the price per unit of the three products. This might well have the effect of
dampening demand, but the existing demand cannot be met at present, and it may be
more profitable in the long run to make a greater contribution on each unit sold than to
take one of the other courses of action to overcome the problem.
Activity 3.14
M03_ATRI3622_06_SE_C03.QXD 5/29/09 3:30 PM Page 80
Real World 3.8 contains information from a Financial Times article about the price
for using a new high-speed rail line.
Make-or-buy decisions
Businesses are frequently confronted by the need to decide whether to produce the
product or service that they sell themselves, or to buy it in from some other business.
Thus, a producer of electrical appliances might decide to subcontract the manufacture
of one of its products to another business, perhaps because there is a shortage of pro-
duction capacity in the producer’s own factory, or because it believes it to be cheaper
to subcontract than to make the appliance itself.
It might be just part of a product or service that is subcontracted. For example, the
producer may have a component for the appliance made by another manufacturer.
In principle, there is hardly any limit to the scope of make-or-buy decisions. Virtually
any part, component or service that is required in production of the main product or
service, or the main product or service itself, could be the subject of a make-or-buy
decision. So, for example, the personnel function of a business, which is normally
USING CONTRIBUTION TO MAKE DECISIONS – MARGINAL ANALYSIS
81
Going back to Activity 3.13, what is the maximum price that the business concerned
would logically be prepared to pay to have the remaining B14s machined by a subcon-
tractor, assuming that no fixed or variable cost would be saved as a result of not doing
the machining in-house?
Would there be a different maximum if we were considering the B22s?
If the remaining three B14s were subcontracted at no cost, the business would be able to
earn a contribution of £15 a unit, which it would not otherwise be able to gain. Therefore,
any price up to £15 a unit would be worth paying to a subcontractor to undertake the
machining. Naturally, the business would prefer to pay as little as possible, but anything
up to £15 would still make it worthwhile subcontracting the machining.
This would not be true of the B22s because they have a different contribution per unit;
£11 would be the relevant figure in their case.
Activity 3.15
REAL WORLD 3.8
Fast track
Rail freight operators will have to pay a premium rate for using the new ‘High Speed 1’
(HS1) line that links London to the Channel tunnel. With other lines on the UK rail network,
freight operators are required to pay only the marginal cost of running each train. This
would comprise the cost of the electricity, signalling and wear to the track that would not
have been incurred had the train not run. For using the HS1 line, operators will be asked
to pay twice the marginal cost of using the other lines. This is partly because HS1 has a
higher maintenance cost, but also so that the owner of the line, London and Continental
Railways, can make some profit from freight operations.
Source: Information taken from Wright, R., ‘Row over freight charges on fast rail line’, Financial Times, 14 July 2008.
FT
M03_ATRI3622_06_SE_C03.QXD 5/29/09 3:30 PM Page 81
performed in-house, could be subcontracted. At the same time, electrical power, which
is typically provided by an outside electrical utility business, could be generated in-house.
Obtaining services or products from a subcontractor is often called outsourcing.
Real World 3.9 provides an example of outsourcing by a well-known communica-
tions business.
CHAPTER 3 COST–VOLUME–PROFIT ANALYSIS
82
‘
REAL WORLD 3.9
Vodafone subcontracts IT work
Vodafone is in the process of outsourcing all of its IT development and maintenance
operations to a specialist organisation based in India. It is also outsourcing its internal
helpdesks.
Source: Vodafone Group plc Annual Report 2008.
Shah Ltd needs a component for one of its products. It can subcontract production of
the component to a subcontractor who will provide the components for £20 each. Shah
Ltd can produce the components internally for total variable cost of £15 per compon-
ent. Shah Ltd has spare capacity.
Should the component be subcontracted or produced internally?
The answer is that Shah Ltd should produce the component internally, since the variable
cost of subcontracting is greater by £5 (£20 − £15) than the variable cost of internal
manufacture.
Activity 3.16
Now assume that Shah Ltd (Activity 3.16) has no spare capacity, so it can only produce
the component internally by reducing its output of another of its products. While it is
making each component, it will lose contributions of £12 from the other product.
Should the component be subcontracted or produced internally?
The answer is to subcontract. In this case, both the variable cost of production and the
opportunity cost of lost contributions must be taken into account.
Thus, the relevant cost of internal production of each component is:
£
Variable cost of production of the component 15
Opportunity cost of lost production of the other product 12
27
This is obviously more costly than the £20 per component that will have to be paid to the
subcontractor.
Activity 3.17
M03_ATRI3622_06_SE_C03.QXD 5/29/09 3:30 PM Page 82
Closing or continuation decisions
It is quite common for businesses to produce separate financial statements for each
department or section, to try to assess their relative performance. Example 3.3 below
considers how marginal analysis can help decide how to respond where it is found that
a particular department underperforms.
USING CONTRIBUTION TO MAKE DECISIONS – MARGINAL ANALYSIS
83
What factors, other than the immediately financially quantifiable, would you consider
when making a make-or-buy decision?
We feel that there are two major factors:
1 The general problems of subcontracting, particularly
(a) loss of control of quality;
(b) potential unreliability of supply.
2 Expertise and specialisation. Generally, businesses should focus on their core compet-
ences. It is possible for most businesses, with sufficient determination, to do virtually
everything in-house. This may, however, require a level of skill and facilities that most
businesses neither have nor feel inclined to acquire. For example, though it is true that
most businesses could generate their own electricity, their managements tend to take
the view that this is better done by a specialist generator business. Specialists can
often do things more cheaply, with less risk of things going wrong.
Activity 3.18
Goodsports Ltd is a retail shop that operates through three departments, all in the
same premises. The three departments occupy roughly equal-sized areas of the
premises. The trading results for the year just finished showed the following:
Total Sports Sports General
equipment clothes clothes
£000 £000 £000 £000
Sales revenue 534 254 183 97
Cost ( 482) (213) ( 163) (106)
Profit/(loss) 52 41 20 (9)
It would appear that if the general clothes department were to close, the business
would be more profitable, by £9,000 a year, assuming last year’s performance to
be a reasonable indication of future performance.
When the cost is analysed between that part that is variable and that part that
is fixed, however, the contribution of each department can be deduced and the
following results obtained:
Example 3.3
‘
M03_ATRI3622_06_SE_C03.QXD 5/29/09 3:30 PM Page 83
CHAPTER 3 COST–VOLUME–PROFIT ANALYSIS
84
Total Sports Sports General
equipment clothes clothes
£000 £000 £000 £000
Sales revenue 534 254 183 97
Variable cost (344) (167 ) (117 ) (60)
Contribution 190 87 66 37
Fixed cost (rent and so on) (138) (46 ) (46 ) (46 )
Profit/(loss) 52 41 20 (9)
Now it is obvious that closing the general clothes department, without any other
developments, would make the business worse off by £37,000 (the department’s
contribution). The department should not be closed, because it makes a positive
contribution. The fixed cost would continue whether the department was closed
or not. As can be seen from the above analysis, distinguishing between variable
and fixed cost, and deducing the contribution, can make the picture a great deal
clearer.
Example 3.3 continued
In considering Goodsports Ltd (in Example 3.3), we saw that the general clothes
department should not be closed ‘without any other developments’.
What ‘other developments’ could affect this decision, making continuation either
more attractive or less attractive?
The things that we could think of are as follows:
l Expansion of the other departments or replacing the general clothes department with a
completely new activity. This would make sense only if the space currently occupied by
the general clothes department could generate contributions totalling at least £37,000
a year.
l Sub-letting the space occupied by the general clothes department. Once again, this
would need to generate a net rent greater than £37,000 a year to make it more finan-
cially beneficial than keeping the department open.
l Keeping the department open, even if it generated no contribution whatsoever (assum-
ing that there is no other use for the space), may still be beneficial. If customers are
attracted into the shop because it has general clothing, they may then buy something
from one of the other departments. In the same way, the activity of a sub-tenant might
attract customers into the shop. (On the other hand, it might drive them away!)
Activity 3.19
M03_ATRI3622_06_SE_C03.QXD 5/29/09 3:30 PM Page 84
SUMMARY
85
Khan Ltd can render three different types of service (Alpha, Beta and Gamma) using the
same staff. Various estimates for next year have been made as follows:
Service Alpha Beta Gamma
Selling price (£/unit) 30 39 20
Variable material cost (£/unit) 15 18 10
Other variable costs (£/unit) 6 10 5
Share of fixed cost (£/unit) 8 12 4
Staff time required (hours) 2 3 1
Fixed cost for next year is expected to total £40,000.
Required:
(a) If the business were to render only service Alpha next year, how many units of the
service would it need to provide in order to break even? (Assume for this part of the
question that there is no effective limit to market size and staffing level.)
(b) If the business has a maximum of 10,000 staff hours next year, in which order of pre-
ference would the three services come?
(c) If the maximum market for next year for the three services is
Alpha 3,000 units
Beta 2,000 units
Gamma 5,000 units
what quantities of which service should the business provide next year and how much
profit would this be expected to yield?
The answer to this question can be found in Appendix B at the back of the book.
Self-assessment question 3.1
The main points in this chapter may be summarised as follows:
Cost behaviour
l Fixed cost is independent of the level of activity (an example is rent).
l Variable cost varies with the level of activity (an example is raw materials).
l Semi-fixed (semi-variable) cost is a mixture of fixed and variable cost (an example is
electricity).
Break-even analysis
l The break-even point (BEP) is the level of activity (in units of output or sales rev-
enue) at which total (fixed + variable) cost = total sales revenue.
l Calculation of the BEP is as follows:
BEP (in units of output) =
l Knowledge of the BEP for a particular activity can be used to help assess risk.
l Calculation of the volume of activity (t) required to achieve a target profit is as follows:
t =
Fixed cost + Target profit
(Sales revenue per unit − Variable cost per unit)
Fixed cost for the period
Contribution per unit
SUMMARY
M03_ATRI3622_06_SE_C03.QXD 5/29/09 3:30 PM Page 85
l Contribution per unit = sales revenue per unit less variable cost per unit.
l Contribution margin ratio = (× 100%)
l Margin of safety = excess of planned volume of activity over BEP.
l Operating gearing = the extent to which the total cost of some activity is fixed rather
than variable.
l Profit–volume (PV) chart is an alternative approach to BE chart, which is easier to
understand.
l Economists tend to take a different approach to BE, taking account of economies
(and diseconomies) of scale and of the fact that, generally, to be able to sell large vol-
umes, price per unit tends to fall.
Weaknesses of break-even analysis
l There are non-linear relationships between costs, revenues and volume.
l There may be stepped fixed costs. Most fixed costs are not fixed over all volumes of
activity.
l Multi-product businesses have problems in allocating fixed costs to particular activities.
Marginal analysis (ignores fixed cost where these are not affected by the decision)
l Accepting/rejecting special contracts – we consider only the effect on contributions.
l Using scarce resources – the limiting factor is most effectively used by maximising
its contribution per unit.
l Make-or-buy decisions – we take the action that leads to the highest total contributions.
l Closing/continuing an activity – should be assessed by net effect on total contributions.
contribution
sales revenue
If you would like to explore the topics covered in this chapter in more depth, we recommend the
following books:
Drury, C., Management and Cost Accounting, 7th edn, Cengage Learning, 2007, chapter 8.
Hilton, R., Managerial Accounting, 6th edn. McGraw-Hill Irwin, 2005, chapter 8.
Horngren, C., Foster, G., Datar, S., Rajan, M. and Ittner, C., Cost Accounting: A Managerial
Emphasis, 13th edn, Prentice Hall International, 2008, chapter 3.
McWatters, C., Zimmerman, J. and Morse, D., Management Accounting: Analysis and Interpretation,
FT Prentice Hall, 2008, chapter 5.
Further reading
CHAPTER 3 COST–VOLUME–PROFIT ANALYSIS
86
Fixed cost p. 56
Variable cost p. 56
Stepped fixed cost p. 58
Semi-fixed (semi-variable) cost p. 59
Break-even analysis p. 60
Break-even chart p. 61
Break-even point (BEP) p. 61
Contribution per unit p. 66
Contribution margin ratio p. 67
Margin of safety p. 67
Operating gearing (operational
gearing) p. 70
Profit–volume (PV) chart p. 72
Economies of scale p. 73
Relevant range p. 74
Marginal analysis p. 78
Marginal cost p. 78
Outsourcing p. 82
Key terms
‘
M03_ATRI3622_06_SE_C03.QXD 5/29/09 3:30 PM Page 86
Answers to these questions can be found in Appendix C at the back of the book.
Define the terms fixed cost and variable cost. Explain how an understanding of the distinction
between fixed cost and variable cost can be useful to managers.
What is meant by the BEP for an activity? How is the BEP calculated? Why is it useful to know
the BEP?
When we say that some business activity has high operating gearing, what do we mean? What
are the implications for the business of high operating gearing?
If there is a scarce resource that is restricting sales, how will the business maximise its profit?
Explain the logic of the approach that you have identified for maximising profit.
3.4
3.3
3.2
3.1
Exercises 3.4 to 3.8 are more advanced than 3.1 to 3.3. Those exercises with coloured
numbers have answers in Appendix D at the back of the book.
The management of a business is concerned about its inability to obtain enough fully trained
labour to enable it to meet its present budget projection.
Service:
Alpha Beta Gamma Total
£000 £000 £000 £000
Variable cost
Materials 6 4 5 15
Labour 9 6 12 27
Expenses 3 2 2 7
Allocated fixed cost 6 15 12 33
Total cost 24 27 31 82
Profit 15 2 2 19
Sales revenue 39 29 33 101
The amount of labour likely to be available amounts to £20,000. All of the variable labour is paid
at the same hourly rate. You have been asked to prepare a statement of plans ensuring that at
least 50 per cent of the budgeted sales revenues are achieved for each service, and the balance
of labour is used to produce the greatest profit.
Required:
(a) Prepare the statement, with explanations, showing the greatest profit available from the
limited amount of skilled labour available, within the constraint stated. Hint: Remember that
all labour is paid at the same rate.
(b) What steps could the business take in an attempt to improve profitability, in the light of the
labour shortage?
3.1
EXERCISES
87
REVIEW QUESTIONS
EXERCISES
M03_ATRI3622_06_SE_C03.QXD 5/29/09 3:30 PM Page 87
Lannion and Co. is engaged in providing and marketing a standard advice service. Summarised
results for the past two months reveal the following:
October November
Sales (units of the service) 200 300
Sales revenue (£) 5,000 7,500
Operating profit (£) 1,000 2,200
There were no price changes of any description during these two months.
Required:
(a) Deduce the BEP (in units of the service) for Lannion and Co.
(b) State why the business might find it useful to know its BEP.
A hotel group prepares financial statements on a quarterly basis. The senior management is
reviewing the performance of one hotel and making plans for next year.
The managers have in front of them the results for this year (based on some actual results
and some forecasts to the end of this year):
Quarter Sales revenue Profit/(loss)
£000 £000
1 400 (280)
2 1,200 360
3 1,600 680
4 800 40
Total 4,000 800
The total estimated number of visitors (guest nights) for this year is 50,000. The results follow a
regular pattern; there are no unexpected cost fluctuations beyond the seasonal trading pattern
shown above. For next year, management anticipates an increase in unit variable cost of 10 per
cent and a profit target for the hotel of £1 million. These will be incorporated into its plans.
Required:
(a) Calculate the total variable and total fixed cost of the hotel for this year. Show the provi-
sional annual results for this year in total, showing variable and fixed cost separately. Show
also the revenue and cost per visitor.
(b) 1 If there is no increase in visitors for next year, what will be the required revenue rate per
hotel visitor to meet the profit target?
2 If the required revenue rate per visitor is not raised above this year’s level, how many
visitors will be required to meet the profit target?
(c) Outline and briefly discuss the assumptions that are made in typical PV or break-even
analysis, and assess whether they limit its usefulness.
Motormusic Ltd makes a standard model of car radio, which it sells to car manufacturers for £60
each. Next year the business plans to make and sell 20,000 radios. The business’s costs are as
follows:
Manufacturing
Variable materials £20 per radio
Variable labour £14 per radio
Other variable costs £12 per radio
Fixed cost £80,000 per year
Administration and selling
Variable £3 per radio
Fixed £60,000 per year
3.4
3.3
3.2
CHAPTER 3 COST–VOLUME–PROFIT ANALYSIS
88
M03_ATRI3622_06_SE_C03.QXD 5/29/09 3:30 PM Page 88
Required:
(a) Calculate the break-even point for next year, expressed both in quantity of radios and sales
value.
(b) Calculate the margin of safety for next year, expressed both in quantity of radios and sales
value.
A business makes three products, A, B and C. All three products require the use of two types
of machine: cutting machines and assembling machines. Estimates for next year include the
following:
Product A B C
Selling price (£ per unit) 25 30 18
Sales demand (units) 2,500 3,400 5,100
Material cost (£ per unit) 12 13 10
Variable production cost (£ per unit) 7 4 3
Time required per unit on cutting machines (hours) 1.0 1.0 0.5
Time required per unit on assembling machines (hours) 0.5 1.0 0.5
Fixed cost for next year is expected to total £42,000. It is the business’s policy for each unit of
production to absorb these in proportion to its total variable cost.
The business has cutting-machine capacity of 5,000 hours a year and assembling-machine
capacity of 8,000 hours a year.
Required:
(a) State, with supporting workings, which products in which quantities the business should
plan to make next year on the basis of the above information. Hint: First determine which
machines will be a limiting factor (scarce resource).
(b) State the maximum price per product that it would be worth the business paying to a sub-
contractor to carry out that part of the work that could not be done internally.
Darmor Ltd has three products, which require the same production facilities. Information about
the production cost for one unit of its products is as follows:
Product X Y Z
£££
Labour: Skilled 6 9 3
Unskilled 2 4 10
Materials 12 25 14
Other variable costs 3 7 7
Fixed cost 5 10 10
All labour and materials are variable costs. Skilled labour is paid £12 an hour, and unskilled
labour is paid £8 an hour. All references to labour cost above are based on basic rates of pay.
Skilled labour is scarce, which means that the business could sell more than the maximum that
it is able to make of any of the three products.
Product X is sold in a regulated market, and the regulators have set a price of £30 per unit
for it.
Required:
(a) State, with supporting workings, the price that must be charged for products Y and Z, such
that the business would find it equally profitable to make and sell any of the three products.
(b) State, with supporting workings, the maximum rate of overtime premium that the business
would logically be prepared to pay its skilled workers to work beyond the basic time.
Intermediate Products Ltd produces four types of water pump. Two of these (A and B) are sold
by the business. The other two (C and D) are incorporated, as components, into another of the
3.7
3.6
3.5
EXERCISES
89
M03_ATRI3622_06_SE_C03.QXD 5/29/09 3:30 PM Page 89
business’s products. Neither C nor D is incorporated into A or B. Costings (per unit) for the pro-
ducts are as follows:
ABCD
££££
Variable materials 15 20 16 17
Variable labour 25 10 10 15
Other variable costs 5322
Fixed costs 20 8 8 12
65 41 36 46
Selling price (per unit) £70 £45
There is an outside supplier who is prepared to supply unlimited quantities of products C and D
to the business, charging £40 per unit for product C and £55 per unit for product D.
Next year’s estimated demand for the products, from the market (in the case of A and B) and
from other production requirements (in the case of C and D), is as follows:
Units
A 5,000
B 6,000
C 4,000
D 3,000
For strategic reasons, the business wishes to supply a minimum of 50 per cent of the above
demand for products A and B.
Manufacture of all four products requires the use of a special machine. The products require
time on this machine as follows:
Hours
per unit
A 0.5
B 0.4
C 0.5
D 0.3
Next year there are expected to be a maximum of 6,000 special-machine hours available. There
will be no shortage of any other factor of production.
Required:
(a) State, with supporting workings and assumptions, which quantities of which products the
business should plan to make next year.
(b) Explain the maximum amount that it would be worth the business paying per hour to rent a
second special machine.
(c) Suggest ways, other than renting an additional special machine, that could solve the prob-
lem of the shortage of special-machine time.
Gandhi Ltd renders a promotional service to small retailing businesses. There are three levels of
service: the ‘basic’, the ‘standard’ and the ‘comprehensive’. On the basis of past experience,
the business plans next year to work at absolutely full capacity as follows:
Service Number of Selling Variable cost
units of the service price per unit
££
Basic 11,000 50 25
Standard 6,000 80 65
Comprehensive 16,000 120 90
3.8
CHAPTER 3 COST–VOLUME–PROFIT ANALYSIS
90
M03_ATRI3622_06_SE_C03.QXD 5/29/09 3:30 PM Page 90
The business’s fixed cost totals £660,000 a year. Each service takes about the same length of
time, irrespective of the level.
One of the accounts staff has just produced a report that seems to show that the standard
service is unprofitable. The relevant extract from the report is as follows:
Standard service cost analysis
£
Selling price per unit 80
Variable cost per unit (65)
Fixed cost per unit (20) (£660,000/(11,000 + 6,000 + 16,000))
Loss (5)
The producer of the report suggests that the business should not offer the standard service
next year.
Required:
(a) Should the standard service be offered next year, assuming that the quantity of the other
services could not be expanded to use the spare capacity?
(b) Should the standard service be offered next year, assuming that the released capacity
could be used to render a new service, the ‘nova’, for which customers would be charged
£75, and which would have variable cost of £50 and take twice as long as the other three
services?
(c) What is the minimum price that could be accepted for the basic service, assuming that the
necessary capacity to expand it will come only from not offering the standard service?
EXERCISES
91
M03_ATRI3622_06_SE_C03.QXD 5/29/09 3:30 PM Page 91
Full costing
LEARNING OUTCOMES
Full (absorption) costing is a widely used approach that takes account of all of the
cost of producing a particular product or service. In this chapter, we shall see how
this approach can be used to deduce the cost of some productive activity, such as
producing a unit of product (for example a tin of baked beans), providing a unit of
service (for example, a car repair) or creating a facility (for example, building an
Olympic athletics stadium). The precise approach taken to deducing full cost will
depend on whether each product or service is identical to the next or whether
each job has its own individual characteristics. It will also depend on whether the
business accounts for overheads on a segmental basis. We shall look at how full
(or absorption) costing is carried out and we shall also consider its usefulness for
management purposes.
This chapter considers the traditional, but still very widely used, form of full
costing. In Chapter 5 we shall consider activity-based costing, which is a more
recently developed approach.
INTRODUCTION
4
When you have completed this chapter, you should be able to:
l Deduce the full (absorption) cost of a cost unit in a single-product
environment.
l Deduce the full (absorption) cost of a cost unit in a multi-product
environment.
l Discuss the problems of deducing full (absorption) cost in practice.
l Discuss the usefulness of full (absorption) cost information to managers.
M04_ATRI3622_06_SE_C04.QXD 5/29/09 10:35 AM Page 92
As we saw in Chapter 1, the only point in providing management accounting infor-
mation is to help managers make more informed decisions. There are broadly four
areas where managers use information concerning the full cost of the business’s pro-
ducts or services. These are:
1 Pricing and output decisions. Having full cost information can help managers to make
decisions on the price to be charged to customers for the business’s products or ser-
vices. Linked to the pricing decisions are also decisions on the number of products
or services that the business should seek to provide to the market.
2 Exercising control. Managers need information to help them make decisions that are
aimed at getting the business back on course if plans are not being met. Budgets are
typically expressed in full cost terms. This means that periodic reports that compare
actual performance with budgets need to be expressed in the same full cost terms.
3 Assessing relative efficiency. Full cost information helps managers to compare the cost
of doing something in one way, or place, with its cost if done in a different way, or
place. For example, a car manufacturer may find it useful to compare the cost of
building a particular model of car in one of its plants, rather than another. This
could help them decide on where to locate future production.
4 Assessing performance. The level of profit, or income, generated over a period is an
important measure of business performance. To measure profit, or income, we need
to compare sales revenue with the associated expenses. Where a business produces
a product or renders a service, a major expense will be the cost of making the pro-
duct or rendering the service. Logically this is the full cost of whatever was sold.
Measuring income provides managers (and other users) with information that can
help them make a whole range of decisions.
Later in the chapter we shall consider some of the issues surrounding these four purposes.
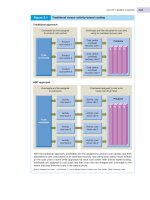
Figure 4.1 shows the four uses of full cost information.
Why do managers want to know the full cost?
WHY DO MANAGERS WANT TO KNOW THE FULL COST?
93
Uses of full cost by managers
Figure 4.1
Managers use full cost information for four main purposes.
M04_ATRI3622_06_SE_C04.QXD 5/29/09 10:35 AM Page 93
Now let us consider Real World 4.1.
When considering the information in Real World 4.1, an important question that
arises is ‘what does the full cost of each type of procedure include?’ Does it simply
include the cost of the salaries earned by doctors and nurses during the time spent with
the patient or does it also include the cost of other items? If the cost of other items is
included, how is it determined? Would it include, for example, a charge for
l the artificial hip and drugs provided for the patient
l equipment used in the operating theatre
l administrative and support staff within the hospital
l heating and lighting
l maintaining the hospital buildings
l laundry and cleaning?
If the cost of such items is included, how can an appropriate charge be determined? If,
on the other hand, it is not included, are the figures of £4,967 and £4,293 potentially
misleading?
These questions are the subject of this chapter.
Full cost is the total amount of resources, usually measured in monetary terms,
sacrificed to achieve a particular objective. It takes account of all resources sacrificed to
achieve that objective. Thus, if the objective were to supply a customer with a product
or service, the cost of all aspects relating to the production of the product or provision
What is full costing?
CHAPTER 4 FULL COSTING
94
‘
REAL WORLD 4.1
Operating cost
An interesting example of the use of full cost for pricing decisions is occuring in the
National Health Service (NHS). In recent years, the funding of hospitals has radically
changed. A new system of Payment by Results (PBR) requires the Department of Health
to produce a list of prices for an in-patient spell in hospital that covers different types of
procedures. This list, which is revised annually, reflects the prices that hospitals will be
paid by the government for carrying out the different procedures.
For 2007/8, the price list included the following figures:
£4,967 for carrying out a hip replacement operation
£4,293 for treating a stroke
These figures are based on the full cost of undertaking each type of procedure in 2006/7
(but adjusted for inflation). Full cost figures were submitted by all NHS hospitals for that
year as part of their annual accounting process and an average for each type of procedure
was then calculated. Figures for other procedures on the price list were derived in the
same way.
Source: Cole, A. and Robjent, G., ‘Payment by results – Policy in focus’, Chartered Society of Physiotherapists, 20 June 2007.
M04_ATRI3622_06_SE_C04.QXD 5/29/09 10:35 AM Page 94
of the service would be included as part of the full cost. To derive the full cost figure,
we must accumulate the elements of cost incurred and then assign them to the par-
ticular product or service.
The logic of full costing is that the entire cost of running a particular facility, say an
office, is part of the cost of the output of that office. For example, the rent may be a
cost that will not alter merely because we provide one more unit of the service, but if
the office were not rented there would be nowhere for the staff who provide the ser-
vice to work, so rent is an important element of the cost of each cost unit of that
service. A cost unit is one unit of whatever is having its cost determined. This is usu-
ally one unit of output of a particular product or service.
In the sections that follow we shall first see how full costing is applied to a single-
product business and then consider how it is done for a multi-product one.
The simplest case for which to deduce the full cost per unit is where the business has
only one product or service, that is, each unit of its production is identical. Here it is
simply a question of adding up all of the elements of cost of production incurred in a
particular period (materials, labour, rent, fuel, power and so on) and dividing this total
by the total number of units of output for that period.
Single-product businesses
SINGLE-PRODUCT BUSINESSES
95
‘
‘
In practice, there can be problems in deciding exactly how much cost was incurred.
In the case of Fruitjuice Ltd, for example, how is the cost of depreciation deduced? It
is certainly an estimate, and so its reliability is open to question. The cost of raw mater-
ials may also be a problem. Should we use the relevant cost of the raw materials (in this
case, almost certainly the replacement cost), or the actual price paid for it (historic
cost)? If the cost per litre is to be used for some decision-making purpose (which it
should be), the replacement cost is probably more logical. In practice, however, it
seems that historic cost is more often used to deduce full cost. It is not clear why this
should be the case.
Fruitjuice Ltd has just one product, a sparkling orange drink that is marketed as Orange
Fizz. During last month the business produced 7,300 litres of the drink. The cost
incurred was made up as follows:
£
Ingredients (oranges and so on) 390
Fuel 85
Rent of premises 350
Depreciation of equipment 75
Labour 880
What is the full cost per litre of producing Orange Fizz?
This figure is found by simply adding together all of the elements of cost incurred and then
dividing by the number of litres produced:
£(390 + 85 + 350 + 75 + 880)/7,300 = £0.24 per litre
Activity 4.1
M04_ATRI3622_06_SE_C04.QXD 5/29/09 10:35 AM Page 95
There can also be problems in deciding precisely how many units of output were
produced. If making Orange Fizz is not a very fast process, some of the drink will prob-
ably be in the process of being made at any given moment. This, in turn, means that
some of the cost incurred last month was for some Orange Fizz that was work in progress
at the end of the month, so is not included in last month’s output quantity of 7,300
litres. Similarly, part of the 7,300 litres might well have been started and incurred cost
in the previous month, yet all of those litres were included in the 7,300 litres that we
used in our calculation of the cost per litre. Work in progress is not a serious problem,
but some adjustment for the value of opening and closing work in progress for the par-
ticular period needs to be made if reliable full cost information is to be obtained.
This approach to full costing, which can be taken where all of the output consists of
identical, or near identical items (of goods or services), is often referred to as process
costing.
Most businesses produce more than one type of product or service. In this situation,
the units of output of the product, or service, will not be identical and so the approach
used with litres of Orange Fizz in Activity 4.1 is inappropriate. Although it is reason-
able to assign an identical cost to units of output that are identical, it is not reasonable
to do this where the units of output are obviously different. It would not be reason-
able, for example, to assign the same cost to each car repair carried out by a garage, irre-
spective of the complexity and size of the repair.
Direct and indirect cost
To provide full cost information, we need to have a systematic approach to accumu-
lating the elements of cost and then assigning this total cost to particular cost units on
some reasonable basis. Where cost units are not identical, the starting point is to sep-
arate cost into two categories: direct cost and indirect cost.
l Direct cost. This is the type of cost that can be identified with specific cost units.
That is to say, the effect of the cost can be measured in respect of each particular cost
unit. The main examples of a direct cost are direct materials and direct labour. Thus,
in determining the cost of a motor car repair by a garage, both the cost of spare parts
used in the repair and the cost of the mechanic’s time would be part of the direct cost
of that repair. Collecting elements of direct cost is a simple matter of having a cost-
recording system that is capable of capturing the cost of direct materials used on each
job and the cost, based on the hours worked and the rate of pay, of direct workers.
l Indirect cost (or overheads). These are all other elements of cost, that is, those that
cannot be directly measured in respect of each particular cost unit (job). Thus, the
rent of the garage premises would be an indirect cost of a motor car repair.
We shall use the terms ‘indirect cost’ and ‘overheads’ interchangeably for the
remainder of this book. Indirect cost is also sometimes known as common cost because
it is common to all of the output of the production unit (for example, factory or depart-
ment) for the period.
Real World 4.2 gives some indication of the relative importance of direct and indir-
ect costs in practice.
Multi-product businesses
CHAPTER 4 FULL COSTING
96
‘
‘
‘
‘
M04_ATRI3622_06_SE_C04.QXD 5/29/09 10:35 AM Page 96
MULTI-PRODUCT BUSINESSES
97
REAL WORLD 4.2
Counting the cost
A recent survey of 176 UK businesses operating in various industries, all with an annual
turnover of more than £50 million, was conducted by Al-Omiri and Drury. They discovered
that the total cost of the businesses’ output, on average, is split between direct and indir-
ect costs as follows:
Direct cost Indirect cost
Per cent Per cent
All 176 businesses 69 31
Manufacturing businesses (91) 75 25
Service and retail businesses (85) 49 51
For the manufacturers, the 75 per cent direct cost was, on average, made up as follows:
Per cent
Direct materials 52
Direct labour 14
Other direct costs 9
Source: Al-Omiri, M. and Drury, C., ‘A survey of factors influencing the choice of product costing systems in UK organisations’,
Management Accounting Research, December 2007, pp. 399 –424.
A more extensive recent survey of management accounting practice in the US, with nearly
2,000 responses, showed similar results. Like the UK survey (above), this tended to relate
to larger businesses. About 40% were manufacturers and about 16% financial services;
the remainder were from a range of other industries.
This survey revealed that, of total cost, indirect cost accounted for between 34 per cent
for retailers (lowest) and 42 per cent for manufacturers (highest), with other industries’ pro-
portion of indirect cost falling within the 34 per cent to 42 per cent range. Financial and
commercial businesses showed an average indirect cost percentage of 38 per cent.
Source: 2003 Survey of Management Accounting, Ernst and Young, 2003.
A garage bases its prices on the direct cost of each job (car repair) that it carries out.
How could the garage collect the direct cost (labour and materials) information con-
cerning a particular job?
Usually, direct workers are required to record how long was spent on each job. Thus,
the mechanic doing the job would record the length of time worked on the car by direct
workers (that is, the mechanic concerned and any colleagues). The stores staff would
normally be required to keep a record of the cost of parts and materials used on each job.
A ‘job sheet’ will normally be prepared – perhaps on the computer – for each individual
job. Staff must get into the routine of faithfully recording all elements of direct labour and
materials applied to the job.
Activity 4.2
M04_ATRI3622_06_SE_C04.QXD 5/29/09 10:35 AM Page 97
Job costing
The term job costing is used to describe the way in which we identify the full cost per
cost unit (unit of output or ‘job’) where the cost units differ. To cost (that is, deduce
the full cost of) a particular cost unit, we first identify the direct cost of the cost unit,
which, by the definition of direct cost, is fairly straightforward. We then seek to
‘charge’ each cost unit with a fair share of indirect cost (overheads). Put another way,
cost units will absorb overheads. This leads to full costing also being called absorption
costing. The absorption process is shown graphically in Figure 4.2.
CHAPTER 4 FULL COSTING
98
‘
‘
The relationship between direct cost and indirect cost
Figure 4.2
The full cost of any particular job is the sum of those costs that can be measured specifically in
respect of the job (direct costs) and a share of those costs that create the environment in which
production (of an object or service) can take place, but which do not relate specifically to any
particular job (overheads).
Sparky Ltd is a business that employs a number of electricians. The business under-
takes a range of work for its customers, from replacing fuses to installing complete
wiring systems in new houses.
In respect of a particular job done by Sparky Ltd, into which category (direct or
indirect) would each of the following cost elements fall?
l the wages of the electrician who did the job
l depreciation of the tools used by the electrician
l the salary of Sparky Ltd’s accountant
l the cost of cable and other materials used on the job
l rent of the premises where Sparky Ltd stores its inventories of cable and other
materials
Only the electrician’s wages earned while working on the particular job and the cost of the
materials used on the job are included in direct cost. This is because it is possible to mea-
sure how much time (and therefore the direct labour cost) was spent on the particular job
and the amount of materials used (and therefore the direct material cost) in the job.
All of the others are included in the general cost of running the business and, as such,
must form part of the indirect cost of doing the job, but they cannot be directly measured
in respect of the particular job.
Activity 4.3
M04_ATRI3622_06_SE_C04.QXD 5/29/09 10:35 AM Page 98
It is important to note that whether a cost is direct or indirect depends on the item
being costed – the cost objective. To refer to indirect cost without identifying the cost
objective is incorrect.
The apparent similarity of Figure 4.3 to Figure 4.2 seems to lead some people to
believe that variable cost and direct cost are the same and that fixed cost and indirect
cost (overheads) are the same. This is incorrect.
The notions of fixed and variable are concerned with cost behaviour in the face of
changes in the volume of activity. The notions of direct and indirect, on the other
hand, are concerned with the extent to which cost elements can be measured in respect
of particular cost units (jobs). The two sets of notions are entirely different. Though it
may be true that there is a tendency for fixed cost elements to be indirect (overheads)
MULTI-PRODUCT BUSINESSES
99
‘
Naturally, broader-reaching cost objectives, such as operating Sparky Ltd for a month,
tend to include a higher proportion of direct cost than do more limited ones, such as
a particular job done by Sparky Ltd. As we shall see shortly, this makes costing broader
cost objectives rather more straightforward than costing narrower ones. It is generally
the case that direct cost is easier to deal with than indirect cost.
Full (absorption) costing and the behaviour of cost
We saw in Chapter 3 that the full cost of doing something (or total cost, as it is usu-
ally known in the context of marginal analysis) can be analysed between the fixed and
the variable elements. This is illustrated in Figure 4.3.
Into which category, direct or indirect, would each of the elements of cost listed in
Activity 4.3 fall, if we were seeking to find the cost of operating the entire business of
Sparky Ltd for a month?
The answer is that all of them will form part of the direct cost, since they can all be related
to, and measured in respect of, running the business for a month.
Activity 4.4
The relationship between fixed cost, variable cost and total
cost
Figure 4.3
The total cost of a job is the sum of the cost that remains the same irrespective of the level of
activity (fixed cost) and that which varies according to the level of activity (variable cost).
M04_ATRI3622_06_SE_C04.QXD 5/29/09 10:35 AM Page 99