Tools for Business Decision Management Makers_4 pptx
Bạn đang xem bản rút gọn của tài liệu. Xem và tải ngay bản đầy đủ của tài liệu tại đây (888.68 KB, 33 trang )
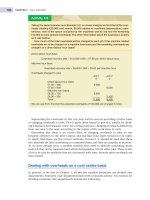
Traditional versus activity-based costing
Figure 5.1
With the traditional approach, overheads are first assigned to product cost centres and then
absorbed by cost units based on an overhead recovery rate (using direct labour hours worked
on the cost units or some other approach) for each cost centre. With activity-based costing,
overheads are assigned to cost pools and then cost units are charged with overheads to the
extent that they drive the costs in the various pools.
Source: Adapted from Innes, J. and Mitchell, F., Activity Based Costing: A Review with Case Studies, CIMA Publishing, 1990.
ACTIVITY-BASED COSTING
141
M05_ATRI3622_06_SE_C05.QXD 5/29/09 4:22 PM Page 141
CHAPTER 5 COSTING AND PRICING IN A COMPETITIVE ENVIRONMENT
142
Comma Ltd manufactures two types of Sprizzer – Standard and Deluxe. Each
product requires the incorporation of a difficult-to-handle special part (one of
them for a Standard and four for a Deluxe). Both of these products are made in
batches (large batches for Standards and small ones for Deluxes). Each new batch
requires that the production facilities are ‘set up’.
Details of the two products are:
Standard Deluxe
Annual production and sales – units 12,000 12,000
Sales price per unit £65 £87
Batch size – units 1,000 50
Direct labour time per unit – hours 2 2
1
/2
Direct labour rate per hour £8 £8
Direct material cost per unit £22 £32
Number of special parts per unit 1 4
Number of set-ups per batch 1 3
Number of separate material issues from stores per batch 1 1
Number of sales invoices issued per year 50 240
In recent months, Comma Ltd has been trying to persuade customers who buy
the Standard to purchase the Deluxe instead. An analysis of overhead costs for
Comma Ltd has provided the following information.
Overhead cost analysis £ Cost driver
Set-up cost 73,200 Number of set-ups
Special part handling cost 60,000 Number of special parts
Customer invoicing cost 29,000 Number of invoices
Material handling cost 63,000 Number of batches
Other overheads 108,000 Labour hours
Required:
(a) Calculate the profit per unit and the return on sales for Standard and Deluxe
Sprizzers using
(i) the traditional direct-labour-hour based absorption of overheads;
(ii) activity-based costing methods.
(b) Comment on the managerial implications for Comma Ltd of the results in
(a) above.
Solution
Using the traditional full (absorption) costing approach that we considered in
Chapter 4, the overheads are added together and an overheads recovery rate
deduced as follows:
Overheads £
Set-up cost 73,200
Special part handling cost 60,000
Customer invoicing cost 29,000
Material handling cost 63,000
Other overheads 108,000
333,200
Example 5.3
M05_ATRI3622_06_SE_C05.QXD 5/29/09 4:22 PM Page 142
ACTIVITY-BASED COSTING
143
Overhead recovery rate =
=
=
= £6.17 per hour
The total cost per unit of each type of Sprizzer is calculated by adding the direct
cost to the overheads cost per unit. The overheads cost per unit is calculated by
multiplying the number of direct labour hours spent on the product (2 hours for
each Standard and 2
1
/2 hours for each Deluxe) by the overheads recovery rate
calculated above. Hence:
Standard Deluxe
Direct cost £ £
Labour 16.00 20.00
Material 22.00 32.00
Indirect cost
Overheads (£6.17 per hour) 12.34 15.43
Total cost per unit 50.34 67.43
The return on sales is calculated as follows:
Standard Deluxe
£ per unit £ per unit
Selling price 65.00 87.00
Total cost (see above) 50.34 67.43
Profit 14.66 19.57
Return on sales [(profit/sales) × 100%] 22.55% 22.49%
Using the ABC costing approach, the activity cost driver rates will be calculated as
follows:
(a) (b) (c) (d) (e)
Overhead Driver Standard Deluxe Total Costs Driver
cost pool driver driver driver £ rate
volume volume volume £
(a + b) (d/c)
Set-up Set-ups per 12 720 732 73,200 100
batch
Special part Special parts 12,000 48,000 60,000 60,000 1
per unit
Customer Invoices 50 240 290 29,000 100
invoices per year
Material Number of 12 240 252 63,000 250
handling batches
Other Labour 24,000 30,000 54,000 108,000 2
overheads hours
£333,200
54,000
£333,200
[(12,000 × 2) + (12,000 × 2
1
/2)]
Total overheads
Number of labour hours
‘
M05_ATRI3622_06_SE_C05.QXD 5/29/09 4:22 PM Page 143
Criticisms of ABC
Although many businesses now adopt a system of ABC, its critics point out that ABC
can be time-consuming and costly. Set-up costs as well as costs of running and updat-
ing the ABC system must be incurred. These costs can be very high, particularly where
the business’s operations are complex and involve a large number of activities and cost
drivers. Furthermore, ABC information produced under the scenario just described
may be complex. If managers find ABC reports difficult to understand, there is a risk
that the potential benefits of ABC will be lost.
Not all businesses are likely to benefit from ABC. Where a business sells products
or services that all have similar levels of output and involve similar activities and
CHAPTER 5 COSTING AND PRICING IN A COMPETITIVE ENVIRONMENT
144
The activity-based costs are derived as follows:
(f ) (g)
Overhead Total costs Total costs Unit costs Unit costs
cost pool Standard Deluxe Standard Deluxe
(a × e) (b × e) (f/12,000) (g/12,000)
££££
Set-up 1,200 72,000 0.10 6.00
Special part 12,000 48,000 1.00 4.00
Customer invoices 5,000 24,000 0.42 2.00
Material handling 3,000 60,000 0.25 5.00
Other overheads 48,000 60,000 4.00 5.00
Total overheads 5.77 22.00
The total cost per unit is calculated as follows:
Standard Deluxe
£ per unit £ per unit
Direct cost:
Labour 16.00 20.00
Material 22.00 32.00
Indirect cost
See above 5.77 22.00
Total cost per unit 43.77 74.00
The return on sales is calculated as follows:
Standard Deluxe
£ per unit £ per unit
Selling price 65.00 87.00
Total cost (see above) 43.77 74.00
Profit 21.23 13.00
Return on sales [(profit/sales) × 100%] 32.67% 14.94%
The figures show that under the traditional approach the returns on sales appear
broadly equal. However, the ABC approach shows that the Standard product is far
more profitable. Hence, the business should reconsider its policy of trying to per-
suade customers to switch to the Deluxe product.
Example 5.3 continued
M05_ATRI3622_06_SE_C05.QXD 5/29/09 4:22 PM Page 144
processes, it is unlikely that the finer measurements provided by ABC will lead to strik-
ingly different results from those gained under the traditional approach. As a result,
opportunities for better pricing, planning and cost control may not be great and may
not justify the cost of switching to an ABC system.
Measurement and tracing problems can arise with ABC, which may undermine any
potential benefits. Not all costs can be easily identified with a particular activity and
some may have to be allocated to cost pools. This can often be done on some sensible
basis. For example, factory rent may be allocated on the basis of square metres of space
used. In some cases, however, a lack of data concerning a particular cost may lead to
fairly arbitrary cost allocations between activities. There is also the problem that the
relationship between activity costs and their cost drivers may be difficult to determine.
Identifying a cause-and-effect relationship can be difficult where a large proportion of
activity costs are fixed and so do not vary with changes in usage.
ABC is also criticised for the same reason that full costing generally is criticised:
because it does not provide very relevant information for decision making. The point
was made in Chapter 4 that full costing tends to use past costs and to ignore opportun-
ity costs. Since past costs are always irrelevant in decision making and opportunity
costs can be significant, full costing information is an expensive irrelevance. In con-
trast, advocates of full costing claim that it is relevant, in that it provides a long-run
average cost, whereas ‘relevant costing’, which we considered in Chapter 2, relates only
to the specific circumstances of the short term. The use of ABC, rather than the tradi-
tional approach to job (or product) costing, does not affect the validity of this irrelev-
ance argument.
Real World 5.2 shows how ABC came to be used at the Royal Mail.
Real World 5.3 provides some indication of the extent to which ABC is used in
practice.
ACTIVITY-BASED COSTING
145
REAL WORLD 5.2
Delivering ABC
Early in the 2000s the publicly-owned Royal Mail adopted ABC and used it to find the cost
of making postal deliveries. Royal Mail identified 340 activities that gave rise to costs,
created a cost pool and identified a cost driver for each of these.
Roger Tabour, Royal Mail’s Enterprise Systems Programme Director, explained, ‘A new
regulatory and competitive environment, plus a down-turned economy, led management
to seek out more reliable sources of information on performance and profitability,’ and this
led to the introduction of ABC.
The Royal Mail is a public sector organisation that is subject to supervision by
Postcomm, the UK government appointed regulatory body. The government requires the
Royal Mail to operate on a commercial basis and to make profits.
Source: www.sas.com.
M05_ATRI3622_06_SE_C05.QXD 5/29/09 4:22 PM Page 145
CHAPTER 5 COSTING AND PRICING IN A COMPETITIVE ENVIRONMENT
146
REAL WORLD 5.3
ABC in practice
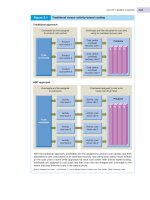
A recent survey of 176 UK businesses operating in various industries, all with an annual
turnover of more than £50 million, was conducted by Al-Omiri and Drury. This indicated
that 29 per cent of larger UK businesses use ABC.
The adoption of ABC in the UK varies widely between industries, as is shown in Figure 5.2.
Al-Omiri and Drury took their analysis a step further by looking at the factors that appar-
ently tend to lead a particular business to adopt ABC. They found that businesses that
used ABC tended to be:
l Large
l Sophisticated, in terms of using advanced management accounting techniques
generally
l In an intensely competitive market for their products
l Operating in a service industry, particularly in the financial services.
All of these findings are broadly in line with other recent research evidence involving busi-
nesses from around the world.
Source: Al-Omiri, M. and Drury, C., ‘A survey of factors influencing the choice of product costing systems in UK organisations’,
Management Accounting Research, December 2007.
ABC in practice
Figure 5.2
M05_ATRI3622_06_SE_C05.QXD 5/29/09 4:22 PM Page 146
ACTIVITY-BASED COSTING
147
Psilis Ltd makes a product in two qualities, called ‘Basic’ and ‘Super’. The business is able
to sell these products at a price that gives a standard profit mark-up of 25 per cent of full
cost. Management is concerned by the lack of profit.
Full cost for one unit of a product is calculated by charging overheads to each type of
product on the basis of direct labour hours. The costs are as follows:
Basic Super
££
Direct labour (all £10/hour) 40 60
Direct material 15 20
The total overheads are £1,000,000.
Based on experience over recent years, in the forthcoming year the business expects
to make and sell 40,000 Basics and 10,000 Supers.
Recently, the business’s management accountant has undertaken an exercise to try
to identify activities and cost drivers in an attempt to be able to deal with the overheads
on a more precise basis than had been possible before. This exercise has revealed the
following analysis of the annual overheads:
Activity (and cost driver) Cost Annual number of activities
£000
Total Basic Super
Number of machine set-ups 280 100 20 80
Number of quality-control inspections 220 2,000 500 1,500
Number of sales orders processed 240 5,000 1,500 3,500
General production (machine hours) 260 500,000 350,000 150,000
Total 1,000
The management accountant explained the analysis of the £1,000,000 overheads as follows:
l The two products are made in relatively small batches, so that the amount of the
finished product held in inventories is negligible. The Supers are made in very small
batches because demand for them is relatively low. Each time a new batch is produced,
the machines have to be reset by skilled staff. Resetting for Basic production occurs
about 20 times a year and for Supers about 80 times: about 100 times in total. The cost
of employing the machine-setting staff is about £280,000 a year. It is clear that the more
set-ups that occur, the higher the total set-up costs; in other words, the number of set-
ups is the factor that drives set-up costs.
l All production has to be inspected for quality and this costs about £220,000 a year. The
higher specifications of the Supers mean that there is more chance that there will be
quality problems. Thus the Supers are inspected in total 1,500 times annually, whereas
the Basics only need about 500 inspections. The number of inspections is the factor
that drives these costs.
l Sales order processing (dealing with customers’ orders, from receiving the original
order to despatching the products) costs about £240,000 a year. Despite the larger
amount of Basic production, there are only 1,500 sales orders each year because the
Basics are sold to wholesalers in relatively large-sized orders. The Supers are sold
mainly direct to the public by mail order, usually in very small-sized orders. It is believed
that the number of orders drives the costs of processing orders.
Self-assessment question 5.1
‘
M05_ATRI3622_06_SE_C05.QXD 5/29/09 4:22 PM Page 147
The increasingly competitive environment in which modern businesses operate is lead-
ing to greater effort being applied in trying to manage costs. Businesses need to keep
costs to a minimum so that they can supply goods and services at a price that cus-
tomers will be prepared to pay and, at the same time, generate a level of profit neces-
sary to meet the businesses’ objectives of enhancing shareholder wealth. We have just
seen how ABC can help manage costs. We shall now go on to outline some other tech-
niques that have recently emerged in an attempt to meet these goals of competitive-
ness and profitability. These can be used in conjunction with ABC.
Total (or whole) life-cycle costing
This method of costing starts from the premise that the total (or whole) life cycle of a
product or service has three phases. These are:
1 The pre-production phase. This is the period that precedes production of the product or
service for sale. During this phase, research and development – both of the product
or service and of the market – is conducted. The product or service is invented/
designed and so is the means of production. The phase culminates with acquiring
and setting up the necessary production facilities and with advertising and promotion.
2 The production phase comes next, being the one in which the product is made and
sold or the service is rendered to customers.
3 The post-production phase comes last. During this phase, any costs necessary to cor-
rect faults that arose with products or services that have been sold (after-sales ser-
vice) are incurred. There would also be the costs of closing production at the end of
the product’s or service’s life cycle, such as the cost of decommissioning production
facilities. Since after-sales service will tend to arise from as early as the first product
or service being sold and probably, therefore, well before the last one is sold, this
phase would typically overlap with the manufacturing/service-rendering phase.
Businesses often seem to consider environmental costs alongside the more obvious
financial costs involved in the life of a product.
The total life cycle is shown in Figure 5.3.
Other approaches to cost management in the
modern environment
CHAPTER 5 COSTING AND PRICING IN A COMPETITIVE ENVIRONMENT
148
Required:
(a) Deduce the full cost of each of the two products on the basis used at present and,
from these, deduce the current selling price.
(b) Deduce the full cost of each product on an ABC basis, taking account of the man-
agement accountant’s recent investigations.
(c) What conclusions do you draw? What advice would you offer the management of the
business?
The answer to this question can be found in Appendix B at the back of the book.
Self-assessment question 5.1 continued
M05_ATRI3622_06_SE_C05.QXD 5/29/09 4:22 PM Page 148
In some types of business, particularly those engaged in an advanced manufacturing
environment, it is estimated that a very high proportion (as much as 80 per cent) of
the total costs that will be incurred over the total life of a particular product are either
incurred or committed at the pre-production phase. For example, a car manufacturer,
when designing, developing and setting up production of a new model, incurs a high
proportion of the total costs that will be incurred on that model during the whole of
its life. Not only are pre-production costs specifically incurred during this phase, but
the need to incur particular costs during the production phase is also established.
This is because the design will incorporate features that will lead to particular manu-
facturing costs. Once the design of the car has been finalised and the manufacturing
plant set up, it may be too late to ‘design out’ a costly feature without incurring
another large cost.
OTHER APPROACHES TO COST MANAGEMENT IN THE MODERN ENVIRONMENT
149
The total life cycle of a product or service
Figure 5.3
From the producer’s viewpoint, the life of a product can be seen as having three distinct
phases. During the first the product is developed and everything is prepared so that produc-
tion and marketing can start. Next comes production and sales. Lastly, dealing with post-
production activities is undertaken.
A decision taken at the design stage could well commit the business to costs after the
manufacture of the product has taken place. Can you suggest a potential cost that
could be built in at the design stage that will show itself after the manufacture of the
product?
After-sales service costs could be incurred as a result of some design fault. Once the manu-
facturing facilities have been established, it may not be economic to revise the design; it
may be better to deal with the problem through after-sales service procedures.
Activity 5.3
M05_ATRI3622_06_SE_C05.QXD 5/29/09 4:22 PM Page 149
Total life-cycle costing seeks to focus management’s attention on the fact that it is
not just during the production phase that attention needs to be paid to cost manage-
ment. By the start of the production phase it may be too late to try to manage a large
element of the product’s or service’s total life-cycle cost. Efforts need to be made to
assess the costs of alternative designs.
There needs to be a review of the product or service over its entire life cycle, which
could be a period of 20 or more years. Traditional management accounting, however,
tends to be concerned with assessing performance over periods of just one year or less.
Real World 5.4 provides some idea of the extent to which total life-cycle costing is
used in practice.
Real World 5.5 shows how a well-known international carmaker uses total life-cycle
costing.
CHAPTER 5 COSTING AND PRICING IN A COMPETITIVE ENVIRONMENT
150
‘
REAL WORLD 5.4
Total (whole) life-cycle costing in practice
A survey of management accounting practice in the US was conducted in 2003. Nearly
2,000 businesses replied to the survey. These tended to be larger businesses, of which
about 40 per cent were manufacturers and about 16 per cent financial services; the
remainder were across a range of other industries.
The survey revealed that 22 per cent extensively use a total life-cycle approach to cost
control, with a further 37 per cent considering using the technique in the future.
Though the survey relates to the US, in the absence of UK evidence it provides some
insight to what is likely also to be practised in the UK and elsewhere in the developed
world.
Source: 2003 Survey of Management Accounting, Ernst and Young, 2003.
REAL WORLD 5.5
Total life-cycle costing at Renault
According to Renault, the French motor vehicle manufacturer:
The life of a vehicle is long and comprises several phases:
design: Creating a vehicle
manufacturing: Extracting and producing materials, manufacturing and assembling the com-
ponents, and then the whole vehicle
distribution: Transition between the vehicle’s departure from the production plant and its pur-
chase by a customer
vehicle service life: The use by the motorist, the longest phase
recycling.
These phases make up the life cycle. Why the word ‘cycle’? Because the end of a vehicle’s
service life is factored in right from the design phase.
Source: www.renault.com.
M05_ATRI3622_06_SE_C05.QXD 5/29/09 4:22 PM Page 150
Note that Renault divides the production phase into two sections: manufacturing and
distribution. It also divides the post-production phase into vehicle service life and recycling.
Target costing
With traditional cost-plus pricing, costs are totalled for a product or service and a per-
centage is added for profit to arrive at a selling price. This is not a very practical basis
on which to price output for many businesses – certainly not those operating in a price-
competitive market. The cost-plus price may well be totally unacceptable to the mar-
ket. (We shall take another look at this later in this chapter.)
Target costing approaches the problem from the other direction. First, with the help
of market research or other means, a unit selling price and sales volume are established.
From the unit selling price is taken an amount for profit. This unit profit figure must
be such as to be acceptable to meet the business’s profit objective. The resulting figure
is the target cost. The target cost may well be less than the ‘current’ cost; there may be
a ‘cost gap’. Efforts are then made to bridge this gap, that is, to provide the service or
make the product in such a way as to enable the target cost to be met. These efforts
may involve revising the design, finding more efficient means of production or requir-
ing suppliers of goods and services to supply more cheaply.
Target costing is seen as a part of a total life-cycle costing approach, in that cost sav-
ings are sought at a very early stage in the life cycle, during the pre-production phase.
Real World 5.6 indicates the level of usage of target costing.
OTHER APPROACHES TO COST MANAGEMENT IN THE MODERN ENVIRONMENT
151
‘
This shows quite a low level of usage in the US. In contrast, survey evidence shows
that target costing is very widely used by Japanese manufacturing businesses.
REAL WORLD 5.6
On target
The Ernst and Young survey of management accounting practice in the US conducted in
2003 revealed that 27 per cent use target costing extensively, with a further 41 per cent
considering using the technique in the future.
Source: 2003 Survey of Management Accounting, Ernst and Young, 2003.
Though target costing seems effective and has its enthusiasts, some people feel it has
its problems. Can you suggest what these problems might be?
There seem to be three main problem areas:
l It can lead to various conflicts – for example, between the business, its suppliers and
its own staff.
l It can cause a great deal of stress for employees who are trying to meet target costs
that are sometimes extremely difficult to meet.
l Although, in the end, ways may be found to meet a target cost (through product or ser-
vice redesign, negotiating lower prices with suppliers, and so on), the whole process
can be very expensive.
Activity 5.4
M05_ATRI3622_06_SE_C05.QXD 5/29/09 4:22 PM Page 151
We shall discuss total life-cycle costing and target costing more in Chapter 9 when
we consider the strategic aspects of management accounting.
Costing quality control
Such is the importance that their customers place on quality that businesses are forced
to make sure that their output is of a high quality. In the competitive environment in
which most businesses operate, a failure to deliver quality will lead to customers going
to another supplier. Businesses, therefore, need to establish procedures that promote
the quality of their output, either by preventing quality problems in the first place
or by dealing with them when they occur. These procedures have a cost. It has been
estimated that these quality costs can amount to up to 30 per cent of total processing
costs. These costs tend to be incurred during the production phase of the product life
cycle. They have been seen as falling into four main categories:
1 Prevention costs. These are involved with procedures to try to prevent items being pro-
duced that are not up to the required quality. Such procedures might include staff
training on quality issues. Some types of prevention costs might be incurred during
the pre-production phase of the product life cycle, where the production process could
be designed in such a way as to avoid potential quality problems with the output.
2 Appraisal costs. These are concerned with monitoring raw materials, work in progress
and finished products to try to avoid substandard products from reaching the customer.
3 Internal failure costs. These include the costs of rectifying substandard products
before they pass to the customer and the costs of scrap arising from quality failures.
4 External failure costs. These are involved with rectifying quality problems with prod-
ucts that have passed to the customer. There is also the cost to the business of its loss
of reputation from having passed substandard products to the customer.
Figure 5.4 sets these out in diagram form.
CHAPTER 5 COSTING AND PRICING IN A COMPETITIVE ENVIRONMENT
152
‘
The elements of quality costs
Figure 5.4
Quality costs fall into four distinct categories. The first two are mainly concerned with avoiding
substandard production and the last two with dealing with it should it arise.
M05_ATRI3622_06_SE_C05.QXD 5/29/09 4:22 PM Page 152
Kaizen costing
Kaizen costing is linked to total life-cycle costing and focuses on cost saving during
the production phase. The Japanese word kaizen implies ‘continuous changes’. The
application of the kaizen costing approach involves continuous improvement, in terms
of cost saving, throughout the production phase. Since this phase is at a relatively late
stage in the life cycle (from a cost control point of view) only relatively small cost
savings can usually be made. The major production-phase cost savings should already
have been made through target costing.
With kaizen costing, efforts are made to reduce the unit manufacturing cost of the
particular product or service under review, if possible taking it below the unit cost
in the previous period. Target percentage reductions can be set. Usually, production
workers are encouraged to identify ways of reducing costs. This is something that the
‘hands on’ experience of these workers may enable them to do. Even though the scope
to reduce costs is limited at the production stage, valuable savings can still be made.
Real World 5.7 explains how a major UK manufacturer used kaizen costing to
advantage.
Benchmarking
Benchmarking is an activity – usually a continuing one – where a business, or one of
its divisions, seeks to emulate a successful business or division and so achieve a similar
level of success. The successful business or division provides a benchmark against which
the business can measure its own performance, as well as examples of approaches that
can lead to success. Sometimes the benchmark business will help with the activity, but
OTHER APPROACHES TO COST MANAGEMENT IN THE MODERN ENVIRONMENT
153
‘
‘
REAL WORLD 5.7
Kaizen costing is part of the package
Kappa Packaging is a major UK packaging business. It has a factory at Stalybridge where
it makes, among other things, packaging (cardboard cartons) for glass bottles containing
alcoholic drinks. In 2002, Kappa introduced a new approach to reducing the amount
of waste paper and cardboard. Before this the business wasted 14.6 per cent of the raw
materials it used. This figure was taken as the base against which improvements would
be measured.
Improvements were made at Kappa as a result of:
l making staff more aware of the waste problem;
l requiring staff to monitor the amount of waste for which they were individually respons-
ible; and
l establishing a kaizen team to find ways of reducing waste.
As a result of kaizen savings, Kappa was able to reduce waste from 14.6 per cent to
13.1 per cent in 2002 and 11 per cent in 2003. The business estimates that each 1 per cent
waste saving was worth £110,000 a year. So by the end of 2003, Kappa was saving about
£400,000 a year, relative to 2001: that is, over £2,000 per employee each year.
Source: Taken from ‘Accurate measurement of process waste leads to reduced costs’, www.envirowise.gov.uk, 2003.
M05_ATRI3622_06_SE_C05.QXD 5/29/09 4:22 PM Page 153
even where no co-operation is given, outside observers can still learn quite a lot about
what makes that business successful.
Businesses are under no statutory obligation to benchmark and are understandably
reluctant to divulge commercially sensitive information to competitor businesses.
They may, however, benchmark internally, with one division or department com-
paring itself with another part of the same business. They may also benchmark with
businesses with which they are not directly competing but which may have similar
functions.
Real World 5.8 provides an example of two well-known divisions of an equally well-
known parent business that are able to benchmark, one against the other.
Ford sold Jaguar and Land Rover to the Indian motor business Tata in March 2008, but
the inter-divisional benchmarking still continues, no doubt.
As we saw in Chapter 4, full costs can be used as a basis for setting prices for the busi-
ness’s output. We also saw that it can be criticised in that role. In this section we are
going to take a closer look at pricing. We shall begin by considering some theoretical
aspects of the subject before going on to look at some more practical issues, particu-
larly the role of management accounting information in pricing decisions.
Pricing
CHAPTER 5 COSTING AND PRICING IN A COMPETITIVE ENVIRONMENT
154
REAL WORLD 5.8
Tracking the Jaguar
The solid off-road qualities of Land Rover vehicles inspire devotion among many of their owners,
who include members of Britain’s royal family.
But the brand has been plagued by quality problems, setting spurious warning lights flashing
in some of its vehicles and putting it last in consultancy JD Power’s 2007 Initial Quality Study in
the US.
Land Rover is now benchmarking the quality levels of Jaguar, its sister brand, and clawing its
way back up the league tables.
‘They’re still below the average, but improving relative to the competition,’ said Brian Walters,
JD Power’s vice-president of European operations.
Lewis Booth, head of Ford Motor’s premium-brands group, told the Financial Times: ‘We want
to get Land Rover to Jaguar quality levels.’
The problems owe something to the complexity of the vehicles, packed with electronic control
units aimed at keeping them stable off road.
Land Rover, formerly owned by BMW and now up for sale by Ford, has seen a flurry of new
vehicle launches in recent years, even as it changed owners.
Source: Royal following but quality issues remain, Financial Times (Reed, J.), © The Financial Times Limited, 3 October 2007.
FT
M05_ATRI3622_06_SE_C05.QXD 5/29/09 4:22 PM Page 154
Economic theory
In most market conditions found in practice, the price charged by a business will deter-
mine the number of units sold. This is shown graphically in Figure 5.5.
Figure 5.5 shows the number of units of output that the market would demand at
various prices. As price increases, people are less willing to buy the commodity (call it
Commodity A). Note that the commodity might be a physical product or a service. At
a relatively low price per unit (P
1
), the quantity of units demanded by the market (Q
1
)
is fairly high. When the price is increased to P
2
, the demand decreases to Q
2
. The graph
shows a linear (straight-line) relationship between the price and demand. In practice,
the relationship, though broadly similar, may not be quite so straightforward.
Not all commodities show exactly the same slope of line. Figure 5.6 shows the
demand/ price relationship for Commodity B, a different commodity from the one
depicted in Figure 5.5.
Though a rise in price of Commodity B, from P
1
to P
2
, causes a fall in demand, the
fall in demand is much smaller than is the case for Commodity A with a similar rise
in price. As a result, we say that Commodity A has a higher elasticity of demand than
Commodity B. Demand for A reacts much more dramatically to price changes (stretches
more) than does demand for B. Elastic demand tends to be associated with commod-
ities that are not essential, perhaps because there is a ready substitute.
It is very helpful for those involved with pricing decisions to have some feel for
the elasticity of demand of the commodity that will be the subject of a decision. The
sensitivity of the demand to the pricing decision is obviously much greater (and the
pricing decision more crucial) with commodities whose demand is elastic than with
commodities whose demand is relatively inelastic.
PRICING
155
‘
Graph of quantity demanded against price for Commodity A
Figure 5.5
As the price of the commodity under consideration increases from P
1
to P
2
, the quantity that the
market will buy falls from Q
1
to Q
2
.
M05_ATRI3622_06_SE_C05.QXD 5/29/09 4:22 PM Page 155
Real World 5.9 is an extract from a Financial Times article that suggests that patterns
of elasticity of demand can be modified by an economic recession in the US.
CHAPTER 5 COSTING AND PRICING IN A COMPETITIVE ENVIRONMENT
156
Graph of quantity demanded against price for Commodity B
Figure 5.6
As the price of the commodity increases from P
1
to P
2
, the quantity that the market will buy falls
from Q
1
to Q
2
. This fall in demand is less than was the case for Commodity A, which has the
greater elasticity of demand.
Which would have the more elastic demand – a particular brand of chocolate bar,
or Mains electricity supply?
A branded chocolate bar seems likely to have a fairly elastic demand. This is for several
reasons, including the following:
l Few buyers of the bar would feel that chocolate bars are essentials.
l Other chocolate bars, probably quite similar to the one in question, will be easily available.
Mains electricity probably has a relatively inelastic demand. This is because:
l Many users of electricity would find it very difficult to manage without fuel of some
description.
l For neither household nor business users of electricity is there an immediate, practical
substitute. For some uses of electricity – for example, powering machinery – there is
probably no substitute. Even for a purpose such as heating, where there are substitutes
such as gas and oil, it may be impractical to switch to the substitute because gas and
oil heating appliances are not immediately available and are costly to acquire.
Activity 5.5
M05_ATRI3622_06_SE_C05.QXD 5/29/09 4:22 PM Page 156
As we saw in Chapter 1, the objective of most businesses is to enhance the wealth of
their owners. Broadly speaking, this will be best achieved by seeking to maximise
profits – that is, having the largest possible difference between total cost and total rev-
enue. Thus, prices should be set in a way that is likely to have this effect. To do this,
the price decision maker needs to have some insight to the way in which cost and price
relate to volume of output.
Figure 5.7 shows the relationship between cost and volume of output, which we
have already met in Chapter 3.
The figure shows that the total cost of providing a particular commodity (Service X)
increases as the quantity of output increases. It is shown here as a straight line. In practice,
it may be curved, either curving upwards (tending to become closer to the vertical) or
PRICING
157
REAL WORLD 5.9
Elasticity of demand affected by the downturn
The signs of an imminent recession are all around us. Spillover from the subprime mortgage crisis
is weakening both consumer confidence and the consumer spending – much of it on credit – that
has buoyed the US economy.
Don’t cut the market research budget. You need to know more than ever how consumers are
redefining value and responding to the recession. Price elasticity curves are changing. Consumers
take longer searching for durable goods and negotiate harder at point of sale. They are more
willing to postpone purchases, trade down or buy less. Must-have features of yesterday are
today’s can-live-withouts. Trusted brands are especially valued and can still launch products suc-
cessfully, but interest in new brands and categories fades. Conspicuous consumption becomes
less prevalent.
Source: Quelch, J. ‘Family comes first when marketing faces tougher times’, Financial Times, 18 February 2008.
FT
Graph of total cost against quantity (volume) of output of
Service X
Figure 5.7
Providing Service X will give rise to some costs that are fixed and to some that vary with the
level of output.
M05_ATRI3622_06_SE_C05.QXD 5/29/09 4:22 PM Page 157
flattening out (tending to become closer to the horizontal). The figure assumes that the
marginal cost of each unit is constant over the range shown.
Figure 5.8 shows the total sales revenue against quantity of Service X sold. The total
sales revenue increases as the quantity of output increases, but often at a decreasing rate.
CHAPTER 5 COSTING AND PRICING IN A COMPETITIVE ENVIRONMENT
158
What general effect would tend to cause the total cost line in Figure 5.7 to (a) curve
towards the vertical, and (b) curve towards the horizontal? (You may recall that we con-
sidered this issue in Chapter 3.)
(a) Curving towards the vertical would mean that the marginal cost (additional cost of
making one more) of each successive unit of output would become greater. This
would probably imply that increased activity would be causing a shortage of supply of
some factor of production, which has the effect of increasing cost prices. This might
be caused by a shortage of labour, meaning that overtime payments would need to
be made to encourage people to work the hours necessary for increased production.
It might also/alternatively be caused by a shortage of raw materials. Perhaps normal
supplies were exhausted at lower levels of output and more expensive sources had to
be used to expand output.
(b) Curving towards the horizontal might be caused by the business being able to exploit
the economies of scale at higher levels of output, making the marginal cost of each
successive unit of output cheaper. Perhaps higher volumes of output enable division
of labour or more mechanisation. Possibly, suppliers of raw materials offer better
deals for larger orders.
Activity 5.6
Graph of total sales revenue against quantity (volume) sold of
Service X
Figure 5.8
As more units of Service X are sold, the total sales revenue initially increases, but at a declining
rate. This is because, to persuade people to buy increasing quantities, the price must be
reduced. Eventually the price will have to be reduced so much, to encourage additional sales,
that the total sales revenue will fall as the number of units sold increases.
M05_ATRI3622_06_SE_C05.QXD 5/29/09 4:22 PM Page 158
Figure 5.8 implies that there will come a point where, to make increased sales, prices
will have to be reduced so much that total sales revenue will not increase by much for
each additional sale.
In Chapter 3, when we considered break-even analysis, we assumed a steady price
per unit over the range that we were considering. Now we are saying that, in practice,
it does not work like this. How can these two positions be reconciled? The answer is
that, when using break-even analysis, we are normally considering only a relatively
small range of output, namely the relevant range (see p. 74). It may well be that over
a small range, particularly at low levels of output, a constant sales price per unit is a
reasonable assumption. That is to say that, to the left of the curve in Figure 5.8, there
may be a straight line from zero up to the start of the curve.
There is nothing in break-even analysis that demands that the assumption about
steady selling prices is made, but making it does mean that the analysis becomes very
straightforward.
Figure 5.9 combines information about total sales revenue and total cost for Service
X over a range of output levels.
PRICING
159
What assumption does Figure 5.8 make about the price for a unit of Service X at which
output can be sold as the number of units sold increases?
The graph suggests that, to sell more units, the price must be lowered, meaning that the
average price for each unit of output reduces as volume sold increases. As we discussed
earlier in this section, this is true of most markets found in practice.
Activity 5.7
Graph of total sales revenue and total cost against quantity
(volume) of output of Service X
Figure 5.9
Profit is the vertical distance between the total cost and total sales revenue lines. For a wealth-
maximising business, the optimum level of sales will occur when this is at a maximum.
M05_ATRI3622_06_SE_C05.QXD 5/29/09 4:22 PM Page 159
The total sales revenue increases, but at a decreasing rate, and the total cost of pro-
duction increases as the quantity of output increases. The maximum profit is made
where the total sales revenue and total cost lines are vertically furthest apart. At the
left-hand end of the graph, we are clearly above break-even point because the total
sales revenue line has already gone above the total cost line. At the lower levels of vol-
ume of sales and output, the total sales revenue line is climbing faster than the total
cost line. The business will wish to keep expanding output as long as this continues to
be the case, because profit is the vertical distance between the two lines. A point will
be reached where the total sales revenue line will become only as steep as the total cost
line. After this it will become less steep; expanding further will reduce overall profit,
because in this area of the graph the marginal cost is greater than the marginal revenue.
The point at which profit is maximised is where the two lines stop diverging, that
is, the point at which the two lines are climbing at exactly the same rate. Thus we can
say that profit is maximised at the point where
that is,
To see how this approach can be applied, consider Example 5.4.
GIncrease in total salesJGIncrease in total costsJ
HKHK
H
revenue from selling
K
=
H
that will result from
K
I one more unit LIselling one more unitL
Marginal sales revenue = Marginal cost of production
CHAPTER 5 COSTING AND PRICING IN A COMPETITIVE ENVIRONMENT
160
A schedule of predicted total sales revenue and total costs at various levels of pro-
vision for Service Y is shown in columns (a) and (c) of the table.
Quantity Total sales Marginal Total Marginal Profit
of revenue sales cost cost (loss)
output revenue
(units) £ £ £ £ £
(a) (b) (c) (d) (e)
00 0 0
1 1,000 1,000 2,300 2,300 (1,300)
2 1,900 900 2,600 300 (700)
3 2,700 800 2,900 300 (200)
4 3,400 700 3,200 300 200
5 4,000 600 3,500 300 500
6 4,500 500 3,800 300 700
7 4,900 400 4,100 300 800
8 5,200 300 4,400 300 800
9 5,400 200 4,700 300 700
10 5,500 100 5,000 300 500
Example 5.4
M05_ATRI3622_06_SE_C05.QXD 5/29/09 4:22 PM Page 160
Figure 5.10 shows the total cost and total revenue for Service Y in Example 5.4.
PRICING
161
Column (b) is deduced by taking the total sales revenue for one less unit sold from
the total sales revenue at the sales level under consideration (column (a)). For
example, the marginal sales revenue of the fifth unit of the service sold (£600) is
deduced by taking the total sales revenue for four units sold (£3,400) away from
the total sales revenue for five units sold (£4,000).
Column (d) is deduced similarly, but using total cost figures from column (c).
Column (e) is found by deducting column (c) from column (a).
It can be seen by looking at the profit (loss) column that the maximum profit
(£800) occurs with an output of seven or eight units. Thus the maximum output
should be eight units of the service. This is the point where marginal cost and
marginal revenue are equal (at £300).
Total cost and total revenue for Service Y
Figure 5.10
The profit (or loss) at any particular level of activity (sales of the service) is the difference
between the total sales revenue and the total cost. On the graph, the vertical distance between
the two curves gives this. Note that the highest profit occurs where the marginal cost equals
the marginal sales revenue, that is where the two curves run parallel to one another.
Specialist Ltd makes a very specialised machine that is sold to manufacturing busi-
nesses. The business is about to commence production of a new model of machine
for which facilities exist to produce a maximum of 10 machines each week. To assist
management in a decision on the price to charge for the new machine, two pieces of
information have been collected:
Activity 5.8
‘
M05_ATRI3622_06_SE_C05.QXD 5/29/09 4:22 PM Page 161
Some practical considerations
Despite the analysis in Activity 5.8, in practice the answer of five machines a week may
prove not to be the best answer. This might be for one or more of several reasons:
l Demand is notoriously difficult to predict, even assuming no changes in the
environment.
CHAPTER 5 COSTING AND PRICING IN A COMPETITIVE ENVIRONMENT
162
l Market demand. The business’s marketing staff believe that, at a price of £3,000 a
machine, the demand would be zero. Each £100 reduction in unit price below £3,000
would generate one additional sale a week. Thus, for example, at a price of £2,800
each, two machines could be sold each week.
l Manufacturing costs. Fixed costs associated with manufacture of the machine are
estimated at £3,000 a week. Since the work is highly labour-intensive and labour is
in short supply, unit variable costs are expected to be progressive. The manufacture
of one machine each week is expected to have a variable cost of £1,100, but each
additional machine produced will increase the variable cost for the entire output by
£100 a machine. For example, if the output were three machines a week, the variable
cost for each machine (for all three machines) would be £1,300.
It is the policy of the business always to charge the same price for its entire output of
a particular model. What is the most profitable level of output of the new machine?
Output Unit Total Marginal Unit Total Total Marginal Profit/
(number of sales sales sales variable variable cost cost (loss)
machines) revenue revenue revenue cost cost
££££££££
0 0 0 0 0 0 3,000 3,000 (3,000)
1 2,900 2,900 2,900 1,100 1,100 4,100 1,100 (1,200)
2 2,800 5,600 2,700 1,200 2,400 5,400 1,300 200
3 2,700 8,100 2,500 1,300 3,900 6,900 1,500 1,200
4 2,600 10,400 2,300 1,400 5,600 8,600 1,700 1,800
5 2,500 12,500 2,100 1,500 7,500 10,500 1,900 2,000
6 2,400 14,400 1,900 1,600 9,600 12,600 2,100 1,800
7 2,300 16,100 1,700 1,700 11,900 14,900 2,300 1,200
8 2,200 17,600 1,500 1,800 14,400 17,400 2,500 200
9 2,100 18,900 1,300 1,900 17,100 20,100 2,700 (1,200)
10 2,000 20,000 1,100 2,000 20,000 23,000 2,900 (3,000)
An output of five machines each week will maximise profit at £2,000 a week.
The additional cost of producing the fifth machine compared with the cost of produc-
ing the first four (£1,900) is just below the marginal revenue (the amount by which the total
revenue from five machines exceeds that from selling four (£2,100)).
The additional cost of producing the sixth machine compared with the cost of produc-
ing the first five (£2,100) is just above the marginal revenue (the amount by which the total
revenue from six machines exceeds that from selling five (£1,900)).
Activity 5.8 continued
M05_ATRI3622_06_SE_C05.QXD 5/29/09 4:22 PM Page 162
PRICING
163
‘
l The effect of sales of the new machine on the business’s other products may mean
that the machine cannot be considered in isolation. Five machines a week may be
the optimum level of output if sales were being taken from a rival business or a new
market were being created, but possibly not in other circumstances.
l Costs are difficult to estimate.
l Since labour is in short supply, the relevant labour cost should probably include an
element for opportunity cost. This is because staff may have to be taken away from
some other profitable activity to put them on to production of this new machine.
l The optimum level of sales volume is derived on the assumption that short-run
profit maximisation is the goal of the business. Unless this is consistent with wealth
enhancement in the longer term, it may not be in the business’s best interests.
These points highlight some of the weaknesses of the theoretical approaches to pric-
ing, particularly the fact that costs and demands are difficult to predict. It would be
wrong, however, to dismiss the theory. The fact that the theory does not work perfectly
in practice does not mean that it cannot offer helpful insights on the nature of mar-
kets, how profit relates to volume, and the notion of an optimum level of output.
Full cost (cost-plus) pricing
Now that we have considered pricing theory, let us return to the subject of using full
cost as the basis for setting prices. We saw in Chapter 4 that one of the reasons that
some businesses deduce full costs is to base selling prices on them. This is a perfectly
logical approach. If a business charges the full cost of its output as a selling price, the
business will, in theory, break even, because the sales revenue will exactly cover all of
the costs. Charging something above full cost will yield a profit.
If a full cost (cost-plus) pricing approach is to be used, the required profit from each
unit sold must be determined. This must logically be based on the total profit required
for the period. In practice, this required profit is often set in relation to the amount of
capital invested in the business. In other words, businesses seek to generate a target
return on capital employed. It seems, therefore, that the profit loading on full cost
should reflect the business’s target profit and that the target should itself be based on
a target return on capital employed.
A business has just completed a service job whose full cost has been calculated at
£112. For the current period, the total costs (direct and indirect) are estimated at
£250,000. The profit target for the period is £100,000.
Suggest a selling price for the job.
If the profit is to be earned by jobs in proportion to their full cost, then the profit for each
pound of full cost must be £0.40 (that is, £100,000/250,000). Thus, the target profit on the
job must be
£0.40 × 112 = £44.80
This means that the target price for the job must be
£112 + £44.80 = £156.80
Activity 5.9
M05_ATRI3622_06_SE_C05.QXD 5/29/09 4:22 PM Page 163
Other ways could be found for apportioning a share of profit to jobs – for example,
direct labour or machine hours. Such bases may be preferred where it is believed that
these factors are better representatives of effort and, therefore, profitworthiness. It is
clearly a matter of judgement as to how profit is apportioned to units of output.
Price makers and price takers
An obvious problem with cost-plus pricing is that the market may not agree with the
price. Put another way, cost-plus pricing takes no account of the market demand func-
tion (the relationship between price and quantity demanded, which we considered
above). A business may fairly deduce the full cost of some product and then add what
might be regarded as a reasonable level of profit, only to find that a rival producer is
offering a similar product for a much lower price, or that the market simply will not
buy at the cost-plus price.
Most suppliers are not strong enough in the market to dictate pricing. Most are
‘price takers’, not ‘price makers’. They must accept the price offered by the market or
they do not sell any of their products. Cost-plus pricing may be appropriate for price
makers, but it has less relevance for price takers.
Real World 5.10 illustrates how adopting a cost-plus approach to pricing may lead
to a situation where falling demand leads to price rises, which, in turn, lead to falling
demand.
Use of cost-plus information by price takers
The cost-plus price is not entirely without use to price takers. When contemplating
entering a market, knowing the cost-plus price will give useful information. It will tell
the price taker whether it can profitably enter the market or not. As mentioned earlier,
the full cost can be seen as a long-run break-even selling price. If entering a market
means that this break-even price, plus an acceptable profit, cannot be achieved, then
the business might be better to stay out. Having a breakdown of the full cost may put
the business in a position to examine where costs might be capable of being cut in
order to bring the full cost plus profit within a figure acceptable to the market. Here,
CHAPTER 5 COSTING AND PRICING IN A COMPETITIVE ENVIRONMENT
164
REAL WORLD 5.10
A vicious circle in the library
Librarians have long complained about the price rises of academic journals and Derek
Haan, chairman and chief executive of Elsevier Science, which publishes more than 1,600
journals, admits that journal price inflation has been a problem for the industry. He says
the problem is due to falling subscription numbers as more readers make photocopies
or use interlibrary lending. With fewer subscribers to share the cost of each publication,
publishers have to increase prices. To stay within budgets, libraries start cancelling
titles, which creates a vicious circle of dwindling subscriber numbers, soaring prices and
reduced collections. Naturally, with fixed budgets, there is significant price elasticity of
demand as far as the libraries are concerned.
Source: Adapted from ‘Case study: Elsevier’, ft.com, © The Financial Times Limited, 19 June 2002.
FT
M05_ATRI3622_06_SE_C05.QXD 5/29/09 4:22 PM Page 164
the market would be providing the target price to which a target costing approach
would be applied.
It is not necessary for a business to dominate a particular market for it to be a price
maker. Many small businesses are, to some extent, price makers. This tends to be
where buyers find it difficult to make clear distinctions between the prices offered by
various suppliers. An example of this might be a car repair. Where the nature and/or
extent of the problem is not clear. As a result, garages normally charge cost-plus prices
for car repairs.
In its ‘pure’ sense, cost-plus pricing implies that the seller sets the price which is then
accepted by the customer. Often the price will not be finalised until after the product
or service has been completed, as, for example, with a car repair or with work done by
a firm of accountants. Sometimes, however, cost-plus is used as a basis of negotiating
a price in advance, which then becomes the fixed price. This is often the case with con-
tracts with central or local government departments. Typically, with such public con-
tracts, the price is determined by competitive tendering. Here each potential supplier
offers a price for which it will perform the subject of the contract, and the department
concerned selects the supplier offering the lowest price, subject to quality safeguards.
In some cases, however, particularly where only one supplier is capable of doing the
work, a fixed cost-plus approach is used.
Cost-plus is also often the approach taken when monopoly suppliers of public util-
ity services are negotiating a price which they are legally allowed to charge their cus-
tomers with the government-appointed regulator. For example, the UK mains water
suppliers, when agreeing the prices that they can charge customers, argue their case
with Ofwat, the water industry regulator, on the basis of cost-plus information.
Real World 5.11 discusses how one business sees itself as partly protected from the
recession that hit the UK from 2008 as a result of having contracts with its customers
on a cost-plus price basis.
PRICING
165
Real World 5.12 considers the extent to which cost-plus pricing seems to be used in
practice.
REAL WORLD 5.11
Adding Spice to cost-plus pricing
Spice plc is a business that undertakes consultancy and other subcontract (outsourced)
work for various UK public utilities (water and electricity suppliers). The business started
when a group of managers bought Yorkshire Electricity’s maintenance division to run it as
a separate, independent unit.
Simon Rigby, Spice’s chief executive, was very relaxed about the prospect of an eco-
nomic recession. He said:
I would not wish a recession on anybody, but if we have a recession it is going to throw Spice into
very sharp focus. How do you think my 10-year cost-plus contracts are going to be affected by
recession? The answer is not at all.
Source: Jansson, E., ‘Flexible business models helps Spice Holdings power ahead in outsource market’, Financial Times,
12 March 2008.
FT
M05_ATRI3622_06_SE_C05.QXD 5/29/09 4:22 PM Page 165