Tools for Business Decision Management Makers_10 docx
Bạn đang xem bản rút gọn của tài liệu. Xem và tải ngay bản đầy đủ của tài liệu tại đây (962.19 KB, 33 trang )
The above story makes the point that, if one concentrates only on a few areas of per-
formance, other important areas may be ignored. Too narrow a focus can adversely
affect behaviour and distort performance. This may, in turn, mean that the busi-
ness fails to meet its strategic objectives. Perhaps we should bear in mind another
apocryphal story concerning a factory in Russia which, under the former communist
regime, produced nails. The factory had its output measured according only to the
weight of nails manufactured. For one financial period, it achieved its output target by
producing one very large nail!
Scorecard problems
Not all attempts to embed the balanced scorecard approach within a business are suc-
cessful. Why do things go wrong? It has been suggested that often too many measures
are employed, thereby making the scorecard too complex and unwieldy. It has also
been suggested that managers are confronted with trade-off decisions between the four
different dimensions, and struggle because they lack a clear compass. Imagine a man-
ager who has a limited budget and therefore has to decide whether to invest in staff
training or product innovation. If both add value to the business, which choice will be
optimal for the business?
Whilst such problems exist, David Norton believes that there are two main reasons
why the balanced scorecard fails to take root within a business, as Real World 9.9 explains.
MEASURING SHAREHOLDER VALUE
339
Traditional measures of financial performance have been subject to much criticism in
recent years and new measures have been advocated to guide and to assess strategic
management decisions. In this section we shall consider two new measures, both of
which are based on the idea of increasing shareholder value. Before examining each
Measuring shareholder value
REAL WORLD 9.9
When misuse leads to failure
There are two main reasons why companies go wrong with the widely used balanced scorecard,
according to David Norton, the consultant who created the concept with Robert Kaplan, a Harvard
Business School Professor.
‘The number one cause of failure is that you don’t have leadership at the executive levels of the
organisation,’ says Mr Norton. ‘They don’t embrace it and use it for managing their strategy.’
The second is that some companies treat it purely as a measurement tool, a problem he admits
stems partly from its name. The concept has evolved since its inception, he says. The latest
Kaplan–Norton thinking is that companies need a unit at corporate level – they call it an ‘office of
strategy management’ – dedicated to ensuring that strategy is communicated to every employee
and translated into plans, targets and incentives in each business unit and department.
Incentives are crucial, Mr Norton believes. Managers who have achieved breakthroughs in per-
formance with the scorecard say they would tie it to executive compensation sooner if they were
doing it again. ‘There’s so much change in organisations that managers don’t always believe you
mean what you say. The balanced scorecard may just be “flavour of the month”. Tying it to com-
pensation shows that you mean it.’
Source: When misuse leads to failure, ft.com, © The Financial Times Limited, 24 May 2006.
FT
M09_ATRI3622_06_SE_C09.QXD 5/29/09 3:32 PM Page 339
method, we shall first consider why increasing shareholder value is regarded as the ulti-
mate financial objective of a business.
The quest for shareholder value
For some years, shareholder value has been a ‘hot’ issue among managers. Many lead-
ing businesses now claim that the quest for shareholder value is the driving force
behind their strategic and operational decisions. As a starting point, we shall consider
what is meant by the term ‘shareholder value’, and in the sections that follow we shall
look at two of the main approaches to measuring shareholder value.
In simple terms, ‘shareholder value’ is about putting the needs of shareholders at the
heart of management decisions. It is argued that shareholders invest in a business with
a view to maximising their financial returns in relation to the risks that they are pre-
pared to take. As managers are appointed by the shareholders to act on their behalf,
management decisions and actions should therefore reflect a concern for maximising
shareholder returns. Though the business may have other ‘stakeholder’ groups, such as
employees, customers and suppliers, it is the shareholders that should be seen as the
most important group.
This, of course, is not a new idea. As we discussed in Chapter 1, maximising share-
holder wealth is assumed to be the key objective of a business. However, not everyone
accepts this idea. Some believe that a balance must be struck between the competing
claims of the various stakeholders. A debate concerning the merits of each viewpoint
is beyond the scope of this book; however, it is worth pointing out that, in recent years,
the business environment has radically changed.
In the past, shareholders have been accused of being too passive and of accepting
too readily the profits and dividends that managers have delivered. However, this has
changed. Shareholders are now much more assertive, and, as owners of the business,
are in a position to insist that their needs are given priority. Since the 1980s we have
witnessed the deregulation and globalisation of business, as well as enormous changes
in technology. The effect has been to create a much more competitive world. This has
meant not only competition for products and services but also competition for funds.
Businesses must now compete more strongly for shareholder funds and so must offer
competitive rates of return.
Thus, self-interest may be the most powerful reason for managers to commit them-
selves to maximising shareholder returns. If they do not do this, there is a real risk that
shareholders will either replace them with managers who will, or allow the business to
be taken over by another business that has managers who are dedicated to maximising
shareholder returns.
How can shareholder value be created?
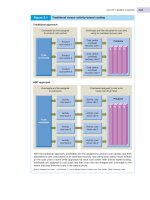
Creating shareholder value involves a four-stage process. The first stage is to set objec-
tives for the business that recognise the central importance of maximising shareholder
returns. This will set a clear direction for the business. The second stage is to establish
an appropriate means of measuring the returns, or value, that have been generated
for shareholders. For reasons that we shall discuss later, the traditional methods of
measuring returns to shareholders are inadequate for this purpose. The third stage is
to manage the business in such a manner as to ensure that shareholder returns are
maximised. This means setting demanding targets and then achieving them through
CHAPTER 9 STRATEGIC MANAGEMENT ACCOUNTING
340
M09_ATRI3622_06_SE_C09.QXD 5/29/09 3:32 PM Page 340
the best possible use of resources, the use of incentive systems and the embedding of a
shareholder value culture throughout the business. The final stage is to measure the
shareholder returns over a period of time to see whether the objectives have actually
been achieved.
Figure 9.8 shows the shareholder value creation process.
The need for new measures
Given a commitment to maximise shareholder returns, we must select an appropriate
measure that will help us assess the returns to shareholders over time. It is argued that
the traditional methods for measuring shareholder returns are seriously flawed and so
should not be used for this purpose.
MEASURING SHAREHOLDER VALUE
341
The four-stage process for creating shareholder value
Figure 9.8
What are the traditional methods of measuring shareholder returns?
The traditional approach is to use accounting profit or some ratio that is based on
accounting profit, such as return on shareholders’ funds or earnings per share.
Activity 9.6
M09_ATRI3622_06_SE_C09.QXD 5/29/09 3:32 PM Page 341
There are broadly four problems with using accounting profit, or a ratio based on
profit, to assess shareholder returns. These are:
l Profit is measured over a relatively short period of time (usually one year). However,
when we talk about maximising shareholder returns, we are concerned with max-
imising returns over the long term. It has been suggested that using profit as the key
measure will run the risk that managers will take decisions that improve perform-
ance in the short term, but which may have an adverse effect on long-term per-
formance. For example, profits may be increased in the short term by cutting back
on staff training and research expenditure. However, this type of expenditure may
be vital to long-term survival.
l Risk is ignored. A fundamental business reality is that there is a clear relationship
between the level of returns achieved and the level of risk that must be taken
to achieve those returns. The higher the level of returns required, the higher
the level of risk that must be taken. A management strategy that produces an
increase in profits can reduce shareholder value if the increase in profits achieved
is not commensurate with the increase in the level of risk. Thus, profit alone is not
enough.
l Accounting profit does not take account of all of the costs of the capital invested by the busi-
ness. The conventional approach to measuring profit will deduct the cost of bor-
rowing (that is, interest charges) in arriving at profit for the period, but there is no
similar deduction for the cost of shareholder funds. Critics of the conventional
approach point out that a business will not make a profit, in an economic sense,
unless it covers the cost of all capital invested, including shareholder funds. Unless
the business achieves this, it will operate at a loss and so shareholder value will
be reduced.
l Accounting profit reported by a business can vary according to the particular accounting
policies that have been adopted. The way that accounting profit is measured can vary
from one business to another. Some businesses adopt a very conservative approach,
which would be reflected in particular accounting policies such as immediately
treating some intangible assets (for example, research and development and good-
will) as expenses (‘writing them off’) rather than retaining them on the statement
of financial position as assets. Similarly, the use of the reducing-balance method of
depreciation (which means high depreciation charges in the early years) reduces profit
in those early years.
Businesses that adopt less conservative accounting policies would report higher
profits in the early years of owning depreciating assets. Writing off intangible assets
over a long time period (or, perhaps, not writing off intangible assets at all), the use of
the straight-line method of depreciation and so on will have this effect. In addition,
there may be some businesses that adopt particular accounting policies or carry out
particular transactions in a way that paints a picture of financial health that is in line
with what those who prepared the financial statements would like shareholders and
other users to see, rather than what is a true and fair view of financial performance
and position. This practice is referred to as ‘creative accounting’ and has been a major
problem for accounting rule makers and for society generally.
Real World 9.10 provides some examples of creative accounting methods that have
recently been found in practice.
CHAPTER 9 STRATEGIC MANAGEMENT ACCOUNTING
342
M09_ATRI3622_06_SE_C09.QXD 5/29/09 3:32 PM Page 342
Net present value (NPV) analysis
To summarise the points made above, we can say that, to enable us to assess changes
in shareholder value fairly, we need a measure that will consider the long term, take
account of risk, acknowledge the cost of shareholders’ funds, and will not be affected
by accounting policy choices. Fortunately, we have a measure that can, in theory,
do this.
Net present value analysis was discussed in Chapter 8. We saw that if we want to
know the net present value (NPV) of an asset (whether this is a physical asset such as
a machine or a financial asset such as a share in a business) we must discount the future
cash flows generated by the asset over its life. Thus:
NPV
==
+++···+
where C
1
, C
2
, C
3
and C
n
are cash flows after one year, two years, three years and
n years, respectively, and r is the required rate of return.
Shareholders have a required rate of return, and managers must strive to generate
long-term cash flows for shares (in the form of dividends or proceeds from the sale of
the shares) that meet this rate of return. The expectation that the managers will, in the
future, fail to generate the minimum required cash flows will have the effect of reduc-
ing the value of the business as a whole and, therefore, of the individual shares in it. If
a business is to create value for its shareholders, it must be expected to generate cash
flows that exceed the required returns of shareholders. We should bear in mind here
that the value of a business and its shares is entirely dependent on two factors:
C
n
(1
++
r)
n
C
3
(1
++
r)
3
C
2
(1
++
r)
2
C
1
(1
++
r)
1
MEASURING SHAREHOLDER VALUE
343
REAL WORLD 9.10
Dirty laundry: how businesses fudge the numbers
The ways in which managers can manipulate the financial statements are many and
varied. The methods below have come to light in the recent wave of accounting scandals
that have been reported in the US and UK.
l Hollow swaps: telecoms businesses sell useless fibre optic capacity to each other in
order to generate revenues on their income statements.
l Channel stuffing: a business floods the market with more products than its distributors
can sell, artificially boosting its sales revenue. An international condom maker shifted
£60m in excess inventory on to trade customers. Also known as ‘trade loading’.
l Round tripping: also known as ‘in-and-out trading’. Used to notorious effect by Enron.
Two or more traders buy and sell energy among themselves for the same price and at
the same time. Inflates trading volumes and makes participants appear to be doing
more business than they really are.
l Pre-despatching: goods such as carpets are marked as ‘sold’ as soon as an order is
placed. This inflates sales revenues and profits.
l Off-balance-sheet activities: businesses use special-purpose entities and other devices
such as leasing to push assets and liabilities off their statements of financial position.
M09_ATRI3622_06_SE_C09.QXD 5/29/09 3:32 PM Page 343
1 expectations of future cash flows; and
2 the shareholders’ required rate of return.
Past successes are not relevant.
The NPV approach fulfils the criteria that we mentioned earlier as a means of fairly
assessing changes in shareholder value because:
l It considers the long term. The returns from an investment, such as shares, are con-
sidered over the whole of its life.
l It takes account of the cost of capital and risk. Future cash flows are discounted using
the required rates of returns from investors (that is, both long-term lenders and
shareholders). Moreover, this required rate of return will reflect the level of risk asso-
ciated with the investment. The higher the level of risk, the higher the required level
of return.
l It is not sensitive to the choice of accounting policies. Cash rather than profit is used
in the calculations and is a more objective measure of return.
Extending NPV analysis: shareholder value analysis (SVA)
We know from our consideration of NPV in Chapter 8 that, when evaluating an invest-
ment project, shareholder wealth will be maximised if we maximise the net present
value of the cash flows generated from the project. Leading on from this, the business
as a whole can be viewed as simply a portfolio of investment projects and so to max-
imise the wealth of shareholders the same principles should apply. Shareholder value
analysis (SVA) is founded on this basic idea.
The SVA approach involves evaluating strategic decisions according to their ability
to maximise value, or wealth, for shareholders.
To enable a business to assess the effect of a particular set of strategies on shareholder
value, it needs a means of measuring shareholder value both before and after adopting the
strategy and comparing the two values. We shall now go on to see how this can be done.
Measuring free cash flows
The cash flows used to measure total business value are the free cash flows. These are
the cash flows generated by the business that are available to ordinary shareholders
and long-term lenders. In other words, they are equivalent to the net cash flows from
operations after deducting tax paid and cash for additional investment. These free cash
flows can be deduced from information contained within the income statement and
statement of financial position of a business.
It is probably worth going through a simple example to illustrate how the free cash
flows are calculated in practice.
CHAPTER 9 STRATEGIC MANAGEMENT ACCOUNTING
344
‘
‘
Sagittarius plc generated sales revenue of £220m during the year and has an oper-
ating profit margin of 25 per cent of sales revenue. The depreciation charge for the
year was £8.0m and the effective tax rate for the year was 20 per cent of operat-
ing profit. During the year £11.3m was invested in additional working capital and
£15.2m was invested in additional non-current assets. A further £8.0m was
invested in the replacement of existing non-current assets.
Example 9.2
M09_ATRI3622_06_SE_C09.QXD 5/29/09 3:32 PM Page 344
This shortened approach leads us to identify the key variables in determining free
cash flows as being
l sales revenue
l operating profit margin
l tax rate
l additional investment in working capital
l additional investment in non-current assets.
These are value drivers of the business that reflect key business decisions. These deci-
sions convert into free cash flows and finally into shareholder value. Any actions that
management can take to
l boost sales revenue; and/or
l increase the operating profit margin; and/or
l reduce the effective tax rate; and/or
l reduce the investment in working capital; and/or
l reduce the investment in non-current assets
will have the effect of increasing shareholders’ wealth.
Figure 9.9 shows the process of measuring free cash flows.
MEASURING SHAREHOLDER VALUE
345
The free cash flows are calculated as follows:
£m £m
Sales revenue 220.0
Operating profit (25% × £220m) 55.0
Depreciation charge 8.0
Operating cash flows 63.0
Tax (20% × £55m) (11.0)
Operating cash flows after tax 52.0
Additional working capital (11.3)
Additional non-current assets (15.2)
Replacement non-current assets (8.0) (34.5)
Free cash flows 17.5
We can see that to derive the operating cash flows, the depreciation charge is
added back to the operating profit figure. We can also see that the cost of replace-
ment of existing non-current assets is deducted from the operating cash flows to
deduce the free cash flow figure. When we are trying to predict future free cash
flows, one way of arriving at an approximate figure for the cost of replacing exist-
ing assets is to assume that the depreciation charge for the year is equivalent to
the replacement charge for non-current assets. This would mean that the two
adjustments mentioned cancel each other out. In other words, the calculation
above could be shortened to:
£m £m
Sales revenue 220.0
Operating profit (25% × £220m) 55.0
Tax (20% × £55m) (11.0)
44.0
Additional working capital (11.3)
Additional non-current assets (15.2 ) (26.5)
Free cash flows 17.5
M09_ATRI3622_06_SE_C09.QXD 5/29/09 3:32 PM Page 345
At this point, it is probably worth going through an example to illustrate the way in
which we might calculate shareholder value for a business.
Business value and shareholder value
We have just seen how SVA measures the value of the business as a whole through dis-
counting the free cash flows. The value of the business as a whole is not necessarily,
however, that part which is available to the shareholders.
CHAPTER 9 STRATEGIC MANAGEMENT ACCOUNTING
346
Measuring free cash flows
Figure 9.9
The information required in the process of measuring the free cash flows for a business can be
gleaned from the income statement and statement of financial position of a business.
If the net present value of future cash flows generated by the business represents the
value of the business as a whole, how can we derive that part of the value of the busi-
ness that is available to shareholders?
A business will normally be financed by a combination of borrowing and ordinary share-
holders’ funds. Thus lenders will also have a claim on the total value of the business. That
part of the total business value that is available to ordinary shareholders can therefore be
derived by deducting from the total value of the business (total NPV) the market value of
any borrowings outstanding. Hence:
Shareholder value = total business value − market value of outstanding borrowings
Activity 9.7
M09_ATRI3622_06_SE_C09.QXD 5/29/09 3:32 PM Page 346
MEASURING SHAREHOLDER VALUE
347
The directors of United Pharmaceuticals plc are considering making a takeover bid
for Bortex plc, which produces vitamins and health foods. It will do this by offer-
ing to buy all of the shares in Bortex plc. It is expected that the Bortex plc share-
holders will reject any bid that values the shares at less than £11 each.
Bortex plc generated sales revenue for the most recent year of £3,000m.
Extracts from the business’s statement of financial position at the end of the most
recent year are as follows:
£m
Equity
Share capital £1 ordinary shares 400
Reserves 380
780
Non-current liabilities
Loan notes 120
Forecasts that have been prepared by the business planning department of
Bortex plc are as follows:
l Sales revenue will grow at 10 per cent a year for the next five years.
l The operating profit margin is currently 15 per cent and is likely to be main-
tained at this rate in the future.
l The cash tax rate is 25 per cent.
l Replacement non-current asset investment (RNCAI) will be in line with the
annual depreciation charge each year.
l Additional non-current asset investment (ANCAI) for each year over the next
five years will be 10 per cent of sales revenue growth.
l Additional working capital investment (AWCI) for each year over the next five
years will be 5 per cent of sales revenue growth.
After five years, the business’s sales revenues will stabilise at their Year 5 level. The
business has a cost of capital of 10 per cent and the loan notes figure in the state-
ment of financial position reflects its current market value.
The free cash flow calculation will be as follows:
Year 1 Year 2 Year 3 Year 4 Year 5 After Year 5
£m £m £m £m £m £m
Sales revenue 3,300.0 3,630.0 3,993.0 4,392.3 4,831.5 4,831.5
Operating profit (15%) 495.0 544.5 599.0 658.8 724.7 724.7
Less Cash tax (25%) (123.8) (136.1) (149.8) (164.7) (181.2) (181.2)
Operating profit 371.2 408.4 449.2 494.1 543.5 543.5
after cash tax
Less
ANCAI* (30.0) (33.0) (36.3) (39.9) (43.9) –
AWCI
†
(15.0) (16.5) (18.2) (20.0) (22.0) –
Free cash flows 326.2 358.9 394.7 434.2 477.6 543.5
Notes:
* The additional non-current asset investment is 10 per cent of sales revenue growth. In the first year,
sales revenue growth is £300m (that is, £3,300m − £3,000m). Thus, the investment will be 10% ×
£300m = £30m. Similar calculations are carried out for the following years.
†
The additional working capital investment is 5 per cent of sales revenue growth. In the first year the
investment will be 5% × £300m = £15m. Similar calculations are carried out in following years.
Example 9.3
‘
M09_ATRI3622_06_SE_C09.QXD 5/29/09 3:32 PM Page 347
Managing with SVA
We saw earlier that the adoption of SVA indicates a commitment to managing the
business in such a way as to maximise shareholder returns. Those who support this
approach argue that SVA can be a powerful tool for strategic planning. For example,
SVA can be extremely useful when considering major shifts of direction such as
l acquiring new businesses
l selling existing businesses
l developing new products or markets
l reorganising or restructuring the business
because it takes account of all the elements that determine shareholder value.
Figure 9.10 shows how shareholder value is derived.
CHAPTER 9 STRATEGIC MANAGEMENT ACCOUNTING
348
Having derived the free cash flows (FCF), the total business value can be calcu-
lated as follows:
Year FCF Discount factor Present value
£m @ 10% £m
1 326.2 0.909 296.5
2 358.9 0.826 296.5
3 394.7 0.751 296.4
4 434.2 0.683 296.6
5 477.6 0.621 296.6
Terminal value: 543.5/0.10 (see Note) 5,435.0 0.621 3,375.1
Total business value 4,857.7
Note: After Year 5 there is no further sales expansion, so no increase in assets will be involved. Also,
since the shareholders require a 10 per cent return, they will place a value of £5,435m on the future
returns after Year 5. This is a value on which £543.5m represents a 10 per cent return.
Example 9.3 continued
What is the shareholder value figure for the business in Example 9.3?
Would the sale of the shares at £11 per share add value for the shareholders of
Bortex plc?
Shareholder value will be the total business value less the market value of the loan notes.
Hence, shareholder value is
£4,857.7m − £120m = £4,737.7m
The proceeds from the sale of the shares to United Pharmaceuticals would yield
400m × £11 = £4,400.0m
Thus, from the point of view of the shareholders of Bortex plc, the sale of the business, at
the share price mentioned, would not increase shareholder value.
Activity 9.8
M09_ATRI3622_06_SE_C09.QXD 5/29/09 3:32 PM Page 348
SVA is useful in focusing attention on the value drivers that create shareholder wealth.
For example, we saw earlier that the key variables in determining free cash flows were
l sales revenue
l operating profit margin
l cash tax rate
l additional investment in working capital
l additional investment in non-current assets.
In order to improve free cash flows and, in turn, shareholder value, management tar-
gets can be set for improving performance in relation to each value driver and respon-
sibility assigned for achieving these targets.
MEASURING SHAREHOLDER VALUE
349
Deriving shareholder value
Figure 9.10
The five value drivers – sales revenue, operating profit, tax rate, additional non-current (fixed)
assets and additional working capital – will determine the free cash flows. These cash flows will
be discounted using the investors’ required rate of return from investors to determine the total
value of the business. If we deduct the market value of any borrowings from this figure, we are
left with a measure of shareholder value.
Can you suggest what might be the practical problems of adopting an SVA approach?
Two practical problems spring to mind:
1 Forecasting future cash flows lies at the heart of this approach. In practice, forecasting
can be difficult, and simplifying assumptions will usually have to be made.
2 SVA requires more comprehensive information (for example, information concerning
the value drivers) than the traditional measures discussed earlier.
You may have thought of other problems.
Activity 9.9
M09_ATRI3622_06_SE_C09.QXD 5/29/09 3:32 PM Page 349
The implications of SVA
It is worth emphasising that supporters of SVA believe that this measure should replace
the traditional accounting measures of value creation such as profit, earnings per share
and return on ordinary shareholders’ funds. Thus, only if shareholder value increases
over time can we say that there has been an increase in shareholder wealth. Any change
over time can be measured by comparing shareholder value at the beginning and the
end of a particular period.
We can see that SVA is really a radical departure from the conventional approach to
managing a business. It will require different performance indicators, different financial
reporting systems and different management incentive methods. It may also require a
change of culture within the business to accommodate the shareholder value philo-
sophy. Not all employees may be focused on the need to maximise shareholder wealth.
If SVA is implemented, it can provide the basis of targets for managers to work towards,
on a day-to-day basis, which should promote maximisation of shareholder value.
Economic value added (EVA
®
)
Economic value added (EVA
®
) has been developed and trademarked by a US manage-
ment consultancy firm, Stern Stewart. However, EVA
®
is based on the idea of economic
profit, which has been around for many years. The measure reflects the point made
earlier that, for a business to be profitable in an economic sense, it must generate
returns that exceed the required returns of investors. It is not enough simply to make
an accounting profit, because this measure does not take full account of the returns
required by investors.
EVA
®
indicates whether or not the returns generated exceed the required returns by
investors. The formula is as follows:
EVA
®
==
NOPAT
−−
(R
××
C)
where
NOPAT = net operating profit after tax
R = required returns of investors
C = capital invested (that is, the net assets of the business).
Only when EVA
®
is positive can we say that the business is increasing shareholder
wealth. To maximise shareholder wealth, managers must increase EVA
®
by as much as
possible.
CHAPTER 9 STRATEGIC MANAGEMENT ACCOUNTING
350
‘
Can you suggest what managers might do in order to increase EVA
®
? (Hint: Use the for-
mula shown above as your starting point.)
The formula suggests that in order to increase EVA
®
managers may try to:
l Increase NOPAT. This may be done either by reducing expenses or by increasing sales
revenue.
l Reduce capital invested by using assets more efficiently. This means selling off any
assets that are not generating adequate returns and investing in assets that are gener-
ating a satisfactory NOPAT.
Activity 9.10
M09_ATRI3622_06_SE_C09.QXD 5/29/09 3:32 PM Page 350
EVA
®
relies on conventional financial statements (income statement and state-
ment of financial position) to measure the wealth created for shareholders. However,
the NOPAT and capital figures shown on these statements are used only as a starting
point. They have to be adjusted because of the problems and limitations of conven-
tional measures. According to Stern Stewart, the major problem is that both profit
and capital tend to be understated because of the conservative bias in accounting
measurement.
Profit is understated as a result of judgemental write-offs (such as goodwill written
off or research and development expenditure written off) and as a result of excessive
provisions being created (such as an allowance for trade receivables (bad debt provi-
sion)). Both of these stem from taking an unrealistically pessimistic view of the value
of some of the business’s assets.
Capital is also understated because assets are reported at their original cost (less
amounts written off for depreciation and so on), which can produce figures consider-
ably below current market values. In addition, certain assets, such as internally gener-
ated goodwill and brand names, are omitted from the financial statements because no
external transactions have occurred.
Stern Stewart has identified more than 100 adjustments that could be made to
the conventional financial statements in order to eliminate the conservative bias.
However, it is believed that, in practice, only a handful of adjustments will usually
have to be made to the accounting figures of any particular business. Unless an adjust-
ment is going to have a significant effect on the calculation of EVA
®
it is really not
worth making. The adjustments made should reflect the nature of the particular busi-
ness. Each business is unique and so must customise the calculation of EVA
®
to its
particular circumstances. (This aspect of EVA
®
can be seen as either indicating flexibil-
ity or as being open to manipulation depending on whether or not you support this
measure.)
Common adjustments that have to be made include:
1 Research and development (R&D) costs and marketing costs. These costs should be written
off over the period that they benefit. In practice, however, they are often written off
in the period in which they are incurred. This means that any amounts written
off immediately should be added back to the assets on the statement of financial
position, thereby increasing invested capital, and then written off over time.
2 Restructuring costs. This item can be viewed as an investment in the future rather
than an expense to be written off. Supporters of EVA
®
argue that by restructuring,
the business is better placed to meet future challenges and so any amounts incurred
should be added back to assets.
3 Marketable investments. Investment in shares and loan notes of other businesses are
not included as part of the capital invested in the business. This is because the
income from marketable investments is not included in the calculation of operating
profit. (Income from this source will be added in the income statement after operat-
ing profit has been calculated.)
Let us now consider a simple example to show how EVA
®
may be calculated.
MEASURING SHAREHOLDER VALUE
351
l Reduce the required rates of return for investors. This may be achieved by changing the
capital structure in favour of borrowing (which tends to be cheaper to service than share
capital). However, this strategy can create problems.
M09_ATRI3622_06_SE_C09.QXD 5/29/09 3:32 PM Page 351
CHAPTER 9 STRATEGIC MANAGEMENT ACCOUNTING
352
Scorpio plc was established two years ago and has produced the following state-
ment of financial position and income statement at the end of the second year
of trading.
Statement of financial position as at the end of the second year
£m
Non-current assets
Plant and equipment 80.0
Motor vehicles 12.4
Marketable investments 6.6
99.0
Current assets
Inventories 34.5
Receivables 29.3
Cash 2.1
65.9
Total assets 164.9
Equity
Share capital 60.0
Retained earnings 23.7
83.7
Non-current liabilities
Loan notes 50.0
Current liabilities
Trade payables 30.3
Taxation 0.9
31.2
Total equity and liabilities 164.9
Income statement for the second year
£m
Sales revenue 148.6
Cost of sales (76.2)
Gross profit 72.4
Wages (24.5)
Depreciation of plant and equipment (12.8)
Marketing costs (22.5)
Allowances for trade receivables (4.5)
Operating profit 8.1
Income from investments 0.4
8.5
Interest payable (0.5)
Ordinary profit before taxation 8.0
Restructuring costs (2.0)
Profit before taxation 6.0
Tax (1.8)
Profit for the year 4.2
Example 9.4
M09_ATRI3622_06_SE_C09.QXD 5/29/09 3:32 PM Page 352
MEASURING SHAREHOLDER VALUE
353
Discussions with the finance director reveal the following:
1 Marketing costs relate to the launch of a new product. The benefits of the mar-
keting campaign are expected to last for three years (including this most recent
year).
2 The allowance for trade receivables was created this year and the amount is
considered to be very high. A more realistic figure for the allowance would be
£2.0 million.
3 Restructuring costs were incurred as a result of a collapse in a particular pro-
duct market. By restructuring the business, benefits are expected to flow for an
infinite period.
4 The business has a 10 per cent required rate of return for investors.
The first step in calculating EVA
®
is to adjust the net operating profit after tax
to take account of the various points revealed by the discussion with the finance
director. The revised figure is calculated as follows:
NOPAT adjustment
£m £m
Operating profit 8.1
Tax (1.8)
6.3
EVA
®
adjustments (to be added back to profit)
Marketing costs (2/3 × 22.5) 15.0
Excess allowance 2.5 17.5
Adjusted NOPAT 23.8
The next step is to adjust the net assets (as represented by equity and loan notes)
to take account of the points revealed.
Adjusted net assets (or capital invested)
£m £m
Net assets (from statement of financial position) 133.7
Marketing costs (Note 1) 15.0
Allowance for trade receivables 2.5
Restructuring costs (Note 2) 2.0 19.5
153.2
Marketable investments (Note 3) (6.6)
Adjusted net assets 146.6
Notes:
1 The marketing costs represent two years’ benefits added back (2/3 × £22.5m).
2 The restructuring costs are added back to the net assets as they provide benefits over an infinite
period. (Note that they were not added back to the operating profit as these costs were deducted
after arriving at operating profit in the income statement.)
3 The marketable investments do not form part of the operating assets of the business, and the
income from these investments is not part of the operating income.
M09_ATRI3622_06_SE_C09.QXD 5/29/09 3:32 PM Page 353
Although EVA
®
is used by many large businesses, both in the US and Europe, it tends
to be used for management purposes only: few businesses report this measure to share-
holders. One business that does, however, is Whole Foods Market, a leading retailer of
natural and organic foods, which operates more than 270 stores in the US and the UK.
Real World 9.11 describes the way in which the business uses EVA
®
and the results of
doing so.
CHAPTER 9 STRATEGIC MANAGEMENT ACCOUNTING
354
Can you work out the EVA
®
for the second year of the business in Example 9.4?
EVA
®
can be calculated as follows:
EVA
®
= NOPAT − (R × C) = £23.8m − (10% × £146.6m)
= £9.1m (to one decimal place)
We can see that EVA
®
is positive and so the business increased shareholder wealth dur-
ing the year.
Activity 9.11
REAL WORLD 9.11
The whole picture
Whole Foods Market aims to improve its business by achieving improvements to EVA
®
. To
encourage managers along this path, an incentive plan, based on improvements to EVA
®
,
has been introduced. The plan embraces senior executives, regional managers and store
managers, and the bonuses awarded form a significant part of their total remuneration.
To make the incentive plan work, measures of EVA
®
based on the whole business, the
regional level and the store level are calculated. More than five hundred managers are
already included in the incentive plan and this number is expected to increase in the future.
EVA
®
is used to evaluate capital investment decisions such as the acquisition of new
stores and the refurbishment of existing stores. Unless there is clear evidence that value
will be added, investment proposals are rejected. EVA
®
is also used to improve operational
efficiency. It was mentioned earlier that one way in which EVA
®
can be increased is
through an improvement in NOPAT. The business is, therefore, continually seeking ways
to improve sales and profit margins and to bear down on costs.
EVA
®
figures for 2005 and 2006 are shown below. The relevant tax rate for each year
was 40% and the cost of capital was 9%.
Years ended: 24 September 2006 25 September 2005
$000 $000
NOPAT 215,281 165,579
Capital cost ( 150,871) ( 139,793 )
EVA
®
64,410 25,786
Improvement in EVA
®
38,624
Source: www.wholefoodsmarket.com.
M09_ATRI3622_06_SE_C09.QXD 5/29/09 3:32 PM Page 354
One often-mentioned limitation of EVA
®
is that it can be difficult to allocate rev-
enues, costs and capital easily between different business units (individual stores in the
case of Whole Food Markets). As a result, this technique cannot always be applied to
individual business units. We have just seen, however, that Whole Food Markets seems
able to do this.
The main advantage of this measure is the discipline to which managers are sub-
jected as a result of the charge for capital that has been invested. Before any increase in
shareholder wealth can be recognised, an appropriate deduction is made for the use of
business resources. Thus, EVA
®
encourages managers to use these resources efficiently.
Where managers are focused simply on increasing profits, there is a danger that the
resources used to achieve any increase in profits will not be taken into proper account.
The benefits of EVA
®
may be undermined, however, if a short-term perspective is
adopted. Real World 9.12 describes the problems of a large engineering business that is
using EVA
®
and where it is claimed that the technique may be distorting management
behaviour.
EVA
®
and SVA compared
Although at first glance it may appear that EVA
®
and SVA are worlds apart, in fact
the opposite is true. EVA
®
and SVA are closely related and, in theory at least, should
produce the same figure for shareholder value. The way in which shareholder value is
calculated using SVA has already been described. The EVA
®
approach to calculating
shareholder value adds the capital invested to the present value of future EVA
®
flows
and then deducts the market value of any borrowings. Figure 9.11 illustrates the two
approaches to determining shareholder value.
MEASURING SHAREHOLDER VALUE
355
REAL WORLD 9.12
Hard times
Klaus Kleinfeld, Siemens’ chief executive, is stuck in an unfortunate position after a deeply testing
period at the helm of Europe’s largest engineering group.
On the one side he is receiving pressure from investors fed up with a stagnating share price
and profitability that continues to lag behind most of the German group’s main competitors. But
from the other he is under attack from the powerful IG Metall union aimed at holding him back from
doing any serious restructuring. . . .
‘He is having to walk a tightrope,’ says a former senior Siemens director. ‘His focus right now
has to be on fixing the problem areas and very quickly.’ . . .
Ben Uglow, an analyst at Morgan Stanley, . . . says ‘I think the real question now in Siemens
is one of management incentivisation. I think Kleinfeld has done a good job in the last year of
refocusing the portfolio but some of his big chiefs have let him down.’ Many investors are con-
cerned that the margin targets that Mr Kleinfeld set last year for all his divisions to reach by April
2007 are distorting matters by making managers relax if they have already exceeded them.
Mr Kleinfeld and other directors disagree vehemently. Management pay is based on the
‘economic value added’ each division provides against each year’s budget, not on specific margin
targets. But a former senior director says this has led to a lack of investment in some parts of
the business as managers look to earn as much as possible.
Source: Siemens chief finds himself in a difficult balancing act, ft.com (Milne, R.), © The Financial Times Limited, 6 November 2006.
FT
M09_ATRI3622_06_SE_C09.QXD 5/29/09 3:32 PM Page 355
CHAPTER 9 STRATEGIC MANAGEMENT ACCOUNTING
356
Two approaches to determining shareholder value
Figure 9.11
Both EVA
®
and SVA can provide a measure of shareholder value. Total business value can be
derived either by discounting the free cash flows over time or by discounting the EVA
®
flows
over time and adding the capital invested. Whichever approach is used, the market value of
borrowings must then be deducted to derive shareholder value.
Leo Ltd has just been formed and has been financed by a £20 million issue of
share capital and a £10 million issue of loan notes. The proceeds of the issue have
been invested in non-current (fixed) assets with a life of three years and during
this period these assets will depreciate by £10 million per year. The operating
profit after tax is expected to be £15 million each year. There will be no replace-
ment of non-current assets during the three-year period and no investment in
working capital. At the end of the three years, the business will be wound up and
the non-current assets will have no residual value.
The required rate of return by investors is 10 per cent.
The SVA approach to determining shareholder value will be as follows:
Year Free cash flows Discount rate Present value
£m 10% £m
1 25.0* 0.91 22.8
2 25.0 0.83 20.7
3 25.0 0.75 18.7
Total business value 62.2
Loan notes ( 10.0 )
Shareholder value 52.2
* The free cash flows will be the operating profit after tax plus the depreciation charge (that is,
£15m + £10m). In this case, there are no replacement non-current assets against which the depreci-
ation charge can be netted off. It must therefore be added back.
Example 9.5
Let us go through a simple example to illustrate this point.
M09_ATRI3622_06_SE_C09.QXD 5/29/09 3:32 PM Page 356
EVA
®
or SVA?
Although both EVA
®
and SVA are consistent with the objective of maximising share-
holder wealth and, in theory, should produce the same decisions and results, the sup-
porters of EVA
®
claim that this measure has a number of practical advantages over SVA.
One such advantage is that EVA
®
sits more comfortably with the conventional finan-
cial reporting systems and financial reports. There is no need to develop entirely new
systems to implement EVA
®
as it can be calculated by making a few adjustments to the
conventional income statement and statement of financial position.
It is also claimed that EVA
®
is more useful as a basis for rewarding managers. Both
EVA
®
and SVA support the idea that management rewards should be linked to increases
in shareholder value. This should ensure that the interests of managers are closely aligned
to the interests of shareholders. Under the SVA approach, management rewards will be
determined on the basis of the contribution made to the generation of long-term cash
flows. However, there are practical problems in using SVA for this purpose.
Under EVA
®
, managers can receive bonuses based on actual achievement during a
particular period. If management rewards are linked to a single period, however, there
is a danger that managers will pay undue attention to increasing EVA
®
during this
period rather than over the long term. The objective should be to maximise EVA
®
over
MEASURING SHAREHOLDER VALUE
357
The EVA
®
approach to determining shareholder value will be as follows:
Year Opening capital Capital charge Operating profit EVA
®
Discount Present value
invested (C) (10% × C) after tax rate 10% of EVA
®
£m £m £m £m £m
1 30.0* 3.0 15.0 12.0 0.91 10.9
2 20.0 2.0 15.0 13.0 0.83 10.8
3 10.0 1.0 15.0 14.0 0.75 10.5
32.2
Opening capital 30.0
62.2
Loan notes ( 10.0 )
Shareholder value 52.2
* The capital invested decreases each year by the depreciation charge (that is, £10 million).
What are the practical problems that may arise when using SVA calculations to reward
managers? (Hint: Think about how SVA is calculated.)
The SVA approach measures changes in shareholder value by reference to predicted
changes in future cash flows and it is unwise to pay managers on the basis of predicted
rather than actual achievements. If the predictions are optimistic, the effect will be that
the business rewards optimism rather than real achievement. There is also a risk that
unscrupulous managers will manipulate predicted future cash flows in order to increase
their rewards.
Activity 9.12
M09_ATRI3622_06_SE_C09.QXD 5/29/09 3:32 PM Page 357
the longer term. Where a business has a stable level of sales revenue, operating assets
and borrowing, a current-period focus is likely to be less of a problem than where these
elements are unstable over time. A stable pattern of operations minimises the risk that
improvements in EVA
®
during the current period are achieved at the expense of future
periods. Nevertheless, any reward system for managers must encourage a long-term
perspective and so rewards should be based on the ability of managers to improve EVA
®
over a number of years rather than a single year.
Real World 9.13 describes the way in which one business uses EVA
®
to reward its
managers.
It is worth noting that Stern Stewart believes that bonuses, calculated as a percentage
of EVA
®
, should form a very large part of the total remuneration package for managers.
Thus, the higher the EVA
®
figure, the higher the rewards to managers – with no upper
limits. The philosophy is that EVA
®
should make managers wealthy provided it makes
shareholders extremely wealthy. A bonus system should encompass as many managers
as possible in order to encourage a widespread commitment to implementing EVA
®
.
CHAPTER 9 STRATEGIC MANAGEMENT ACCOUNTING
358
REAL WORLD 9.13
Rewarding managers
Hanson PLC, a major supplier of heavy building materials, adopts a bonus system for its
directors based on EVA
®
. EVA
®
generated is accumulated in a ‘bonus bank’ and the direc-
tors are paid a portion of the EVA
®
bonus bank during a particular year; the remainder is
carried forward for payment in future years. The following is an extract from the 2006
annual report of the business.
Annual bonus scheme
The annual bonus scheme for the Executive Directors and other senior executives is aligned with
changes in shareholder value through the economic value added methodology. The main principle
of economic value added is to recognise that over time a company should generate returns in excess
of its cost of capital – the return that lenders and shareholders expect of the Company each year.
The annual bonus scheme is calibrated by reference to target levels of bonus and, for the
Executive Directors and other senior executives, works on a bonus banking arrangement whereby
each year the improvement in the group’s overall economic value added for that year determines
whether there is a bonus bank addition or deduction. Following the addition or deduction, the
participant receives one-third of the accumulated bonus bank. There is neither a cap (maximum
addition into the bonus bank each year) nor a floor (maximum deduction from the bonus bank
each year).
The bonus bank has two main functions; firstly it ensures that individuals do not make short-
term decisions such as deferring essential expenditure from one year to the next and receive a
bonus for doing so; and secondly, the bonus bank can act as a retention tool.
For 2006, the target level of bonus for A J Murray was 62.5% of basic salary and for G
Dransfield 37.5% of basic salary. No bonus entitlement arose for J C Nicholls who left the
Company on October 31, 2006.
Improvement in the group’s overall economic value added for the year to December 31, 2006
determined the bonus bank addition for the Executive Directors. The strong operating and profit
performance in 2006 led to improvement in the group’s economic value added and resulted in
additions to the bonus bank of 69.4% of basic salary for A J Murray and 41.6% of basic salary for
G Dransfield. The bonuses paid in respect of the year to December 31, 2006 to the Executive
Directors were £509,262 for A J Murray and £161,986 for G Dransfield.
Source: Hanson PLC Annual Report 2006, www.hanson.biz.
M09_ATRI3622_06_SE_C09.QXD 5/29/09 3:32 PM Page 358
The techniques described in this chapter are all potentially valuable to a business, but
their successful implementation is far from certain. According to one source, failure
rates are as high as 60 per cent (see reference 4 at the end of the chapter). A depress-
ingly common scenario is that a new technique will be enthusiastically adopted but,
within a short while, disillusionment will set in. Managers will decide that the tech-
nique does not meet their requirements and so it will be abandoned. In some busi-
nesses, a pattern of adoption, disillusionment and abandonment of new techniques
may develop. Where this occurs, employees are likely to become sceptical and to dis-
miss any newly-adopted technique as simply a passing fad.
Introducing a new technique is likely to be costly and can cause considerable
upheaval. Managers must, therefore, tread carefully. They must try to identify the
potential problems, as well as the benefits, that may accrue from its adoption. The
main problems that lie in wait are:
l the excessive optimism that managers often have in their ability to implement a
new technique that will quickly yield good results;
l the assumption that others will share the enthusiasm felt for a new technique;
l the failure to acknowledge that there will be losers as well as winners when a new
technique is implemented (see reference 4 at the end of the chapter).
Managers must be realistic about what can be achieved from a new technique and
must accept that resistance to its introduction is likely. They must not underestimate
what it will take to ensure a successful outcome.
Just another fad?
JUST ANOTHER FAD?
359
You have recently heard a fellow student talking about strategic management accounting
as follows:
1 ‘Identifying cost-saving measures really needs to be left to accountants. Non-experts
tend to cause problems when they attempt it.’
2 ‘Customer profitability analysis is about finding out which of your customers are the
more profitable businesses and trying to encourage the ones that are more profitable
to place orders. This is to avoid having customers that go bankrupt.’
3 ‘Shareholder value analysis (SVA) tries to give shareholders their returns in the form that
they like. Some shareholders prefer dividends and others prefer profits to be ploughed
back.’
4 ‘EVA
®
stands for “equity value analysis” and is an alternative name for SVA.’
5 ‘The “balanced scorecard” is the American name for what people in the UK call a state-
ment of financial position (balance sheet).’
Required:
Critically comment on the student’s statements, explaining any technical terms.
The answer to this question can be found in Appendix B at the back of the book.
Self-assessment question 9.1
M09_ATRI3622_06_SE_C09.QXD 5/29/09 3:32 PM Page 359
The main points in this chapter may be summarised as follows:
Strategic management accounting (SMA)
l SMA is concerned with providing information to support strategic plans and decisions.
l It is more outward looking, more concerned with outperforming the competition
and more concerned with monitoring progress towards strategic objectives than
conventional management accounting.
Facing outwards
l Competitor analysis examines the objectives, strategies, assumptions and resource
capabilities of competitors.
l Customer profitability analysis assesses the profitability of each customer or type of
customer to the business.
Competitive advantage through cost leadership
l Total life-cycle costing is concerned with tracking and reporting all costs relating to
a product from the beginning to the end of its life.
l Target costing is a market-based approach to managing costs that is used at the plan-
ning stage.
– It attempts to reduce costs so that the market price covers the cost plus an accept-
able profit.
– It distinguishes between activities that add value and those that do not; it may be
possible to save costs by eliminating or reducing the cost of the non-value-adding
ones.
l Kaizen costing is concerned with continual and gradual cost reduction and is used
at the production stage.
l Costs may be managed without using sophisticated techniques if:
– There is a shared responsibility for managing costs.
– Discussion of costs becomes an everyday activity.
– Costs are managed locally.
– Benchmarking is used at regular intervals.
– The focus is on managing rather than reducing costs.
l Value chain analysis involves analysing the various activities in the product life
cycle to identify and try to eliminate non-value-added activities.
Translating strategies into action
l The balanced scorecard is a management tool that uses financial and non-financial
measures to assess progress towards objectives.
l It has four aspects: financial, customer, internal business process, and learning and
growth.
l It encourages a balanced approach to managing the business.
Measuring shareholder value
l Shareholder value is seen as the key objective of most businesses.
l Two approaches used to measure shareholder value are shareholder value analysis
(SVA) and economic value added (EVA
®
).
l Shareholder value analysis (SVA) is based on the concept of net present value analysis.
l It identifies key value drivers for generating shareholder value.
SUMMARY
CHAPTER 9 STRATEGIC MANAGEMENT ACCOUNTING
360
M09_ATRI3622_06_SE_C09.QXD 5/29/09 3:32 PM Page 360
l Economic value added is a means of measuring whether the returns generated by the
business exceed the required returns of investors.
EVA
®
= NOPAT − (R × C)
where
NOPAT = net operating profit after tax
R = required returns from investors
C = capital invested (that is, the net assets of the business).
1 Crawford, D. and Baveja, S., ‘In search of new value for the support operation’, ft.com, 27 July
2006.
2 Hopwood, A., ‘Costs count in the strategic agenda’, ft.com, 13 August 2002.
3 Kaplan, R. and Norton, D., The Balanced Scorecard, Harvard Business School Press, 1996.
4 Bruce, R., ‘Tread a careful path between creative hope and blind faith’, ft.com, 2 February 2006.
If you would like to explore topics covered in this chapter in more depth, we recommend the
following books:
Bhimani, A., Horngren, C., Datar, S. and Foster, G., Management and Cost Accounting, 4th edn, FT
Prentice Hall, 2008, chapter 22.
McWatters, C., Zimmerman, J. and Morse, D., Management Accounting: Analysis and Interpretation,
FT Prentice Hall, 2008, chapter 4.
Kaplan, R. and Norton, D., The Balanced Scorecard, Harvard Business School Press, 1996.
Mills, R., The Dynamics of Shareholder Value, Mars Business Associates, 1998.
Stern, J. and Shelly, J., The EVA Challenge, John Wiley, 2001.
Further reading
References
FURTHER READING
361
Competitor analysis p. 319
Customer profitability analysis (CPA)
p. 323
Lean manufacturing p. 329
Value chain analysis p. 330
Value drivers p. 334
Balanced scorecard p. 334
Shareholder value analysis (SVA)
p. 344
Free cash flows p. 344
Economic value added (EVA
®
)
p. 350
Key terms
‘
M09_ATRI3622_06_SE_C09.QXD 5/29/09 3:32 PM Page 361
Answers to these questions can be found in Appendix C at the back of the book.
How does strategic management accounting differ from its more traditional counterpart?
Both Customer A and Customer B buy 1,000 units of your business’s service each year, paying
the same price per unit. Why might your business regard Customer A as a desirable customer,
but not Customer B?
What is the principle on which shareholder value analysis is based?
What are the four main areas on which the balanced scorecard is based?
9.4
9.3
9.2
9.1
Exercises 9.4 to 9.8 are more advanced than 9.1 to 9.3. Those with a coloured number have
answers in Appendix D at the back of the book. If you wish to try more exercises, visit the
students’ side of the Companion Website at www.pearsoned.co.uk/atrillmclaney.
Aires plc was recently formed and issued 80 million £0.50 shares at nominal value and loan
notes of £24m. The business used the proceeds from the capital issues to purchase the remain-
ing lease on some commercial properties that are rented out to small businesses. The lease will
expire in four years’ time and during that period the operating profits are expected to be £12m
each year. At the end of the four years, the business will be wound up and the lease will have
no residual value.
The required rate of return by investors is 12 per cent.
Required:
Calculate the expected shareholder value generated by the business over the four years, using
(a)
the SVA approach
(b) the EVA
®
approach.
You have recently heard someone making the following statement about competitor profitabil-
ity analysis (CPA).
‘CPA is an assessment of how profitable competitors are, that is carried out in an attempt to establish a
benchmark by which one’s own business’s success can be measured. Usually most of the information
for this can be found in the competitors’ annual report and financial statements. Usually competitors are
willing to provide information about their financial results so that any gaps in the CPA can be filled in.’
Required:
Comment on this statement.
Sharma plc makes one standard product for which it charges the same basic price of £20 a unit,
though discounts are allowed to certain customers. The business is in the process of carrying
out a profitability analysis of all of its customers during the financial year just ended.
9.3
9.2
9.1
CHAPTER 9 STRATEGIC MANAGEMENT ACCOUNTING
362
REVIEW QUESTIONS
EXERCISES
M09_ATRI3622_06_SE_C09.QXD 5/29/09 3:32 PM Page 362
Information about Lopez Ltd, one of Sharma’s customers, is as follows:
Discount on sales price 5%
Number of products sold 40,000 units
Manufacturing cost £12 a unit
Number of sales orders 22
Number of deliveries 22
Distance travelled to deliver 120 miles
Number of sales visits from Sharma’s staff 30
Sharma uses an activity-based approach to ascribing costs to customers, as follows:
Cost pool Cost driver Rate
Order handling Number of orders £75 an order
Delivery costs Miles travelled £1.50 a mile
Customer sales visits Number of visits £230 a visit
Lopez Ltd usually takes two months’ credit, of which the cost to Sharma is estimated at
2 per cent per month.
Required:
Calculate the profit that Sharma plc derived from sales to Lopez Ltd during last year.
(a) The shareholder value approach to managing businesses is different to the stakeholder
approach to managing businesses. In the latter case, the different stakeholders of the busi-
ness (employees, customers, suppliers and so on) are considered as being of equal import-
ance and so the interests of shareholders will not dominate. Is it possible for these two
approaches to managing businesses to co-exist in harmony within a particular economy?
(b) It has often been argued that businesses are overcapitalised. If this is true, what might
be the reasons for businesses having too much capital and how can EVA
®
help avoid this
problem?
Virgo plc is considering introducing a system of EVA
®
and wants its managers to focus on the
longer term rather than simply focus on the year-to-year EVA
®
results. The business is seeking
your advice as to how a management bonus system could be arranged so as to ensure that the
longer term is taken into account. The business is also unclear as to how much of the managers’
pay should be paid in the form of a bonus and when such bonuses should be paid. Finally, the
business is unclear as to where the balance between individual performance and corporate
performance should be struck within any bonus system.
The finance director has recently produced figures that show that if Virgo plc had used EVA
®
over the past three years, the results would have been as follows:
2006 £25m (profit)
2007 £20m (loss)
2008 £10m (profit)
Required:
Set out your recommendations for a suitable bonus system for the divisional managers of the
business.
Leo plc is considering entering a new market. A new product has been developed at a cost of
£5m and is now ready for production. The market is growing and estimates from the finance
department concerning future sales revenue of the new product are as follows:
9.6
9.5
9.4
EXERCISES
363
M09_ATRI3622_06_SE_C09.QXD 5/29/09 3:32 PM Page 363