Tools for Business Decision Management Makers_11 docx
Bạn đang xem bản rút gọn của tài liệu. Xem và tải ngay bản đầy đủ của tài liệu tại đây (833.18 KB, 33 trang )
CHAPTER 10 MEASURING PERFORMANCE
372
We can see that divisionalisation poses a major challenge for top management.
Somehow, it must encourage management discretion at the divisional level whilst try-
ing to ensure that the divisional objectives are consistent with the overall strategic
objectives of the business as a whole. This requires sound judgement, as there are really
no techniques or models that can be applied to solve this problem.
A further challenge for top management is to identify valid and reliable performance
measures that can help assess both the division and its divisional managers. It is to this
challenge that we now turn.
Businesses operate with the financial objective of increasing shareholders’ wealth,
which on a short-term basis translates into making a profit. It is not surprising, there-
fore, that profits and profitability are of central importance in measuring the per-
formance of both the operating divisions and their divisional managers. There are,
however, various measures of profit that we can use for these purposes. When decid-
ing on the appropriate measure, it is important to be clear about the purpose for which
it is to be used.
To help understand the issues involved, let us take a look at the following divisional
income statement. We can see that it incorporates various measures of profit that can
be used to assess performance and we shall consider each of these in turn.
Measuring divisional profit
the business as a whole. Though such a policy would cut across the autonomy of divisional
managers, it is important for them to appreciate that they are not operating completely
independent units and that divisional managers also have responsibilities towards the
business as a whole.
The problem of risk avoidance by management is a complex one that may be difficult
to deal with in practice. It might be possible, however, to encourage divisional managers
to take on more risk if the rewards offered reflect the higher levels of risk involved.
Observation of real life tells us that individuals will often be prepared to take on greater risk
provided that they receive compensation in the form of higher rewards.
If things start to go wrong, it may also be possible for the business, through the use of
budget variance reports, to distinguish between those variances that are outside the con-
trol of the divisional manager and those that are within the manager’s control. Divisional
managers would then be accountable only for the variances within their control. It is not
always easy, however, to obtain unbiased information for preparing budgets from divisional
managers when they know that such information will be used to evaluate their performance.
Management perks may be controlled by central management by setting out clear
rules as to what is acceptable. To some extent, observing the behaviour and actions of
divisional managers can reveal departures from the rules. Many perks, such as luxury cars,
chauffeurs and large offices, are highly visible. Central management should be alert to any
signs that divisional managers are rewarding themselves in this way.
Duplication of effort in certain areas can be extremely costly. For this reason, some
businesses prefer particular functions, such as administration, accounting, research and
development and marketing, to be undertaken by central staff rather than at the divisional
level. Again, this means that divisional managers will have to sacrifice some autonomy for
the sake of the performance of the business overall.
Activity 10.2 continued
M10_ATRI3622_06_SE_C10.QXD 5/29/09 10:41 AM Page 372
Household Appliances
Divisional Income Statement for last year
£000
Sales revenue 980
Variable expenses (490)
Contribution 490
Controllable divisional fixed expenses (130)
Controllable profit 360
Non-controllable divisional fixed expenses (150)
Divisional profit before common expenses 210
Apportioned cost of common expenses (80)
Divisional profit (loss) for the period 130
Before looking at the various measures of profit, we should be clear that the words
‘controllable’ and ‘non-controllable’ in this income statement refer to the ability of the
divisional manager to exert an influence over particular expenses. Thus, an expense
that is authorised by a senior manager at head office will not be under the control of
the divisional manager, despite the fact that the expense may relate to the division. An
expense that arises directly from a decision taken by the divisional manager, on the
other hand, is controllable at divisional level.
As is implied by this income statement for the division, there are four measures of
profit that could be used to assess performance. These are: contribution; controllable
profit; divisional profit before common expenses; and divisional profit for the period.
Contribution
The first measure of profit is the contribution, which represents the difference between
the total sales revenue of the division and the variable expenses incurred. We considered
this measure at length in Chapter 3. There we saw that it can be a useful measure for
gaining an insight into the relationship between costs, output levels and profit.
Assume that you are the chief executive of a divisionalised business. Would you use
contribution as a primary measure of divisional performance?
This measure has its drawbacks for this purpose. The most important drawback is that
it only takes account of variable expenses and ignores any fixed expenses incurred. This
means that not all aspects of operating performance are considered.
Activity 10.3
Assume now that you are a divisional manager. What might you be encouraged to do
if the contribution were used to assess your performance?
As variable expenses are taken into account in this measure and fixed expenses are
ignored, it would be tempting to arrange things so that fixed expenses rather than variable
expenses are incurred wherever possible. In this way, the contribution will be maximised.
For example, you may decide, as divisional manager, to employ less casual labour and to
use machines to do the work instead (even though this may be a more expensive option).
Activity 10.4
MEASURING DIVISIONAL PROFIT
373
M10_ATRI3622_06_SE_C10.QXD 5/29/09 10:41 AM Page 373
CHAPTER 10 MEASURING PERFORMANCE
374
Controllable profit
The second measure of profit is the controllable profit, which takes account of all
expenses that are within the control of divisional managers in arriving at a measure
of performance. Many view this as the best measure of performance for divisional
managers, as they will be in a position to determine the level of expenses incurred.
However, in practice, it may be difficult to categorise costs as being either controllable
costs or non-controllable costs. Some expenses may be capable of being influenced by
divisional managers, yet not be entirely under their control.
Depreciation can be one example of such an expense. The divisional manager may
be required to purchase a particular type of computer hardware so that the informa-
tion systems of the division are compatible with the systems used throughout the busi-
ness. The manager may, however, have some discretion over how often the hardware
is replaced, as well as over the purchase of particular hardware models that perform
beyond the requirement standards needed for the business. By exercising this discretion,
the depreciation charge for the year will be different from the one that would arise if
the manager stuck to the minimum standards laid down by central management.
Divisional profit before common expenses
The third measure of profit is divisional profit before common expenses, which takes
account of all divisional expenses (controllable and non-controllable) that are incurred
by the division. This provides us with a measure of how the division contributes to the
overall profits of the business.
Which one of the three measures that we have discussed so far is most useful for
evaluating the performance of divisional managers, and which for evaluating the per-
formance of divisions?
It can be argued that the performance of divisional managers should be judged on the
basis of those things that are within their control. Hence, the controllable profit would be
the most appropriate measure to use. The contribution measure does not take account of
all the expenses that are controllable by divisional managers, whilst the divisional profit
before common expenses takes account of some expenses that are not under the control
of divisional managers. The latter measure, however, may be appropriate for evaluating
the performance of the division, as it deducts all divisional expenses from the divisional
revenues earned. It is a fairly comprehensive measure of divisional achievement.
Activity 10.5
Divisional profit for the period
The final measure of profit is divisional profit for the period, which is derived after
deducting a proportion of the common expenses incurred for the period. The expenses
apportioned to each division will presumably represent what central management
believes to be a fair share of the total common expenses incurred. These expenses
will typically include such things as marketing, personnel, accounting, planning,
information technology and research and development expenses. In practice, the
‘
‘
M10_ATRI3622_06_SE_C10.QXD 5/29/09 10:41 AM Page 374
way that these apportionments are made between divisions can be extremely conten-
tious. Some divisional managers may be convinced that they have been apportioned
an unfair share of the common expenses. They may also believe that the divisions are
being loaded with expenses over which they have little control and that the divisional
profit figure derived will not truly represent the achievements of the division. These
are often compelling arguments for not apportioning common expenses to the various
divisions.
Can you think of any arguments for apportioning common expenses to divisions?
The business as a whole will only make a profit after all common expenses have been cov-
ered. Apportioning these expenses to the divisions should help make divisional managers
more aware of this fact. In addition, top management may wish to compare the results of
the division with the results of similar businesses in the same industry that are operating
as independent entities. By apportioning common expenses to the divisions, a more valid
basis for comparison is provided. Independent businesses will have to bear these kinds of
expenses before arriving at their profit for the period. The effect of apportioning common
expenses may also help to impose an element of control over these expenses. Divisional
managers may put pressure on top managers to keep common expenses low so as to
minimise the adverse effect on divisional profits.
Activity 10.6
Real World 10.3 sheds some light on the amount of common expenses assigned to
divisions.
REAL WORLD 10.3
Something in common
Drury and El-Shishini conducted a survey of 124 senior financial managers of divisionalised
businesses within the manufacturing sector. They found that nearly all managers (95 per
cent) stated that the divisions used common resources such as marketing, personnel,
accounting and so on. The survey asked those managers to state the approximate cost of
using these resources as a percentage of annual divisional sales revenue. Figure 10.3 sets
out the findings.
We can see that the costs of using common resources tend to be fairly low. The rea-
sons for this are not entirely clear. One possible explanation is that highly decentralised
businesses tend to have divisions that are self-reliant. Hence, the level of dependence on
common resources will be low. Another possible explanation is that businesses with a
large number of divisions have a greater opportunity to spread the costs of common
resources among the various divisions. The study found, however, little or no evidence to
support these explanations.
MEASURING DIVISIONAL PROFIT
375
‘
M10_ATRI3622_06_SE_C10.QXD 5/29/09 10:41 AM Page 375
CHAPTER 10 MEASURING PERFORMANCE
376
Divisional profit, by itself, is an inadequate measure of divisional performance. Some
account must be taken of the investment in assets required to generate that profit. Two
well-established measures of divisional performance that do this are
l return on investment (ROI), and
l residual income (RI).
We shall deal with both of these measures in turn.
Return on investment (ROI)
Return on investment (ROI) is a well-known method of assessing the profitability of
divisions. The ratio is calculated in the following way:
ROI
== ××
100%
When defining divisional profit for this ratio, the purpose for which the ratio is to
be used must be considered. For evaluating the performance of a divisional manager,
the controllable profit is likely to be the most appropriate, whereas for evaluating
the performance of a division, the divisional profit for the period is likely to be
more appropriate. Various definitions can be used for divisional investment. The total
Divisional profit
Divisional investment (assets employed)
Divisional performance measures
‘
Real World 10.3 continued
Common costs as a percentage of divisional annual
sales revenue
Figure 10.3
Common costs represent 10 per cent or less of the annual sales revenue of a division for
nearly three-quarters of respondents.
Source: Drury, C. and El-Shishini, E., ‘Divisional performance measurement: an examination of potential explanatory factors’,
CIMA Research Report, August 2005, p. 32.
M10_ATRI3622_06_SE_C10.QXD 5/29/09 10:41 AM Page 376
assets (non-current assets plus current assets) or the net assets (non-current assets
plus current assets less current liabilities) figure may be used. In addition, non-current
assets may be shown at their historic cost, or their historic cost less accumulated depre-
ciation, or on some other basis, such as current market value.
It is important that, whichever definitions of divisional profit and investment are
used, there is absolute consistency. It could be very misleading to try to compare the
ROIs of two different divisions using one set of definitions for one division and another
set for the other division.
The ROI ratio can be broken down into two main elements. These are:
ROI =×
This separation into the two main elements is useful, because it shows that ROI
is determined by both the profit margin on each £ of sales revenue and the ability to
generate a high level of sales revenue in relation to the investment base.
Sales revenue
Divisional investment
Divisional profit
Sales revenue
The following data relate to the performance and position of two operating divisions
that sell similar products:
Kuala Lumpur Singapore
Division Division
£000 £000
Sales revenue 300 750
Divisional profit 30 25
Divisional investment 600 500
What observations can you make about the performance of each division?
First, the ROIs for both divisions are identical at 5 per cent a year (that is, 30/600 and
25/500). The information shows, however, that the divisions appear to be pursuing differ-
ent strategies. The profit margins for the Kuala Lumpur and Singapore Divisions are 10 per
cent (that is, 30/300) and 3.3 per cent (that is, 25/750) respectively. The sales revenue to
divisional investment ratios for the Kuala Lumpur and Singapore Divisions are 50 per cent
(that is, 300/600) and 150 per cent (that is, 750/500) respectively. Thus, we can see that
the Kuala Lumpur Division prefers to sell goods at a higher profit margin than the
Singapore Division, resulting in lower sales revenue to assets employed.
Activity 10.7
ROI is a measure of profitability, as it relates profits to the size of the investment made
in the division. This relative measure allows comparisons between divisions of differ-
ent sizes. However, ROI has its drawbacks. Where it is used as the primary measure of
performance for divisional managers, there is a danger that it will lead to behaviour
that is not really consistent with the interests of the business overall.
DIVISIONAL PERFORMANCE MEASURES
377
Russell Francis plc has two divisions, both selling similar products but operating in dif-
ferent geographical areas. The Wessex Division reported a £200,000 controllable profit
from a divisional investment of £1m and the Sussex Division a £150,000 controllable
profit from a divisional investment of £500,000.
Activity 10.8
‘
M10_ATRI3622_06_SE_C10.QXD 5/29/09 10:41 AM Page 377
CHAPTER 10 MEASURING PERFORMANCE
378
A further disincentive to invest can result where the divisional investment in assets
is measured in terms of the original cost less any accumulated depreciation to date
(that is, written-down value or net book value). Where depreciation is being charged
each year, the written-down value of the divisional investment will be reduced.
Provided that profit stays at the same level, this means that ROI will climb during the
lifetime of the depreciating assets.
To illustrate this point consider Example 10.1.
The following are the profits and investment for a division over a four-year
period:
Year Divisional Divisional ROI at net
profit investment book value
££%
1 30,000 200,000 15.0
2 30,000 180,000 16.7
3 30,000 160,000 18.8
4 30,000 140,000 21.4
The investment is an item of equipment that cost £200,000 at the beginning of
Year 1. It is being depreciated at the rate of 10 per cent of cost each year.
Example 10.1
The divisional manager of each division has the opportunity to invest £200,000 in
the development of a new product line that will boost controllable profit by £50,000. The
minimum acceptable ROI for each division is 16 per cent a year.
Which operating division has been the more successful? How might each divisional
manager react to the new opportunity?
Although the Wessex Division has achieved a higher profit in absolute terms, it has a
lower ROI than the Sussex Division. The ROI for Wessex is 20 per cent a year (that is,
£200,000/£1,000,000) compared with 30 per cent (that is, £150,000/£500,000) for the
Sussex Division. Using ROI as the measure of performance, the Sussex Division is there-
fore the better-performing division.
The ROI from the new investment is 25 per cent a year (that is, £50,000/£200,000).
Thus, by taking on this investment, the divisional manager of Wessex will increase the
ROI of the division, which currently stands at 20 per cent a year. However, the divisional
manager of Sussex will reduce the ROI of the division by taking this opportunity as its ROI
is below the overall ROI of 30 per cent a year for the division.
If ROI is used as the primary measure of divisional performance, the divisional manager
of Sussex may decline the opportunity for fear that a reduction in divisional ROI will reflect
poorly on performance. However, the return from the opportunity is 25 per cent a year,
which comfortably exceeds the minimum ROI of 16 per cent a year. So failure to exploit
the opportunity will mean the profit potential of the division is not fully realised.
This activity illustrates the problems that can arise when using comparative measures,
such as percentages.
Activity 10.8 continued
M10_ATRI3622_06_SE_C10.QXD 5/29/09 10:41 AM Page 378
Residual income (RI)
The weaknesses of the ROI method, particularly the fact that it ignores the cost of
financing a division, has led some businesses to search for a more appropriate measure
of divisional performance. An alternative measure is that of residual income (RI). RI is
the amount of income, or profit, generated by a division, which is in excess of the min-
imum acceptable level of income. If we assume that the objective of the business is to
increase owners’ (shareholders’) wealth, the minimum acceptable level of income to be
generated is the amount necessary to cover the cost of capital.
Taking the divisional profit figure and then deducting an imputed charge for the
capital invested gives the RI. Example 10.2 should make the process clear.
We can see that the ROI increases over time simply because the investment base
is shrinking. This is despite the fact that it is the same equipment, generating as
much profit. We saw above that divisional managers may be discouraged from
investing in further assets where the ROI is below the existing ROI for the divi-
sion. In this example, the divisional manager would probably be reluctant to
replace the equipment and expose the division to a 15 per cent ROI. This would
be the case even though the need for new investment is likely to increase as the
existing equipment becomes fully depreciated.
How might the problem caused by ROI being boosted simply through a reduction in the
investment base, as in Example 10.1, be dealt with?
One way around the problem would be to keep the investment in assets at original cost
and not to deduct depreciation for purposes of calculating ROI. However, non-current
assets normally lose their productive capacity over time, and this fact should really be
recognised. Another way around the problem is to use some measure of current market
value, such as replacement cost, for the investment in assets. However, there may be
problems in establishing current values for some assets.
Activity 10.9
A division produced a profit of £100,000 and there was a divisional investment
of £600,000 with a cost of financing this investment of 15 per cent a year. The
residual income would be as follows:
£
Divisional profit 100,000
Charge for capital invested
(15% × £600,000) (90,000)
Residual income 10,000
Example 10.2
DIVISIONAL PERFORMANCE MEASURES
379
‘
M10_ATRI3622_06_SE_C10.QXD 5/29/09 10:41 AM Page 379
CHAPTER 10 MEASURING PERFORMANCE
380
A positive RI, as in Example 10.2, means that the division is generating returns in
excess of the minimum requirements of the business. The higher these excess returns,
the better the performance of the division.
Does this measure seem familiar to you? Where have we discussed a similar measure
to this earlier in the book?
This measure is based on the same idea as the EVA
®
measure that we discussed in
Chapter 9. We shall consider this point in more detail a little later in the chapter.
Activity 10.10
Simonson Pharmaceuticals plc operates the Helena Beauty Care Division, which has
reported the following results for last year:
Divisional investment £2,000,000
Divisional profit £300,000
The division has the opportunity to invest in a new product. This will require an addi-
tional investment in non-current assets of £400,000 and is expected to generate addi-
tional profits of £50,000 a year. This business has a cost of capital of 12 per cent a year.
Try calculating the residual income of the division for last year. Do you believe that
the division should produce the new product? How do you think that the divisional
manager might react to the new product opportunity if ROI were used as the means of
evaluating performance?
The residual income for last year is:
£000
Divisional profit 300
Charge for capital invested
(12% × £2,000,000) (240)
Residual income 60
The residual income expected from the new product is:
£000
Additional divisional profit 50
Charge for additional capital
(12% × £400,000) (48)
Residual income 2
The residual income is positive and, therefore, it would be worthwhile to produce the new
product.
The ROI of the division for last year was 15 per cent a year (that is, £300,000/£2m).
However, the new product is only expected to produce an ROI of 12.5 per cent a year
(that is, £50,000/£400,000). The effect of producing the new product will be to reduce the
overall ROI of the division (assuming similar results from the existing activities next year).
The divisional manager may, therefore, reject the new investment opportunity, despite the
fact that acceptance would enhance the owners’ (shareholders’) wealth. The new product
would cover all of the costs, including the cost of financing the investment.
Activity 10.11
M10_ATRI3622_06_SE_C10.QXD 5/29/09 10:41 AM Page 380
Looking to the longer term
A problem of both ROI and RI is that divisional managers may focus on short-term
divisional performance at the expense of the longer term. There is a danger that
investment opportunities will be rejected because they reduce short-term ROI and
RI, even though over the longer term they have a positive NPV. This is illustrated in
Example 10.3.
A division is faced with an investment opportunity that will require an initial
investment of £90,000 and produce the following operating cash flows (operating
profit before depreciation) over the next five years:
Year £
1 18,000
2 18,000
3 25,000
4 50,000
5 60,000
Assuming a cost of capital of 16 per cent a year, the NPV of the project will be:
Year Cash flows Discount factor Present value
£ @ 16% £
1 18,000 0.862 15,516
2 18,000 0.743 13,374
3 25,000 0.641 16,025
4 50,000 0.552 27,600
5 60,000 0.476 28,560
101,075
Initial investment (90,000)
Net present value 11,075
This indicates that the NPV is positive and, therefore, it would be in the share-
holders’ interests to undertake the project.
To calculate ROI and RI, we need to derive the divisional profit for each year
(that is, deduct a charge for depreciation from the operating cash flows shown
above). Assuming that depreciation is charged equally over the life of the assets
acquired and there is no residual value for the assets, the annual depreciation
charge will be £18,000 (that is, £90,000/5).
After deducting an annual depreciation charge, the divisional profit for each
year will be as follows:
Year £
1 zero
2 zero
3 7,000
4 32,000
5 42,000
Example 10.3
DIVISIONAL PERFORMANCE MEASURES
381
M10_ATRI3622_06_SE_C10.QXD 5/29/09 10:41 AM Page 381
CHAPTER 10 MEASURING PERFORMANCE
382
Various approaches have been proposed in an attempt to avoid the kind of problem
described above. It has been suggested, for example, that for the purpose of calculating
divisional ROI and RI, the assets employed in the project should not be included in the
divisional investment base until the project is fully established and generating good
returns.
Calculate the ROI and RI for each of the five years of the project’s life. (Base the ROI
calculation on the cost of the assets concerned.)
The ROI for the project will be as follows:
Year £ ROI
%
1 zero/90,000 zero
2 zero/90,000 zero
3 7,000/90,000 7.8
4 32,000/90,000 35.6
5 42,000/90,000 46.7
The RI will be as follows:
Year Divisional profit Capital charge RI
£££
1 zero 14,400* (14,400)
2 zero 14,400 (14,400)
3 7,000 14,400 (7,400)
4 32,000 14,400 17,600
5 42,000 14,400 27,600
9,000
* The capital charge is 16% × £90,000 = £14,400.
Activity 10.12
What do you deduce from the calculations resulting from Activity 10.12?
We can see that, in the early years, the ROI and RI calculations do not produce good
results, though the situation is reversed in later years. For the first two years the ROI is
zero and for the first three years the RI is negative. Divisional managers may, therefore,
be discouraged from making investments if they feel that central management would view
the results in the early years unfavourably. Given the results of the NPV analysis, however,
the managers would not be acting in the shareholders’ best interests in rejecting the
proposal.
Note, however, that the RI of the project overall is positive and so provides a result that
is consistent with the NPV result, over the five years.
Activity 10.13
M10_ATRI3622_06_SE_C10.QXD 5/29/09 10:41 AM Page 382
Comparing performance
Assessing divisional performance requires some benchmark against which we can
compare the chosen measure(s). There are various bases for comparison available,
including:
l Other divisions within the business. Comparing different divisions within the same
business, however, may not be very useful where the divisions operate in different
industries. Different types of industries have different levels of risk and this in turn
produces different expectations concerning acceptable levels of return. (See pp. 270–
272 in Chapter 8.)
l Previous performance of the division. It is possible to compare current performance
with previous performance to see whether there has been any improvement or
deterioration. However, it is often necessary to compare performance against some
external standard in order to bring to light operating inefficiencies within the divi-
sion. Also, the economic environment in previous periods may be different from the
current environment and so may invalidate comparisons of this nature.
l Similar businesses within the same industry. The performance of similar divisions of
other businesses, or whole businesses operating within the same industry, may pro-
vide a useful basis for comparison. However, there are often problems associated
with this basis. We shall come back to this in Activity 10.14.
l Budgeted (target) performance. This should be the best basis for comparison because
achievement of the budget should lead the division, and the business as a whole,
towards its strategic objectives. In setting the budget, performances elsewhere in the
business, previous levels of performance by the division and the performance of
competitors may well be considered. Ultimately, however, it is against what the
division has planned for that its actual performance should be assessed.
What problems are we likely to come across, in practice, when seeking to compare the
performance of a particular division with a similar division of another business, or a
whole business entity?
We may encounter a number of problems such as:
l Obtaining the information required. This is particularly true for a division within another
business. This information may not be available to those outside the business.
l Differences in accounting policies. Different approaches to such matters as depreciation
methods and inventories valuation methods may result in different measures of profit.
l Differences in asset structure. The different age of non-current assets employed, the
decision to rent rather than buy particular assets and so on, may result in differences in
the measures derived.
Activity 10.14
EVA
®
REVISITED
383
We saw in the previous chapter that EVA
®
measures the amount of wealth that has
been created for the owners (shareholders). We may recall that it is based on the
following formula:
EVA
®
revisited
M10_ATRI3622_06_SE_C10.QXD 5/29/09 10:41 AM Page 383
CHAPTER 10 MEASURING PERFORMANCE
384
EVA
®
= NOPAT − (R × C)
where
NOPAT = net operating profit after tax
R = required returns of investors (that is, cost of financing)
C = capital invested (that is, the net assets).
This measure, though not specifically designed for assessing divisional performance,
may nevertheless be used for this purpose.
There are clear similarities between EVA
®
and RI. Both recognise that, in economic
terms, profit can only be said to have been made after all costs, including financing
costs, have been taken into account. Hence, a charge for capital invested should be
made. When comparing the two measures, it is tempting to think that there is no real
difference between them. However, EVA
®
is a more rigorous measure. The various ele-
ments in the EVA
®
equation (net operating profit after tax, required returns of investors
and net assets) are defined more clearly and in such a way that there is an unambigu-
ous link between EVA
®
and wealth creation. This is not necessarily the case with RI.
Real World 10.4 provides some insights as to what senior managers consider import-
ant when evaluating the performance of divisional managers. It seems that, whatever
the theoretical appeal of EVA
®
, it is not widely used for this purpose.
REAL WORLD 10.4
Ranking the measures
In their survey of senior financial managers of 124 divisionalised businesses within the
manufacturing sector, referred to in Real World 10.3, Drury and El-Shishini asked the
managers to rank in order of importance the three measures that they considered most
important for evaluating managerial performance. The results are set out below.
Financial measure Most Second most Third most
important important important
ranking ranking ranking
Managers Managers Managers
Number % Number % Number %
l Achievement of a target
rate of return on capital
employed (ROI) 9 7.3 21 18.1 41 41.0
l A target profit after
charging interest on
capital employed (RI) 18 14.5 11 9.5 5 5.0
l A target profit before
charging interest on
capital employed 68 54.8 23 19.8 5 5.0
l A target economic value
added (EVA
®
) figure 11 8.9 8 6.9 10 10.0
l A target cash flow figure 10 8.1 45 38.8 27 27.0
l Other 8 6.4 8 6.9 12 12.0
124 100.0 116 100.0 100 100.0
M10_ATRI3622_06_SE_C10.QXD 5/29/09 10:41 AM Page 384
We can see that target profit before charging interest on capital employed was by far the
most popular measure. Although ROI and RI are well-known measures, neither were fre-
quently cited as the most important measure by senior financial managers. The limited
support for target EVA
®
may be partially due to the fact that it is a relatively new measure.
Source: Drury, C. and El-Shishini, E., ‘Divisional performance measurement: an examination of potential explanatory factors’, CIMA
Research Report, August 2005, p. 30.
Andromeda International plc has two operating divisions, the managers of which are given
considerable autonomy. To assess the performance of divisional managers, senior
management uses ROI. For the purposes of this measure the assets employed include
both non-current and current assets. The business has a minimum acceptable ROI of
15 per cent a year and uses the straight-line method of depreciation for external reporting
purposes.
Extracts from the budgets for each of the two divisions for next year are as follows:
Jupiter division Mars division
£000 £000
Divisional profit 260 50
Non-current assets at cost 940 1,200
Current assets 390 180
Since the budgets were prepared, two investment opportunities have been brought to the
attention of the relevant divisional managers. These are as follows:
1 Senior management would like to see the productivity of the Mars division improve.
To help achieve this, they have authorised the divisional manager to buy some new
equipment costing £300,000. This will have a life of five years and will lead to operat-
ing savings of £90,000 each year.
2 A new product can be sold by the Jupiter division. This will increase sales revenue by
£250,000 each year over the next five years. It will be necessary to increase marketing
costs by £60,000 a year and inventories held will increase by £90,000. The contribution
margin ratio (that is, contribution to sales revenue × 100%) for the new product will be
30 per cent.
Required:
(a) Calculate the expected ROI for each division assuming:
1 the investment opportunities are not taken up,
2 the investment opportunities are taken up.
(b) Comment on the results obtained in (a) and state how the divisional managers and
senior managers might view the investment opportunities.
(c) Discuss the implications of using net book value (that is, after accumulated deprecia-
tion) rather than gross book value (that is, before accumulated depreciation) as a basis
for valuing non-current assets when calculating ROI.
The answer to this question can be found in Appendix B at the back of the book.
Self-assessment question 10.1
EVA
®
REVISITED
385
M10_ATRI3622_06_SE_C10.QXD 5/29/09 10:41 AM Page 385
Sometimes, a division will sell goods or services to another division within the same
business. For example, a brick-manufacturing division may sell its products to a house-
building division. The price at which transfers between divisions are made can be an
important issue. Setting prices for inter-divisional trading is known as transfer pricing.
For the division providing the goods or service, transfers represent part, or possibly all,
of its output. If the performance of the division is to be measured in a meaningful way,
the division should be credited with ‘sales revenue’ for these goods or services trans-
ferred. Failure to do so would mean that it would have to bear the expenses of creating
the goods or service, but would receive no credit for doing so. By the same token, the
receiving (buying) division needs to be charged with the expense of using the goods or
service supplied by the other division, if its performance is to be measured in any
meaningful way.
Where inter-divisional transfers represent a large part of the total sales or purchases
of a division, transfer pricing is a very important issue. Small changes in the transfer
price of goods or services can result in large changes in profits for the division con-
cerned. As divisional managers are often assessed (and partially remunerated) accord-
ing to the profits generated by their division, setting transfer prices may be a sensitive
issue between divisional managers.
Whilst the particular transfer prices used will affect the profits of individual divi-
sions, the profits of the business as a whole should not be directly affected. An increase
in the transfer price of goods or services will lead to an increase in the profits of the
selling division, which is normally cancelled out by the decrease in profits of the buy-
ing division. However, the transfer prices set between divisions can indirectly lead to a
loss of profits to the business as a whole. This is because the level at which they are set
may encourage a divisional manager to take actions that would benefit the division but
not the business as a whole. For example a divisional manager may choose to buy a
particular product or service from an outside supplier because it is cheaper than the
established internal transfer price. In such a situation, the profits of the business as a
whole may be adversely affected.
Transfer pricing
CHAPTER 10 MEASURING PERFORMANCE
386
‘
In what circumstances would the business as a whole not be less profitable, if one divi-
sion chooses to buy from an external supplier rather than from an internal source?
If the internal supplying division is able to sell in the external market
l the same quantity as were bought externally by the buying division; and
l at the same price as the internal division bought at,
the business as a whole will not be worse off.
Activity 10.15
The objectives of transfer pricing
Transfer pricing may help to achieve various objectives. In particular, setting appro-
priate transfer prices may help in promoting the following:
M10_ATRI3622_06_SE_C10.QXD 5/29/09 10:41 AM Page 386
l The independence of divisions. By allowing divisional managers to set their own trans-
fer prices, and by allowing other divisions to decide whether or not to trade at the
prices quoted, the autonomy of individual divisions is encouraged. This, in turn,
should help motivate divisional managers.
l The assessment of divisional performance. Inter-divisional sales will contribute to total
revenues for a division, which in turn influence divisional profit. Setting an ap-
propriate transfer price can, therefore, be important in deriving a valid measure
of divisional profit for evaluation purposes. This should be of value in helping to
establish incentives for, and promoting accountability of, divisional managers.
l The optimisation of profits for the business. Transfer prices may seek to optimise profits
for the business as a whole. For example, a division may be prevented from quoting
a transfer price for goods that will make buying divisions seek cheaper sources of
supply from outside the business.
l The allocation of divisional resources. Transfer prices will be important in determining
the level of output for particular goods and services. The level of return from inter-
divisional sales can be important in deciding on the level of sales and investment
relating to a particular product, or group of products.
l Tax minimisation. Where a business has operations in various countries, it may be
beneficial to set transfer prices such that the bulk of profits are reported in divisions
where the host country has low tax rates. However, tax laws operating in many
countries will seek to prevent this kind of profit manipulation.
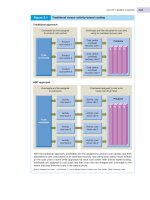
These objectives for transfer pricing are summarised in Figure 10.4.
TRANSFER PRICING
387
Objectives of transfer pricing
Figure 10.4
Is there a conflict between any of the transfer-pricing objectives identified above? If so,
can a single transfer price help achieve all these objectives?
It is quite possible for there to be a conflict between the objectives identified. Thus, a sin-
gle transfer price is unlikely to achieve all the stated objectives. To optimise the profits for
the business as a whole, for example, transfer prices may have to be imposed centrally,
which would undermine the autonomy of divisions. In addition, a centrally imposed trans-
fer price may result in inter-divisional sales at artificially low prices, which would disad-
vantage particular divisions. It may also result in reported profit figures in both the buying
and selling divisions becoming meaningless as measures of achievement.
Activity 10.16
M10_ATRI3622_06_SE_C10.QXD 5/29/09 10:41 AM Page 387
Transfer pricing and tax mitigation
We saw above that transfer prices may be used to reduce the tax liabilities of businesses
with international operations. It is often claimed that many of these businesses adopt
novel transfer pricing policies, combined with complex organisational structures, to
ensure that profits are reported in those countries where tax rates are low. Where there
are doubts over the legality of these complicated manoeuvres, the tax authorities must
try to unravel them.
Real World 10.5 provides an example of where disappointing tax levies from large
businesses has led to the finger of suspicion being pointed at transfer pricing.
CHAPTER 10 MEASURING PERFORMANCE
388
Tax authorities in various countries are trying to stamp out transfer pricing abuses.
Investigations of transfer pricing policies of individual businesses are becoming more
common and cross-border co-operation between tax authorities has increased.
Information is exchanged and treaties are signed which set out transfer pricing rules
that businesses are expected to follow.
Real World 10.6 suggests that the efforts of the various tax authorities have had
some effect.
REAL WORLD 10.6
The tax man cometh
The 2007/8 transfer pricing survey carried out by Ernst and Young covered 850 large inter-
national businesses in 24 different countries. It found that nearly 40 per cent of all respond-
ents considered transfer pricing to be their most important tax issue. Furthermore, 52 per
cent of all respondents had been subjected to an examination of their transfer pricing
policies since 2003, resulting in 27 per cent having their transfer prices adjusted by the
tax authorities.
Source: ‘Global transfer pricing survey 2007–2008: global pricing trends, practices and analysis’, Ernst and Young, 2008.
REAL WORLD 10.5
A taxing issue
A majority of large businesses operating in the US reported no tax liability for at least
one year between 1998 and 2005, according to a study released by the Government
Accountability Office yesterday.
The finding could raise pressure on the US authorities to crack down more aggressively
on abuses of transfer pricing – the price that units of the same company charge each other
for internal transactions.
A number of senior US legislators have pointed to transfer-pricing violations as the
vehicle by which companies have been shifting profits abroad and leaving US divisions
with little or no tax liability.
Source: Transfer pricing abuses criticised, ft.com (Politi, J.), © The Financial Times Limited, 13 August 2008.
FT
M10_ATRI3622_06_SE_C10.QXD 5/29/09 10:41 AM Page 388
It is, perhaps, worth mentioning that not all tax authorities have the resources and
expertise to investigate what can be complex and opaque practices. Developing countries,
for example, may find it hard to mount a serious challenge to transfer pricing abuses.
Transfer pricing policies
There are various approaches to setting a transfer price for goods and services between
divisions. In this section we shall explore some of the major approaches. Before doing
this, however, it is worth identifying the principle that the best transfer price is one
based closely on the opportunity cost of the goods or services concerned. The oppor-
tunity cost represents the best alternative forgone. Thus, when examining the various
approaches, the extent to which they reflect the opportunity cost of the goods or ser-
vice should be the appropriate benchmark against which they are measured.
Market prices
Market prices are the prices that exist in the ‘outside’ market (that is, outside the busi-
ness whose divisions are involved in the transfer). Intuition may tell us that market
prices should be the appropriate method of setting transfer prices. Using this approach,
the transfer price is an objective, verifiable amount that has real economic credibility.
Where there is a competitive and active market for the products, the market price will
represent the opportunity cost of goods and services. For the selling division, it is the
revenue lost by selling to another division rather than to an outside customer. For the
buying division, it is the best purchase price available.
The market price, however, may not always be appropriate. Activity 10.17 illustrates
why.
TRANSFER PRICING
389
‘
Wolf Industries plc has an operating division that produces microwave ovens. The
ovens are normally sold to retailers for £120. The division is currently producing 3,000
ovens a month (which uses only about 50 per cent of the division’s manufacturing
capacity). The ovens have the following cost structure:
Cost for one oven
£
Variable cost 70
Fixed cost apportionment 20
Total cost 90
Another division of the business has offered to buy 2,000 ovens for £75 each. How
would you respond to such an offer if you were manager of the division making the
microwave ovens?
Since the division is operating below capacity, basing the transfer price on market prices
may lead to lost sales. Other divisions within the business have no price incentive to
buy their microwave ovens internally. This may lead them to buy from outside sources
rather than from the selling division and this loss of sales will not be made good by sales
to outside customers.
Activity 10.17
‘
M10_ATRI3622_06_SE_C10.QXD 5/29/09 10:41 AM Page 389
A final point to consider when making inter-divisional transfers at market prices is
that the selling division may make savings owing to the fact that selling and distribu-
tion costs may be lower. In such a situation, part of these savings may be passed on to
the buying division in the form of lower prices. Thus, some adjustment may be made
to the market price of the goods being transferred.
CHAPTER 10 MEASURING PERFORMANCE
390
We saw in Chapter 3 that businesses may base selling prices on the variable cost of
the goods or services, rather than on the market price, where there is a short-term prob-
lem of excess capacity. Provided that the selling price exceeds the variable cost of
the goods or service, a contribution will be made towards the profits of the business. This
principle can equally be applied to divisions of businesses. Thus, in such circumstances,
a selling price somewhere between the variable cost of the product (£70) and the market
price (£120) may be the best price for divisional transfers.
Senior management could intervene to insist that the microwave ovens are bought
internally, but this would tend to undermine divisional autonomy and the right of divisions
to make their own decisions.
Activity 10.17 continued
Apart from the problems that we have just considered, there is another, perhaps more
fundamental, problem with trying to use market prices that we may come across in
practice. Can you think what it may be?
An external market may simply not exist. It may not be possible for the potential buying
division to identify external suppliers, and therefore an external price, for the particular
good or service required. Alternatively, there may be no potential external customer for the
selling division’s output. Particular goods or services may be so tailored to the needs of
the buying division that it is the only market available.
Activity 10.18
Variable cost
We have just seen that using variable cost is appropriate where the division is operat-
ing below capacity. In these particular circumstances, the opportunity cost to the sup-
plying division is not the market price. The division will not have to stop selling to the
market in order to supply its fellow division since there is a capacity to do both. In
these circumstances, the opportunity cost is equal to the variable cost of producing the
good or service. However, this represents an absolute minimum transfer price and a
figure above the variable cost is required for a contribution to be made towards fixed
costs and profit. Where the division is operating at full capacity and external customers
are prepared to pay above the variable cost of the goods, a variable-cost internal trans-
fer price would mean that inter-divisional sales are less profitable than sales to external
customers. Managers of the selling division would therefore have no incentive to agree
transfer prices on a strictly variable-cost basis (even though the business as a whole
may benefit). If top management imposed this pricing method, divisional autonomy
would be undermined.
‘
M10_ATRI3622_06_SE_C10.QXD 5/29/09 10:41 AM Page 390
Full cost
Transfers can be made at full cost. In such circumstances the selling division will make
no profit on the transactions. This can hinder an evaluation of divisional performance.
It will also lead to more difficulty in making resource allocation decisions concerning
the level of output, product mix and investment levels within the division, as profit
cannot be used as a measure of efficiency. It is possible to add a mark-up to the full cost
of the goods or services to ensure that the selling division makes a profit. However, the
amount of the mark-up must be justified in some way or it will become a contentious
issue between buying and selling divisions.
A cost-based approach (with or without the use of a mark-up) does not provide any
real incentive for managers of a selling division to keep costs down, since they can pass
the costs on to the buying division. This will result in selling divisions transferring
their operating inefficiencies to buying divisions. Where the mark-up is a percentage
of cost, the selling division’s profit will be higher if it incurs higher costs. On the other
hand, where buying divisions have the ability to go to outside suppliers, pressure can
be exerted on the selling divisions to control their costs. Although use of the full cost
approach is found in practice, it is not an approach that is particularly logical, since it
is not linked to the opportunity cost approach.
Transferring goods or services between divisions can be based on either a standard
(budgeted) cost or an actual cost approach. The case for using standard costs appears
to be the stronger.
TRANSFER PRICING
391
What are the arguments in favour of using standard (budgeted) costs rather than actual
costs?
Information relating to actual costs may not be available until after the transfer has taken
place, which can create planning problems for the buying division. By using standard
(budgeted) costs, this problem is overcome. It may also help to impose some discipline
on the selling division as adverse variances cannot be simply passed on to the buying
division. These arguments apply whether variable costs or full costs are being used as the
transfer price.
Activity 10.19
The way in which standards are set, however, will need to be closely monitored to
prevent the resulting transfer prices from becoming a contentious issue. The manager
of the buying division may be quick to point out that there is no incentive for the sell-
ing division to develop tight standards. Indeed, the opposite is true as loose standards
will make it easier to generate favourable variances.
Negotiated prices
It is possible to adopt an approach that allows the divisional managers to arrive at
negotiated prices for inter-divisional transfers. However, this can lead to serious dis-
putes, and where divisional managers are unable to agree a price, top management will
be required to arbitrate. This can be a time-consuming process and may deflect top
management from its more strategic role. Furthermore, divisional managers may resent
the decisions made by senior managers and see these as undermining the autonomy of
their divisions.
‘
‘
M10_ATRI3622_06_SE_C10.QXD 5/29/09 10:41 AM Page 391
Negotiated transfer prices probably work best where there is an external market for
the goods supplied by the buying and selling divisions and where divisional managers
are free to accept or reject offers made by other divisions. Under such circumstances,
the negotiated price is likely to be closely related to the external market price of the
products. In other circumstances, the negotiated prices may be artificial and mislead-
ing. For example, where a division sells the whole of its output to another division, the
selling division may be in a weak bargaining position and the transfer price agreed may
not provide a valid measure of divisional performance. Negotiated prices are likely to
be influenced by the negotiating skills of managers, which can be a problem where this
largely determines the outcome.
Figure 10.5 summarises the various approaches to transfer pricing that have been
discussed.
CHAPTER 10 MEASURING PERFORMANCE
392
Relationship between divisions and the external market
Figure 10.6
A division may sell part of its output to another division and part to the outside market.
Transfer pricing methods
Figure 10.5
Divisions with mixed sales
A division may sell part of its output to another division within the same business and
part to outside customers. For a business with only two divisions, the position will be
as set out in Figure 10.6.
M10_ATRI3622_06_SE_C10.QXD 5/29/09 10:41 AM Page 392
Activity 10.20 requires you to calculate the budgeted divisional profits for a business
with divisions that operate in the way illustrated above.
TRANSFER PRICING
393
Dorset Ltd has two operating divisions: Cornwall and Devon. Cornwall produces a very
high quality fabric that is used in making curtains. The budgeted cost of a square metre
of the fabric is made up as follows:
£
Variable cost
Labour 4
Material 7
11
Fixed cost
Overheads 13
Total cost 24
The budgeted output for Cornwall is 300,000 sq m each year and the market price for
the fabric is £30 per sq m.
Devon makes curtains and uses 1.1 sq m of this fabric to make 1 sq m of curtains.
The management of Dorset Ltd insists that Cornwall must sell to Devon as much of the
fabric as is required to meet its needs and any surplus output can then be sold to out-
side businesses. The management of Dorset Ltd also insists that Devon must buy all its
requirements for this fabric from Cornwall. The budgeted output for Devon is 200,000
sq m of curtains. Devon sells its output for £75 per sq m and, in addition to the cost of
the fabric, incurs fixed and variable costs totaling £35 per sq m at the budgeted output.
What will be the budgeted profit for each operating division, assuming a transfer pric-
ing policy based on
l variable cost
l full cost
l market price?
Comment on your findings.
For Cornwall, the budgeted profit under each transfer pricing policy will be:
Variable Full Market
cost cost price
£000 £000 £000
Revenue
Devon (200,000 × 1.1)
× £11 2,420
× £24 5,280
× £30 6,600
External market ([300,000 − (200,000 × 1.1)] × £30) 2,400 2,400 2,400
4,820 7,680 9,000
Costs
Variable (300,000 × £11) (3,300) (3,300) (3,300)
Fixed (300,000 × £13) (3,900) (3,900) (3,900)
Budgeted profit (loss) (2,380) 480 1,800
Activity 10.20
‘
M10_ATRI3622_06_SE_C10.QXD 5/29/09 10:41 AM Page 393
Differential transfer prices
There is no reason why, in respect of a particular inter-divisional transaction, there
cannot be two different transfer prices. It may be that setting the buying price, for the
buying division, at one value and the selling price, for the selling division, at a differ-
ent value, could lead to both divisions being encouraged to act in the best interests of
the business as a whole. This would mean that the overall profit for the business would
not equal the sum of the profits of the individual divisions, but this is not necessarily
a problem.
Real World 10.7 sets out transfer pricing guidelines for businesses operating in the
water industry.
CHAPTER 10 MEASURING PERFORMANCE
394
For Devon, the budgeted profit under each transfer pricing policy will be:
Variable Full Market
cost cost price
£000 £000 £000
Revenue
200,000 × £75 15,000 15,000 15,000
Costs
Fabric (200,000 × 1.1)
× £11 (2,420)
× £24 (5,280)
× £30 (6,600)
Other costs (200,000 × £35) (7,000) (7,000) (7,000)
Budgeted profit 5,580 2,720 1,400
We can see that Cornwall will make a significant loss under the variable cost policy.
Most of the division’s output must be sold to Devon and, whilst the surplus sold to the
external market makes a contribution, it is not enough to cover the fixed cost. Cornwall
manages to make a small profit under the full cost policy, which is entirely due to the sales
to the outside market. If there were no external sales, the division would simply break
even. When, however, transfer prices are set at market price, Cornwall makes a significant
profit.
For Devon, the situation is reversed. It makes a significant profit under the variable cost
policy but when fabric prices are increased under the full cost policy, and then further
increased under the market price policy, so the budgeted profit declines. Devon’s profits,
of course, are unaffected by Cornwall’s sales to outside businesses.
Activity 10.20 continued
M10_ATRI3622_06_SE_C10.QXD 5/29/09 10:41 AM Page 394
Real World 10.8 provides detail about the use of transfer pricing in UK manufac-
turing businesses. This survey evidence is now quite old, but there is no more recent
evidence of UK practice.
TRANSFER PRICING
395
REAL WORLD 10.7
Thinking water
To protect the interests of customers, the UK government regulates the activities of water
and sewerage businesses. Many of these businesses are part of a large group with diver-
sified operations, some of which are not regulated. The government regulator, Ofwat, must
therefore be assured that any transactions between the regulated water and sewerage
activities and other unregulated businesses are not to the disadvantage of customers of
the regulated activities. If, for example, water or sewerage services were charged to other
unregulated businesses at a price below cost, or services bought in from other businesses
were charged at a price above their market value, customers of the regulated water and
sewerage services might have to bear an unfair share of the costs of the business as a
whole.
To prevent this problem from occurring, the following transfer pricing guidelines are
in place:
l transfer prices for goods and services transferred from unregulated businesses to
regulated ones should be at market price or less;
l regulated businesses should market test to determine the market prices for works or
services to be transferred to unregulated businesses;
l transfer prices for transfers from unregulated to regulated businesses should be based
on full cost (direct costs plus indirect costs) for specialised services where no market
exists.
It is interesting to note that transfers of goods and services at cost may, at times, be
appropriate, as this can protect the interests of water customers.
Source: Guidelines for transfer pricing in the water industry: Regulatory accounting guideline 5.04, ofwat.gov.uk, March 2005.
REAL WORLD 10.8
Transfer pricing in practice
A survey by Drury and others of UK manufacturing businesses found that, amongst divi-
sionalised businesses, the approaches to setting transfer prices were as follows:
Approach used % of divisionalised
respondents
Variable cost 37 (2)
Full cost 42 (22)
Variable cost plus a profit mark-up 30 (11)
Full cost plus a profit mark-up 52 (27)
Market price 52 (33)
Negotiated price 70 (30)
Other methods 9 (1)
‘
M10_ATRI3622_06_SE_C10.QXD 5/29/09 10:41 AM Page 395
Transfer pricing and service industries
There is absolutely no reason why the item being transferred inter-divisionally need
be a physical object. A water company, for example, may have separate divisions for
services such as IT, scientific testing and customer relations, which then charge the
division providing water services for any work undertaken. The transfer pricing issues
raised above will equally apply under these circumstances.
For both divisions and businesses overall, managers increasingly use non-financial
measures to help assess performance. Non-financial measures can help managers to
cope with an uncertain environment: the greater the uncertainty of the environment,
the greater the extent to which non-financial measures are likely to be of value. This
is because they contribute to a broader and more complete range of information for
managers, which should, in turn, contribute to a more balanced assessment of per-
formance. It is, therefore, not surprising that these measures have taken on increasing
importance in recent years.
The reporting of non-financial measures can provide a useful counterweight to the
reporting of financial information. It is often the case that ‘the things that count are
the things that get counted’. That is, the degree of importance given to items will
depend on whether they are reported, irrespective of their real significance. Thus,
where managers receive reports based exclusively on short-term financial performance
measures, such as sales revenues and profits, these measures become the main focus of
attention. As a result, decisions may be made to enhance these reported performance
measures, and other aspects of the business may be ignored. The result is likely to be
to the detriment of the business. For example, to increase annual profit a decision may
be made to cut back on research and development costs, which may be vital to long-
term survival. In this kind of situation, reporting non-financial measures concerning
the quality and success of research and development would help to provide a more
complete picture.
Non-financial measures can also provide managers with insights that are difficult or
impossible to gain with purely financial ones. For example, customer satisfaction is
difficult to assess simply on the basis of financial values.
Non-financial measures of performance
CHAPTER 10 MEASURING PERFORMANCE
396
Real World 10.8 continued
It is clear from the table that, on average, businesses use more than one method. Some
of these percentages include ‘used rarely’ and ‘sometimes’. The bracketed figures are per-
centages of businesses that use the approach ‘often’ or ‘always’. For example, variable
cost is used by 37 per cent of respondents, but of those only 2 per cent of total respond-
ents used it ‘often’ or ‘always’.
Full cost, which has not too much credibility in theory, seems widely used. The more
theoretically respectable variable cost and the market-price-based approaches also seem
popular, as do negotiated prices.
Source: Drury, C., Braund, S., Osborne, P. and Tayles, M., A Survey of Management Accounting Practices in UK Manufacturing
Companies, Chartered Association of Certified Accountants, 1993.
M10_ATRI3622_06_SE_C10.QXD 5/29/09 10:41 AM Page 396