Tools for Business Decision Management Makers_12 doc
Bạn đang xem bản rút gọn của tài liệu. Xem và tải ngay bản đầy đủ của tài liệu tại đây (905.16 KB, 33 trang )
(b) Suggest three different non-financial measures of performance that may be appropriate
to an operating division and consider how such measures, in general, offer improvements
when used in conjunction with financial measures.
You have recently taken a management post in a large divisionalised business. A substantial
proportion of the business of your division is undertaken through inter-divisional transfers.
Required:
(a) What are the objectives of a system of transfer pricing?
(b) Describe the use of, and problems associated with, transfer prices based on
l variable cost; and
l full cost.
(c) Where an external market exists, to what extent is market price an improvement on cost?
The following information applies to the planned operations of Division A of ABC Corporation for
next year:
£
Sales revenue (100,000 units at £12) 1,200,000
Variable cost (100,000 units at £8) 800,000
Fixed cost (including depreciation) 250,000
Division A investment (at original cost) 500,000
The minimum desired rate of return on investment is the cost of capital of 20 per cent a year.
The business is highly profit-conscious and delegates a considerable level of autonomy to
divisional managers. As part of a procedure to review planned operations of Division A, a meet-
ing has been convened to consider two options:
Option X
Division A may sell a further 20,000 units at £11 to customers outside ABC Corporation. Variable
costs per unit will be the same as budgeted, but to enable capacity to increase by 20,000 units,
one extra piece of equipment will be required costing £80,000. The equipment will have a four-
year life and the business depreciates assets on a straight-line basis. No extra fixed costs will
occur.
Option Y
Included in the current plan of operations of Division A is the sale of 20,000 units to Division B
also within ABC Corporation. A competitor of Division A, from outside ABC Corporation, has
offered to supply Division B at £10 per unit. Division A intends to adopt a strategy of matching
the price quoted from outside ABC Corporation to retain the order.
Required:
(a) Calculate Division A’s residual income based on
1 the original planned operation
2 Option X only added to the original plan
3 Option Y only added to the original plan
and briefly interpret the results of the options as they affect Division A.
(b) Assess the implications for Division A, Division B and the ABC Corporation as a whole of
Option Y, bearing in mind that if Division A does not compete on price, it will lose the 20,000
units order from Division B. Make any recommendations you consider appropriate.
The following information applies to the budgeted operations of the Goodman division of the
Telling Company.
10.5
10.4
10.3
EXERCISES
405
M10_ATRI3622_06_SE_C10.QXD 5/29/09 10:41 AM Page 405
£
Sales revenue (50,000 units at £8) 400,000
Variable cost (50,000 units at £6) (300,000)
Contribution 100,000
Fixed cost (75,000)
Divisional profit for the period 25,000
Divisional investment 150,000
The minimum desired return on investment is the cost of capital of 20 per cent a year.
Required:
(a) (1) Calculate the divisional expected ROI (return on investment).
(2) Calculate the division’s expected RI (residual income).
(3) Comment on the results of (1) and (2).
(b) The division has the opportunity to sell an additional 10,000 units at £7.50. Variable cost per
unit would be the same as budgeted, but fixed costs would increase by £5,000. Additional
investment of £20,000 would be required. If the manager accepted this opportunity, by how
much and in what direction would the residual income change?
(c) Goodman expects to sell 10,000 units of its budgeted volume of 50,000 units to Sharp,
another division of the Telling Company. An outside business has promised to supply the
10,000 units to Sharp at £7.20. If Goodman does not meet the £7.20 price, Sharp will buy
from the outside business. Goodman will not save any part of the fixed cost if the work goes
outside, but the variable cost will be avoided completely.
(1) Show the effect on the total profit of the Telling Company if Goodman meets the £7.20
price.
(2) Show the effect on the total profit of the Telling Company if Goodman does not meet
the price and the work goes outside.
Glasnost plc is a large business organised on divisional lines. Two typical divisions are East
and West. They are engaged in broadly similar activities and, therefore, central management
compares their results to help it to make judgements on managerial performance. Both divisions
are regarded as investment centres.
A summary of last year’s financial results of the two divisions is as follows:
West East
£000 £000 £000 £000
Capital employed 2,500 500
Sales revenue 1,000 400
Manufacturing cost:
Direct (300) (212)
Indirect (220) (48)
Selling and distribution cost (180) (700) (40) (300)
Divisional profit 300 100
Apportionment of uncontrollable common
overhead costs (50) (20)
Profit for the period 250 80
At the beginning of last year, West division incurred substantial expenditure on automated
production lines and new equipment. East has quite old plant. Approximately 50 per cent of the
sales revenue of East comes from internal transfers to other divisions within the business. These
transfers are based on an unadjusted prevailing market price. The inter-divisional transfers of
West are minimal.
Management of the business focuses on return on investment as a major performance
indicator. The required minimum rate of return is the business’s cost of capital of 10 per cent
a year.
10.6
CHAPTER 10 MEASURING PERFORMANCE
406
M10_ATRI3622_06_SE_C10.QXD 5/29/09 10:41 AM Page 406
Required:
(a) Compute any ratios (or other measures) that you consider will help in an assessment of
the costs and performance of the two divisions.
(b) Comment on this performance, making reference to any matters that give cause for con-
cern when comparing the divisions or in divisional performance generally.
The University of Devonport consists of six faculties and an administration unit. Under the
university’s management philosophy, each faculty is treated, as far as is reasonable, as an inde-
pendent entity. Each faculty is responsible for its own budget and financial decision making.
A new course in the Faculty of Geography (FG) requires some input from a member of staff
of the Faculty of Modern Languages (FML).
The two faculties are in dispute about the ‘price’ that FG should pay FML for each hour of
the staff member’s time. FML argues that the hourly rate should be £97. This is based on the
FML budget for this year, which in broad outline is as follows:
£000
Academic staff salaries (45 staff) 1,062
Faculty overheads (nearly all fixed costs) 903
1,965
Each academic is expected to teach on average for 15 hours a week for 33 weeks a year.
FML wishes to charge FG an hourly rate which will cover the appropriate proportion of the
member of staff’s salary plus a ‘fair’ share of the overheads plus 10 per cent for a small surplus.
FG is refusing to pay this rate. One of FG’s arguments is that it should not have to bear any
other cost than the appropriate share of the salary. FG also argues that it could find a lecturer
who works at the nearby University of Tavistock and is prepared to do the work for £25 an hour,
as an additional, spare-time activity.
FML argues that it has deliberately staffed itself at a level which will enable it to cover FG’s
requirements and that the price must therefore cover the costs.
The university’s Vice-Chancellor (its most senior manager) has been asked to resolve the
dispute. You are the university’s finance manager.
Required:
Make notes in preparation for a meeting with the Vice-Chancellor, where you will discuss the
problem with her. The Vice-Chancellor is a historian by background and is not familiar with
financial matters. Your notes will therefore need to be expressed in language that an intelligent
layperson can understand.
Your notes should deal both with the objectives of effective transfer prices and with the
specifics of this case. You should raise any issues which you think might be relevant.
AB Ltd operates retail stores throughout the country. The business is divisionalised. Included in
its business are Divisions A and B. A centralised and automated warehouse that replenishes
inventories using computer-based systems supports the work of these divisions.
For many years AB Ltd has given considerable autonomy to divisional managers and has
emphasised return on investment (ROI) as a composite performance measure. This is calculated
after apportionment of all actual costs and assets of the business and ‘its appropriate service
facilities’, which includes the costs and assets of the warehouse.
The following information is available for last year:
Division A Division B
Actual Budget Actual Budget
£m £m £m £m
Sales revenue 30.0 50.0 110.0 96.0
Assets employed 20.0 48.0
Operating profit 4.3 14.7
10.8
10.7
EXERCISES
407
M10_ATRI3622_06_SE_C10.QXD 5/29/09 10:41 AM Page 407
These actual figures do not include the apportioned costs or assets of the automated ware-
house shared by the two divisions. The data available for the warehouse facility for last year are:
Warehouse
Actual Budget
£m £m
Despatches (that is, sales revenue) 140.0 146.0
Assets employed at book value 8.0 8.0
Operating cost:
Depreciation 1.6 1.6
Other elements of fixed cost 1.1 0.9
Variable storage cost 0.6 0.5
Variable handling cost 1.3 1.1
Total operating cost 4.6 4.1
When the warehouse investment was authorised it was agreed that the assets employed
and the actual expenses were to be apportioned between the divisions concerned in the pro-
portions originally agreed (50 per cent each). However, it was also pointed out that in the future
the situation could be redesigned and there was no need for one single basis to apply. For
example, the space occupied by inventories of the two divisions is now A 40 per cent and B
60 per cent. This information could be used in the apportionment of assets and expenses.
Required:
(a) (1) Calculate the actual return on investment (ROI) for Divisions A and B after incorporat-
ing the warehouse assets and actual costs apportioned on an equal basis as originally
agreed.
(2) What basis of apportionment of assets and actual costs would the manager of Division
A argue for, in order to maximise the reported ROI of the division? How would you
anticipate that the manager of Division B might react?
(b) It has been pointed out that a combination of bases of apportionment may be used instead
of just one, such as the space occupied by inventories (A 40 per cent, B 60 per cent) or
the level of actual or budgeted sales revenue. If you were given the freedom to revise the
calculation, what bases of apportionment would you recommend in the circumstances?
Discuss your approach and recalculate the ROI of Division A on your recommended basis.
Work to two places of decimals only.
CHAPTER 10 MEASURING PERFORMANCE
408
M10_ATRI3622_06_SE_C10.QXD 5/29/09 10:41 AM Page 408
Managing working capital
LEARNING OUTCOMES
This chapter considers the factors that must be taken into account when managing
the working capital of a business. Each element of working capital will be identified
and the major issues surrounding them will be discussed. Working capital represents
a significant investment for many businesses and so its proper management and
control can be vital. We saw in Chapter 8 that an investment in working capital is
typically an important aspect of new investment proposals.
INTRODUCTION
11
When you have completed this chapter, you should be able to:
l Identify the main elements of working capital.
l Discuss the purpose of working capital and the nature of the working capital
cycle.
l Explain the importance of establishing policies for the control of working
capital.
l Explain the factors that have to be taken into account when managing each
element of working capital.
M11_ATRI3622_06_SE_C11.QXD 5/29/09 3:32 PM Page 409
Working capital is usually defined as current assets less current liabilities. The major
elements of current assets are
l inventories
l trade receivables
l cash (in hand and at bank).
The major elements of current liabilities are
l trade payables
l bank overdrafts.
The size and composition of working capital can vary between industries. For some types
of business, the investment in working capital can be substantial. For example, a manu-
facturing business will typically invest heavily in raw material, work in progress and
finished goods, and will normally sell its goods on credit, giving rise to trade receivables.
A retailer, on the other hand, will hold only one form of inventories (finished goods),
and will usually sell goods for cash. Many service businesses hold no inventories.
Most businesses buy goods and/or services on credit, giving rise to trade payables.
Few, if any, businesses operate without a cash balance, though in some cases it is a
negative one (a bank overdraft).
Working capital represents a net investment in short-term assets. These assets
are continually flowing into and out of the business and are essential for day-to-day
operations. The various elements of working capital are interrelated and can be seen as
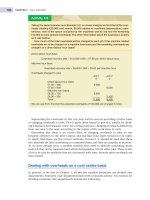
part of a short-term cycle. For a manufacturing business, the working capital cycle can
be depicted as shown in Figure 11.1.
What is working capital?
CHAPTER 11 MANAGING WORKING CAPITAL
410
‘
The working capital cycle
Figure 11.1
Cash is used to pay trade payables for raw materials, or raw materials are bought for immedi-
ate cash settlement. Cash is also spent on labour and other items that turn raw materials into
work in progress and, finally, into finished goods. The finished goods are sold to customers
either for cash or on credit. In the case of credit customers, there will be a delay before the cash
is received from the sales. Receipt of cash completes the cycle.
M11_ATRI3622_06_SE_C11.QXD 5/29/09 3:32 PM Page 410
For a retailer the situation would be as in Figure 11.1 except that there would be only
inventories of finished goods and no work in progress or raw materials. For a purely
service business, the working capital cycle would also be similar to that depicted in
Figure 11.1 except that there would be no inventories of finished goods or raw materials.
There may well be work in progress, however, since many services, for example a case
handled by a firm of solicitors, will take some time to complete and costs will build up
before the client is billed for them.
The management of working capital is an essential part of the business’s short-term
planning process. It is necessary for management to decide how much of each element
should be held. As we shall see later in this chapter, there are costs associated with
holding either too much or too little of each element. Management must be aware of
these costs, which include opportunity costs, in order to manage effectively. Hence,
potential benefits must be weighed against likely costs in an attempt to achieve the
optimum investment.
The working capital needs of a business are likely to vary over time as a result of
changes in the business environment. Managers must try to identify these changes to
ensure that the level of investment in working capital is appropriate. This means that
working capital decisions are frequently being made.
Managing working capital
In addition to changes in the external environment, changes arising within the
business could alter the required level of investment in working capital. Examples of
such internal changes include using different production methods (resulting, perhaps,
in a need to hold less inventories) and changes in the level of risk that managers are
prepared to take.
We might imagine that, compared with the scale of investment in non-current assets by
the typical business, the amounts involved with working capital are pretty trivial. However,
this is not the case – the scale of the working capital elements for most businesses is vast.
The scale of working capital
THE SCALE OF WORKING CAPITAL
411
What kinds of changes in the business environment might lead to a decision to change
the level of investment in working capital? Try to identify four possible changes that
could affect the working capital needs of a business.
These may include the following:
l changes in interest rates
l changes in market demand
l seasonal changes
l changes in the state of the economy.
You may have thought of others.
Activity 11.1
M11_ATRI3622_06_SE_C11.QXD 5/29/09 3:32 PM Page 411
Real World 11.1 gives some impression of the working capital involvement for five
very well-known UK businesses. These businesses were randomly selected, except that
each is high profile and each is from a different industry. For each business the major
items appearing on the statement of financial position (balance sheet) are expressed as
a percentage of the total investment by the providers of long-term finance (equity and
non-current liabilities).
The totals for current assets are pretty large when compared with the total long-term
investment. This is particularly true of Next and Rolls-Royce. The amounts vary
considerably from one type of business to the next. When we look at the nature of
working capital held we can see that Next, Rolls-Royce and Tesco, which produce
and/or sell goods, are the only ones that hold significant amounts of inventories. The
other two businesses are service providers and so inventories are not a significant item.
CHAPTER 11 MANAGING WORKING CAPITAL
412
REAL WORLD 11.1
A summary of the statements of financial position of five
UK businesses
Business: Next British Rolls-Royce Tesco Severn
plc Airways plc plc plc Trent plc
Statement of financial
position date: 28.1.07 31.3.07 31.12.07 24.2.07 31.3.07
Non-current assets 71 103 63 122 112
Current assets
Inventories 34 1 33 12 –
Trade receivables 69 8 34 6 8
Other receivables – 4 5 – –
Cash and near cash 15 30 37 9 3
118 43 109 27 11
Total assets 189 146 172 149 123
Equity and non-current
liabilities 100 100 100 100 100
Current liabilities
Trade payables 75 35 65 36 8
Taxation 10 1 3 3 1
Other short-term liabilities – 5 3 – –
Overdrafts and short-term loans 4 5 1 10 14
89 46 72 49 23
Total equity and liabilities 189 146 172 149 123
The non-current assets, current assets and current liabilities are expressed as a per-
centage of the total net long-term investment (equity plus non-current liabilities) of the
business concerned. Next is a major retail and home shopping business. British Airways
(BA) is a major airline. Rolls-Royce makes aero and other engines. Tesco is one of
the major UK supermarket chains. Severn Trent is a major supplier of water, sewerage
services and waste management, mainly in the UK.
Source: Table constructed from information appearing in the financial statements for the year ending in 2007 for each of the five
businesses concerned.
M11_ATRI3622_06_SE_C11.QXD 5/29/09 3:32 PM Page 412
We can see from the table that Tesco does not sell a lot on credit and very few of BA’s
and Severn Trent’s sales are on credit as these businesses have little invested in trade
receivables. It is interesting to note that Tesco’s trade payables are much higher than
its inventories. Since most of this money will be due to suppliers of inventories, it
means that the business is able, on average, to have the cash from a particular sale in
the bank before it needs to pay for the goods concerned.
These types of variation in the amounts and types of working capital elements are
typical of other businesses.
In the sections that follow, we shall consider each element of working capital
separately and how they might be properly managed. It seems from the evidence
presented in Real World 11.2 that there is much scope for improvement in working
capital management among European businesses.
THE SCALE OF WORKING CAPITAL
413
REAL WORLD 11.2
Working capital not working hard enough!
According to a survey of 1,000 of Europe’s largest businesses, working capital is not as
well managed as it could be. The survey, conducted in 2008 by REL Consultancy Group
and CFO Europe, suggests that larger European businesses have A865bn tied up in work-
ing capital that could be released through better management of inventories, trade receiv-
ables and trade payables. The potential for savings represents a total of 36 per cent of the
total working capital invested and is calculated by comparing the results for a particular
industry with the results for businesses within the upper quartile of that industry.
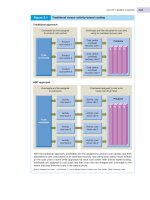
The overall working capital invested by large European businesses as a percentage of
sales for the five-year period ending in 2007 is shown in Figure 11.2.
The figure shows that there has been little variation in this percentage over time.
Source: Compiled from information in 2008 REL/CFO European Working Capital Survey, www.relconsult.com.
Working capital invested by large European businesses
as a percentage of sales
Figure 11.2
M11_ATRI3622_06_SE_C11.QXD 5/29/09 3:32 PM Page 413
A business may hold inventories for various reasons, the most common of which is to
meet the immediate day-to-day requirements of customers and production. However,
a business may hold more than is necessary for this purpose if there is a risk that future
supplies may be interrupted or scarce. Similarly, if there is a risk that the cost of invent-
ories will rise in the future, a business may decide to stockpile.
For some types of business, the inventories held may represent a substantial pro-
portion of the total assets held. For example, a car dealership that rents its premises
may have nearly all of its total assets in the form of inventories. Inventories levels of
manufacturers tend to be higher than in many other types of business as it is necessary
to hold three kinds of inventories: raw materials, work in progress and finished goods.
Each form of inventories represents a particular stage in the production cycle.
For some types of business, the level of inventories held may vary substantially over
the year owing to the seasonal nature of the industry. An example of such a business
is a greetings card manufacturer. For other businesses, inventories levels may remain
fairly stable throughout the year.
Where a business holds inventories simply to meet the day-to-day requirements of
its customers and for production, it will normally seek to minimise the amount of
inventories held. This is because there are significant costs associated with holding
inventories. These include:
l storage and handling costs
l financing costs
l the costs of pilferage and obsolescence
l the cost of opportunities forgone in tying up funds in this form of asset.
To gain some impression of the level of cost involved in holding inventories, Real
World 11.3 estimates the financing cost of inventories for five large businesses.
Managing inventories
CHAPTER 11 MANAGING WORKING CAPITAL
414
REAL WORLD 11.3
Inventories financing cost
The financing cost of inventories for each of five large businesses, based on their respect-
ive opportunity costs of capital, is calculated below.
Business Type of Cost of Average Cost of Profit Cost as %
operations capital inventories holding before of profit
held* inventories tax before tax
(a) (b) (a)
×
(b)
%£m £m£m%
Rolls-Royce Engineering 12.75 2,024 258 733 35.2
Rexam Packaging 11.0 373 41 260 15.8
Carphone Mobile phone 6.8 150 10.2 67 15.2
Warehouse retailer
Kingfisher Home 7.4 1,443 106.8 338.4 31.6
improvement
retailer
United Business Media 8.0 6.9 0.6 129.5 0.0
Media
* Based on opening and closing inventories for the financial year ending in 2007.
M11_ATRI3622_06_SE_C11.QXD 5/29/09 3:32 PM Page 414
As we have just seen, the cost of holding inventories can be very large. A business
must also recognise, however, that, if the level of inventories held is too low, there will
also be associated costs.
Before we go on to deal with the various approaches that can be taken to managing
inventories, Real World 11.4 describes how one large international business has sought
to reduce its inventories levels.
MANAGING INVENTORIES
415
We can see that for four out of the five businesses listed, inventories financing costs are
significant in relation to the profits generated. These figures do not take account of other
costs of inventories holding mentioned above, like the cost of providing a secure store for
the inventories. Clearly, the efficient management of inventories is an important issue for
many businesses.
Source: Annual reports of the businesses for the financial year ended in 2007.
What costs might a business incur as a result of holding too low a level of inventories?
Try to jot down at least three types of cost.
In answering this activity you may have thought of the following costs:
l loss of sales, from being unable to provide the goods required immediately;
l loss of customer goodwill, for being unable to satisfy customer demand;
l high transport costs incurred to ensure that inventories are replenished quickly;
l lost production due to shortage of raw materials;
l inefficient production scheduling due to shortages of raw materials;
l purchasing inventories at a higher price than might otherwise have been possible in
order to replenish inventories quickly.
Activity 11.2
REAL WORLD 11.4
Back to basics
Wal-Mart has said it will seek further reductions in the levels of backroom inventory it holds
at its US stores, in a drive to improve its performance. . . . John Menzer, vice chairman and
head of Wal-Mart’s US operations, made the retailer’s efforts to cut inventory one of the
key elements of remarks to reporters this week when he outlined current strategy. Wal-
Mart, he said, currently ‘has a real focus on reducing our inventory. Inventory that’s on
trailers behind our stores, in backrooms and on shelves in our stores.’ Cutting back on
inventory, he said, reduced ‘clutter’ in the retailer’s stores, gave a better return on invested
capital, reduced the need to cut prices on old merchandise, and increased the velocity at
which goods moved through the stores.
Eduardo Castro-Wright, chief executive of Wal-Mart’s US store network, said the
inventory reduction marked a return to basics for the retailer, which would be ‘getting more
disciplined’. Earlier this year, he said Wal-Mart would link inventory reduction to incentive
payments to its officers and managers. Wal-Mart is already regarded as one of the most
‘
FT
M11_ATRI3622_06_SE_C11.QXD 5/29/09 3:32 PM Page 415
To try to ensure that the inventories are properly managed, a number of procedures
and techniques may be used. These are reviewed below.
Budgeting future demand
One of the best ways to ensure that there will be inventories available to meet future
production and sales requirements is to make appropriate plans and budgets. Budgets
should deal with each product that the business makes and/or sells. It is important that
every attempt is made to ensure that budgets are realistic, as they will determine future
ordering and production levels. The budgets may be derived in various ways. They may
be developed using statistical techniques such as time series analysis, or they may be
based on the judgement of the sales and marketing staff. We considered inventories
budgets and their link to production and sales budgets in Chapter 6.
Financial ratios
One ratio that can be used to help monitor inventories levels is the average invent-
ories turnover period. This ratio is calculated as follows:
Average inventories turnover period
== ××
365
This will provide a picture of the average period for which inventories are held, and
can be useful as a basis for comparison. It is possible to calculate the average invent-
ories turnover period for individual product lines as well as for inventories as a whole.
Recording and reordering systems
The management of inventories in a business of any size requires a sound system of
recording inventories movements. There must be proper procedures for recording
inventories purchases and usages. Periodic inventories checks may be required to
ensure that the amount of physical inventories held is consistent with what is indi-
cated by the inventories records.
Average inventories held
Cost of sales
CHAPTER 11 MANAGING WORKING CAPITAL
416
Real World 11.4 continued
efficient logistical operations in US retailing. It is currently rolling out to all its US stores
and distribution centres a new parallel distribution system that speeds the delivery to
stores of 5,000 high turnover items. It is also discussing with its suppliers how new RFID
radio frequency tagging could be used to further reduce the volume of goods in transit to
its stores. But further reductions in its inventory turnover would release working capital
that could fund investment in its ongoing initiatives to improve its stores.
Adrienne Shapira, retail analyst at Goldman Sachs, has estimated that the retailer could
reduce its annual inventory by 18 per cent, which would lead to a $6bn reduction in work-
ing capital needs on a trailing 12-month basis.
Source: Wal-Mart aims for further inventory cuts, ft.com (Birchall, J.), © The Financial Times Limited, 19 April 2006.
M11_ATRI3622_06_SE_C11.QXD 5/29/09 3:32 PM Page 416
There should also be clear procedures for the reordering of inventories.
Authorisation for both the purchase and the issue of inventories should be confined to
a few senior staff. This should avoid problems of duplication and lack of co-ordination.
To determine the point at which inventories should be reordered, information will be
required concerning the lead time (that is, the time between the placing of an order
and the receipt of the goods) and the likely level of demand.
In most businesses, there will be some uncertainty surrounding the above factors
and so a buffer or safety inventories level may be maintained in case problems occur.
The amount of the buffer to be held is really a matter of judgement. This judgement
will depend on:
l the degree of uncertainty concerning the above factors;
l the likely costs of running out of the item concerned;
l the cost of holding the buffer inventories.
The effect of holding a buffer will be to raise the inventories level (the reorder point)
at which an order for new inventories is placed.
Carrying buffer inventories will increase the cost of holding inventories; however,
this must be weighed against the cost of running out of inventories, in terms of lost
sales, production problems and so on.
Real World 11.5 provides an example of how small businesses can use technology in
inventories reordering to help compete against their larger rivals.
MANAGING INVENTORIES
417
‘
An electrical retailer stocks a particular type of light switch. The annual demand for the
light switch is 10,400 units, and the lead time for orders is four weeks. Demand for the
light switch is steady throughout the year. At what quantity of the light switch should
the business reorder, assuming that it is confident of the information given above?
The average weekly demand for the switch is 10,400/52 = 200 units. During the time
between ordering new switches and receiving them, the quantity sold will be 4 × 200 units
= 800 units. So the business should reorder no later than when the level held reaches
800 units, in order to avoid running out of inventories.
Activity 11.3
Assume the same facts as in Activity 11.3. However, we are also told that the business
maintains buffer inventories of 300 units. At what level should the business reorder?
Reorder point = expected level of demand during the lead time plus the level
of buffer inventories
= 800 + 300
= 1,100 units
Activity 11.4
M11_ATRI3622_06_SE_C11.QXD 5/29/09 3:32 PM Page 417
Levels of control
Senior managers must make a commitment to the management of inventories.
However, the cost of controlling inventories must be weighed against the potential
benefits. It may be possible to have different levels of control according to the nature
of the inventories held. The ABC system of inventories control is based on the idea of
selective levels of control.
A business may find that it is possible to divide its inventories into three broad
categories: A, B and C. Each category will be based on the value of inventories held, as
is illustrated in Example 11.1.
CHAPTER 11 MANAGING WORKING CAPITAL
418
REAL WORLD 11.5
Taking on the big boys
The use of technology in inventories recording and reordering may be of vital importance
to the survival of small businesses that are being threatened by larger rivals. One such
example is that of small independent bookshops. Technology can come to their rescue in
two ways. First, electronic point-of-sale (EPOS) systems can record books as they are
sold and can constantly update records of inventories held. Thus, books that need to be
reordered can be quickly and easily identified. Second, the reordering process can be
improved by using web-based technology, which allows books to be ordered in real time.
Many large book wholesalers provide free web-based software to their customers for this
purpose and try to deliver books ordered during the next working day. This means that a
small bookseller, with limited shelf space, may keep one copy only of a particular book but
maintain a range of books that competes with that of a large bookseller.
Source: Information taken from ‘Small stores keep up with the big boys’, Financial Times, 5 February 2003.
‘
Alascan Products plc makes door handles and door fittings. It makes them in
brass, in steel and in plastic. The business finds that brass fittings account for
10 per cent of the physical volume of the finished inventories that it holds, but
represent 65 per cent of their total value. These are treated as Category A invent-
ories. There are sophisticated recording procedures, tight control is exerted over
inventories movements and there is a high level of security where the brass invent-
ories are stored. This is economic because the inventories represent a relatively
small proportion of the total volume.
The business finds that steel fittings account for 30 per cent of the total volume
of finished inventories and represent 25 per cent of their total value. They are
treated as Category B inventories, with a lower level of recording and manage-
ment control being applied.
The remaining 60 per cent of the volume of inventories is plastic fittings,
which represent the least valuable items and account for only 10 per cent of the
total value of finished inventories held. They are treated as Category C inventories,
Example 11.1
FT
M11_ATRI3622_06_SE_C11.QXD 5/29/09 3:32 PM Page 418
Figure 11.3 shows the nature of the ABC approach to inventories control.
Economic order quantity
It is possible to use decision models to help manage inventories. The economic order
quantity (EOQ) model is concerned with answering the question ‘How much should be
ordered?’ In its simplest form, the EOQ model assumes that demand is constant, so
that inventories will be depleted evenly over time, and replenished just at the point
that they run out. These assumptions would lead to a ‘saw-tooth’ pattern to represent
movements in inventories, as shown in Figure 11.4.
Inventories management models
INVENTORIES MANAGEMENT MODELS
419
so the level of recording and management control would be lower still. Applying
to these inventories, the level of control that is applied to Category A or even
Category B inventories would be uneconomic.
Categorising inventories in this way seeks to direct management effort to the
most important areas, and tries to ensure that the costs of controlling inventories
are appropriate to their importance.
ABC method of analysing and controlling inventories
Figure 11.3
Category A contains inventories that, though relatively few in quantity, account for a large pro-
portion of the total value. Category B inventories consists of those items that are less valuable
but more numerous. Category C comprises those inventories items that are very numerous
but relatively low in value. Different inventories control rules would be applied to each category.
For example, only Category A inventories would attract the more expensive and sophisticated
controls.
‘
M11_ATRI3622_06_SE_C11.QXD 5/29/09 3:32 PM Page 419
The EOQ model recognises that the key costs associated with inventories manage-
ment are the cost of holding the inventories and the cost of ordering them. The model
can be used to calculate the optimum size of a purchase order by taking account of
both of these cost elements. The cost of holding inventories can be substantial, and so
management may try to minimise the average amount of inventories held. However,
if the level of inventories held and, therefore, the holding costs, are reduced, there will
be a need to increase the number of orders during the period and so ordering costs will rise.
Figure 11.5 shows how, as the level of inventories and the size of inventories orders
increase, the annual costs of placing orders will decrease because fewer orders will be
placed. However, the cost of holding inventories will increase, as there will be higher
average inventories levels. The total costs curve, which is based on the sum of holding
costs and ordering costs, will fall until the point E, which represents the minimum
total cost. Thereafter, total costs begin to rise. The EOQ model seeks to identify point
E at which total costs are minimised. This will represent half of the optimum amount
that should be ordered on each occasion. Assuming, as we are doing, that inventories
are used evenly over time and that they fall to zero before being replaced, the average
inventories level equals half of the order size.
The EOQ model, which can be used to derive the most economic order quantity, is
EOQ
==
where
D = the annual demand for the inventories item (expressed in units of the inventories
item);
C = the cost of placing an order;
H = the cost of holding one unit of inventories for one year.
2DC
H
CHAPTER 11 MANAGING WORKING CAPITAL
420
Patterns of inventories movements over time
Figure 11.4
Here we assume that there is a constant rate of usage of the inventories item, and that invent-
ories are reduced to zero just as new inventories arrive. At time 0 there is a full level of invent-
ories. This is steadily used as time passes; and just as it falls to zero it is replaced. This pattern
is then repeated.
M11_ATRI3622_06_SE_C11.QXD 5/29/09 3:32 PM Page 420
Note that the cost of the inventories concerned, which is the price paid to the
supplier, does not directly impact on the EOQ model. The EOQ model is concerned
only with the administrative costs of placing each order and the costs of looking after
the inventories. Where the business operates an ABC system of inventories control,
however, more expensive inventories items will have greater holding costs. For example,
Category A inventories would tend to have a lower EOQ than Category B ones. So the
cost of the inventories may have an indirect effect on the economic order size that
the model recommends.
The basic EOQ model has a number of limiting assumptions. In particular, it
assumes that:
INVENTORIES MANAGEMENT MODELS
421
Inventories holding and order costs
Figure 11.5
Small inventories levels imply frequent reordering and high annual ordering costs. Small invent-
ories levels also imply relatively low inventories holding costs. High inventories levels imply
exactly the opposite. There is, in theory, an optimum order size that will lead to the sum of
ordering and holding costs (total costs) being at a minimum.
HLA Ltd sells 2,000 bags of cement each year. It has been estimated that the cost of
holding one bag of cement for a year is £4. The cost of placing an order for new invent-
ories is estimated at £250.
Calculate the EOQ for bags of cement.
Your answer to this activity should be as follows:
EOQ =
= 500 bags
This will mean that the business will have to order bags of cement four (2,000/500)
times each year in batches of 500 bags so that sales demand can be met.
2 × 2,000 × 250
4
Activity 11.5
M11_ATRI3622_06_SE_C11.QXD 5/29/09 3:32 PM Page 421
l demand for the particular inventories item can be predicted with accuracy;
l demand is constant over the period and does not fluctuate through seasonality or
for other reasons;
l no ‘buffer’ inventories are required;
l there are no discounts for bulk purchasing.
However, the model can be modified to overcome each of these limiting assumptions.
Many businesses use this model (or a development of it) to help in the management of
inventories.
Materials requirement planning systems
A materials requirement planning (MRP) system takes planned sales demand as its
starting point. It then uses a computer package to help schedule the timing of deliver-
ies of bought-in parts and materials to coincide with production requirements. It is
a co-ordinated approach that links materials and parts deliveries to the scheduled time
of their input to the production process. By ordering only those items that are neces-
sary to ensure the flow of production, it is possible to reduce inventories levels. MRP is
really a ‘top-down’ approach to inventories management, which recognises that invent-
ories ordering decisions cannot be viewed as being independent of production decisions.
In recent years, this approach has been extended to provide a fully integrated approach
to production planning. The approach also takes account of other manufacturing
resources such as labour and machine capacity.
Just-in-time inventories management
In recent years, many businesses have tried to eliminate the need to hold inventories
by adopting just-in-time (JIT) inventories management. This approach was first used
in the US defence industry during the Second World War, but was first used on a wide
scale by Japanese manufacturing businesses. The essence of JIT is, as the name suggests,
to have supplies delivered to the business just in time for them to be used in the
production process or in a sale. By adopting this approach the inventories holding
costs rest with suppliers rather than with the business itself. On the other hand, a
failure by a particular supplier to deliver on time could cause enormous problems and
costs to the business. Thus JIT can save cost, but it tends to increase risk.
For JIT to be successful, it is important that the business informs suppliers of its
inventories requirements in advance. Also suppliers, in their turn, must deliver materials
of the right quality at the agreed times. Failure to do so could lead to a dislocation of
production or supply to customers and could be very costly. Thus a close relationship
is required between the business and its suppliers. This close relationship enables sup-
pliers to schedule their own production to that of their customers. This should mean
that between supplier and customer there will be a net saving in the amount of invent-
ories that need to be held, relative to that that would apply were JIT not in operation.
Adopting JIT may well require re-engineering a business’s production process. To
ensure that orders are quickly fulfilled, factory production must be flexible and respon-
sive. This may require changes both to the production layout and to working practices.
Production flows may have to be redesigned and employees may have to be given
greater responsibility to allow them to deal with unanticipated problems and to
encourage greater commitment. Information systems must also be installed that
facilitate an uninterrupted production flow.
Although a business that applies JIT will not have to hold inventories, there may be
other costs associated with this approach. As the suppliers may need to hold invent-
ories for the customer, they may try to recoup this additional cost through increased
CHAPTER 11 MANAGING WORKING CAPITAL
422
‘
‘
M11_ATRI3622_06_SE_C11.QXD 5/29/09 3:32 PM Page 422
prices. On the other hand, the close relationship between customer and supplier
should enable the supplier to predict its customers’ inventories needs. This means that
suppliers can tailor their own production to that of the customer. The close relation-
ship necessary between the business and its suppliers may also prevent the business
from taking advantage of cheaper sources of supply if they become available.
Many people view JIT as more than simply an inventories control system. The philo-
sophy underpinning this approach is concerned with eliminating waste and striving
for excellence. There is an expectation that suppliers will always deliver inventories on
time and that there will be no defects in the items supplied. There is also an expecta-
tion that, for manufacturers, the production process will operate at maximum
efficiency. This means there will be no production breakdowns and the queuing and
storage times of products manufactured will be eliminated, as only that time spent
directly on processing the products is seen as adding value. While these expectations
may be impossible to achieve, they do help to create a culture that is dedicated to the
pursuit of excellence and quality.
Real World 11.6 and Real World 11.7 show how two very well-known businesses
operating in the UK (one a retailer, the other a manufacturer) use JIT to advantage.
INVENTORIES MANAGEMENT MODELS
423
REAL WORLD 11.6
JIT at Boots
The Boots Company plc, the UK’s largest healthcare retailer, has improved inventories
management at its stores. The business is working towards a JIT system where delivery
from its one central warehouse in Nottingham will be made every day to each retail branch,
with nearly all of the inventories lines being placed directly on to the sales shelves, not into
a branch inventories store room. The business says that this will bring significant savings
of stores staff time and lead to significantly lower levels of inventories being held, without
any lessening of the service offered to customers. The new system is expected to lead to
major economic benefits for the business.
Source: Information taken from The Boots Company plc Annual Report and Accounts 2005.
REAL WORLD 11.7
JIT at Nissan
Nissan Motors UK Limited, the UK manufacturing arm of the world-famous Japanese
car business, has a plant in Sunderland in the north east of England. Here it operates a
fairly well-developed JIT system. For example, Sommer supplies carpets and soft interior
trim from a factory close to the Nissan plant. It makes deliveries to Nissan once every
20 minutes on average, so as to arrive exactly as they are needed in production. This is
fairly typical of all of the 200 suppliers of components and materials to the Nissan plant.
The business used to have a complete JIT system. More recently, however, Nissan has
drawn back from its total adherence to JIT. By using only local suppliers it had cut itself off
from the opportunity to exploit low-cost suppliers, particularly some located in China. Sourcing
parts from the Far East has now led the business to feel the need to hold buffer inventories
of certain items to guard against disruption of supply arising from transport problems.
Sources: Information taken from Partnership Sourcing Best Practice Case Study, www.pslcbi.com/studies/docnissan.htm, and
Tighe, C., ‘Nissan reviews just-in-time parts policy’, Financial Times, 23 October 2006.
M11_ATRI3622_06_SE_C11.QXD 5/29/09 3:32 PM Page 423
Selling goods or services on credit will result in costs being incurred by a business.
These costs include credit administration costs, bad debts, and opportunities forgone
to use the funds for more profitable purposes. However, these costs must be weighed
against the benefits of increased sales resulting from the opportunity for customers to
delay payment.
Selling on credit is very widespread and is the norm outside the retail industry.
When a business offers to sell its goods or services on credit, it must have clear policies
concerning
l which customers should receive credit;
l how much credit should be offered;
l what length of credit it is prepared to offer;
l whether discounts will be offered for prompt payment;
l what collection policies should be adopted;
l how the risk of non-payment can be reduced.
In this section, we shall consider each of these issues.
Which customers should receive credit and how much
credit should they be offered?
A business offering credit runs the risk of not receiving payment for goods or services
supplied. Thus, care must be taken over the type of customer to whom credit facilities
are offered and how much credit is allowed. When considering a proposal from a cus-
tomer for the supply of goods or services on credit, the business must take a number
of factors into account. The following five Cs of credit provide a business with a
useful checklist.
l Capital. The customer must appear to be financially sound before any credit is ex-
tended. Where the customer is a business, its financial statements should be exam-
ined. Particular regard should be given to the customer’s likely future profitability
and liquidity. In addition, any major financial commitments (for example, capital
expenditure, contracts with suppliers) must be taken into account.
l Capacity. The customer must appear to have the capacity to pay amounts owing.
Where possible, the payment record of the customer to date should be examined. If
the customer is a business, the type of business operated and the physical resources
of the business will be relevant. The value of goods that the customer wishes to buy
on credit must be related to the customer’s total financial resources.
l Collateral. On occasions, it may be necessary to ask for some kind of security for
goods supplied on credit. When this occurs, the business must be convinced that the
customer is able to offer a satisfactory form of security.
l Conditions. The state of the industry in which the customer operates, and the general
economic conditions of the particular region or country, may have an important
influence on the ability of a customer to pay the amounts outstanding on the due
date.
l Character. It is important for a business to make some assessment of the customer’s
character. The willingness to pay will depend on the honesty and integrity of the
individual with whom the business is dealing. Where the customer is a business, this
Managing receivables
CHAPTER 11 MANAGING WORKING CAPITAL
424
‘
M11_ATRI3622_06_SE_C11.QXD 5/29/09 3:32 PM Page 424
will mean assessing the characters of its senior managers. The selling business must
feel satisfied that the customer will make every effort to pay any amounts owing.
It is clear from the above that the business will need to gather information
concerning the ability and willingness of the customer to pay the amounts owing at
the due dates.
MANAGING RECEIVABLES
425
Assume that you are the credit manager of a business and that a limited company
approaches you with a view to buying goods on credit. What sources of information
might you decide to use to help assess the financial health of the potential customer?
There are various possibilities. You may have thought of some of the following:
l Trade references. Some businesses ask potential customers to supply them with
references from other suppliers who have made sales on credit to them. This may be
extremely useful provided that the references supplied are truly representative of the
opinions of a customer’s suppliers. There is a danger that a potential customer will
be selective when giving details of other suppliers, in an attempt to create a more
favourable impression than is deserved.
l Bank references. It is possible to ask the potential customer for a bank reference.
Although banks are usually prepared to supply references, the contents of such refer-
ences are not always very informative. If customers are in financial difficulties, the bank
may be unwilling to add to their problems by supplying poor references. It is worth
remembering that the bank’s loyalty is likely to be with the customer rather than the
enquirer. The bank will usually charge a fee for providing a reference.
l Published financial statements. A limited company is obliged by law to file a copy of its
annual financial statements with the Registrar of Companies. These financial state-
ments are available for public inspection and provide a useful source of information.
Apart from the information contained in the financial statements, company law requires
public limited companies to state in the directors’ report the average time taken to pay
suppliers. The annual reports of many companies are available on their own websites
or on computer-based information systems (for example, FAME).
l The customer. Interviews with the directors of the customer business and visits to its
premises may be carried out to gain an impression of the way that the customer con-
ducts its business. Where a significant amount of credit is required, the business may
ask the customer for access to internal budgets and other unpublished financial infor-
mation to help assess the level of risk involved.
l Credit agencies. Specialist agencies exist to provide information that can be used to
assess the creditworthiness of a potential customer. The information that a credit
agency supplies may be gleaned from various sources, including the financial state-
ments of the customer and news items relating to the customer from both published
and unpublished sources. The credit agencies may also provide a credit rating for the
business. Agencies will charge a fee for their services.
l Register of Judgments, Orders and Fines. Any money judgments given against the busi-
ness or an individual in a county court will be maintained on the register for six years.
This register is available for inspection by any member of the public for a small fee.
l Other suppliers. Similar businesses will often be prepared to exchange information
concerning slow payers or defaulting customers through an industry credit circle. This
can be a reliable and relatively cheap way of obtaining information.
Activity 11.6
M11_ATRI3622_06_SE_C11.QXD 5/29/09 3:32 PM Page 425
Length of credit period
A business must determine what credit terms it is prepared to offer its customers. The
length of credit offered to customers can vary significantly between businesses. It may
be influenced by such factors as:
l the typical credit terms operating within the industry;
l the degree of competition within the industry;
l the bargaining power of particular customers;
l the risk of non-payment;
l the capacity of the business to offer credit;
l the marketing strategy of the business.
The last point identified may require some explanation. If, for example, a business
wishes to increase its market share, it may decide to be more generous in its credit pol-
icy in an attempt to stimulate sales. Potential customers may be attracted by the offer
of a longer credit period. However, any such change in policy must take account of the
likely costs and benefits arising.
To illustrate this point, consider Example 11.2.
CHAPTER 11 MANAGING WORKING CAPITAL
426
Torrance Ltd produces a new type of golf putter. The business sells the putter to
wholesalers and retailers and has an annual turnover of £600,000. The following
data relate to each putter produced.
£
Selling price 40
Variable costs (20)
Fixed cost apportionment (6)
Profit 14
The business’s cost of capital is estimated at 10 per cent a year.
Torrance Ltd wishes to expand the sales volume of the new putter. It believes
that offering a longer credit period can achieve this. The business’s average receiv-
ables collection period is currently 30 days. It is considering three options in an
attempt to increase sales revenue. These are as follows:
Option 1 Option 2 Option 3
Increase in average collection period (days) 10 20 30
Increase in sales revenue (£) 30,000 45,000 50,000
To enable the business to decide on the best option to adopt, it must weigh the
benefits of the options against their respective costs. The benefits arising will be
represented by the increase in profit from the sale of additional putters. From the
cost data supplied we can see that the contribution (that is, selling price (£40) less
variable costs (£20)) is £20 a putter, that is, 50 per cent of the selling price. So,
whatever increase there may be in sales revenue, the additional contributions will
be half of that figure. The fixed costs can be ignored in our calculations, as they
will remain the same whichever option is chosen.
The increase in contribution under each option will therefore be:
Option 1 Option 2 Option 3
50% of the increase in sales revenue (£) 15,000 22,500 25,000
Example 11.2
M11_ATRI3622_06_SE_C11.QXD 5/29/09 3:32 PM Page 426
Example 11.2 illustrates the way that a business should assess changes in credit
terms. However, if there is a risk that, by extending the length of credit, there will be
an increase in bad debts, this should also be taken into account in the calculations, as
should any additional trade receivables collection costs that will be incurred.
Real World 11.8 shows how the length of credit taken by some larger UK businesses
leads to problems for smaller businesses.
MANAGING RECEIVABLES
427
The increase in trade receivables under each option will be as follows:
Option 1 Option 2 Option 3
£££
Projected level of trade receivables
40 × £630,000/365 (Note 1) 69,041
50 × £645,000/365 88,356
60 × £650,000/365 106,849
Current level of trade receivables
30 × £600,000/365 (49,315) ( 49,315) (49,315)
Increase in trade receivables 19,726 39,041 57,534
The increase in receivables that results from each option will mean an addi-
tional finance cost to the business.
The net increase in the business’s profit arising from the projected change is:
Option 1 Option 2 Option 3
£££
Increase in contribution (see above) 15,000 22,500 25,000
Increase in finance cost (Note 2) (1,973 ) (3,904) (5,753)
Net increase in profits 13,027 18,596 19,247
The calculations show that Option 3 will be the most profitable one.
Notes:
1 If the annual sales revenue totals £630,000 and 40 days’ credit is allowed (both of which will
apply under Option 1), the average amount that will be owed to the business by its customers,
at any point during the year, will be the daily sales revenue (that is, £630,000/365) multiplied by
the number of days that the customers take to pay (that is, 40).
Exactly the same logic applies to Options 2 and 3 and to the current level of trade receivables.
2 The increase in the finance cost for Option 1 will be the increase in trade receivables
(£19,726) × 10 per cent. The equivalent figures for the other options are derived in a similar way.
REAL WORLD 11.8
Credit where it’s due
Late payment to small companies has got progressively worse over the past three years and
they need to employ stricter credit management techniques, a survey released today claims.
Siemens Financial Services (SFS), a subsidiary of Siemens, the German engineering
group, studied the accounts of thousands of UK companies. It found that smaller firms
had to wait for 80 days to get paid by customers in 2006, compared with 69 days in 2004.
In contrast, medium-size and large companies have seen their ‘days sales outstanding’
hold steady over the period at 62 days and 47 days respectively.
Rod Tonna-Barthet, sales director at SFS, said the results showed that ‘small firms are
suffering’ as a result of medium-size and large companies using competitive pressures to
extend payment terms.
Source: Late payments hit small companies, ft.com (Chisholm, J.), © The Financial Times Limited, 29 January 2007.
FT
M11_ATRI3622_06_SE_C11.QXD 5/29/09 3:32 PM Page 427
An alternative approach to evaluating the credit decision
It is possible to view the credit decision as a capital investment decision. Granting trade
credit involves an opportunity outlay of resources in the form of cash (which has been
temporarily forgone) in the expectation that future cash flows will be increased
(through higher sales) as a result. A business will usually have choices concerning the
level of investment to be made in credit sales and the period over which credit is
granted. These choices will result in different returns and different levels of risk. There
is no reason in principle why the net present value (NPV) investment appraisal
method, which we considered in Chapter 8, should not be used to evaluate these
choices. We have seen that the NPV method takes into account both the time value of
money and the level of risk involved.
Approaching the problem as an NPV assessment is not different in principle from
the way that we dealt with the decision in Example 11.2. In both approaches the time
value of money is considered, but in Example 11.2 we did it by charging a financing
cost on the outstanding trade receivables.
Cash discounts
A business may decide to offer a cash discount (or discount for prompt payment) in
an attempt to encourage prompt payment from its credit customers. The size of any
discount will be an important influence on whether a customer decides to pay promptly.
From the business’s viewpoint, the cost of offering discounts must be weighed
against the likely benefits in the form of a reduction both in the cost of financing
receivables and in the amount of bad debts.
In practice, there is always the danger that a customer may be slow to pay and yet
may still take the discount offered. Where the customer is important to the business,
it may be difficult to insist on full payment. An alternative to allowing the customer to
take discounts by reducing payment is to agree in advance to provide discounts for
prompt payment through quarterly credit notes. As credit notes will be given only for those
debts paid on time, the customer will often make an effort to qualify for the discount.
CHAPTER 11 MANAGING WORKING CAPITAL
428
‘
Williams Wholesalers Ltd at present asks its credit customers to pay by the end of the
month after the month of delivery. In practice, customers take rather longer to pay; on
average, 70 days. Sales revenue amounts to £4m a year and bad debts to £20,000 a year.
It is planned to offer customers a cash discount of 2 per cent for payment within
30 days. Williams estimates that 50 per cent of customers will accept this facility but that
the remaining customers, who tend to be slow payers, will not pay until 80 days after the
sale. At present the business has an overdraft facility at an interest rate of 13 per cent a
year. If the plan goes ahead, bad debts will be reduced to £10,000 a year and there will
be savings in credit administration expenses of £6,000 a year.
Required:
Should Williams Wholesalers Ltd offer the new credit terms to customers? You should
support your answer with any calculations and explanations that you consider necessary.
The answer to this question can be found in Appendix B at the back of the book.
Self-assessment question 11.1
M11_ATRI3622_06_SE_C11.QXD 5/29/09 3:32 PM Page 428
Debt factoring and invoice discounting
Trade receivables can, in effect, be turned into cash by either factoring them or having
sales invoices discounted. Both are forms of asset-based finance, which involve a finan-
cial institution providing a business with an advance up to 80 per cent of the value of
the trade receivables outstanding. Both of these methods seem to be fairly popular
approaches to managing receivables.
Collection policies and reducing the risk of non-payment
A business offering credit must ensure that amounts owing are collected as quickly as
possible so that the risk of non-payment is minimised. Various steps can be taken to
achieve this, including the following.
Develop customer relationships
For major customers it is often useful to cultivate a relationship with the key staff
responsible for paying sales invoices. By so doing, it may be possible to increase the
chances of prompt payment. For less important customers, the business should at least
identify key staff responsible for paying invoices, who can be contacted in the event of
a payment problem.
Publicise credit terms
The credit terms of the business should be made clear in all relevant correspondence,
such as order acknowledgements, invoices and statements. In early negotiations with the
prospective customer, credit terms should be openly discussed and an agreement reached.
Issue invoices promptly
An efficient collection policy requires an efficient accounting system. Invoices (bills)
must be sent out promptly to customers, as must monthly statements. Reminders must
also be despatched promptly to customers who are late in paying. If a customer fails to
respond to a reminder, the accounting system should alert managers so that a stop can
be placed on further deliveries.
Monitor outstanding debts
Management can monitor the effectiveness of collection policies in a number of ways.
One method is to calculate the average settlement period for trade receivables ratio.
This ratio is calculated as follows:
Average settlement period for trade receivables
== ××
365
Although this ratio can be useful, it is important to remember that it produces an
average figure for the number of days for which debts are outstanding. This average
may be badly distorted by a few large customers who are very slow or very fast payers.
Produce an ageing schedule of trade receivables
A more detailed and informative approach to monitoring receivables may be to pro-
duce an ageing schedule of trade receivables. Receivables are divided into categories
Average trade receivables
Credit sales
MANAGING RECEIVABLES
429
‘
‘
M11_ATRI3622_06_SE_C11.QXD 5/29/09 3:32 PM Page 429