Tools for Business Decision Management Makers_14 potx
Bạn đang xem bản rút gọn của tài liệu. Xem và tải ngay bản đầy đủ của tài liệu tại đây (679.01 KB, 33 trang )
Most businesses are far too large and complex for managers to be able to see and assess
everything that is going on in their own areas of responsibility merely by personal obser-
vation. Managers need information on all aspects within their control. Management
accounting reports can provide them with this information, to a greater or lesser extent.
These reports can be seen, therefore, as acting as the eyes and ears of the managers, pro-
viding insights not necessarily obvious without them.
The following accounting information relating to a new service might be useful to a manager:
l the cost of providing the service and the level of profit that will be required;
l the capital investment that will be necessary to enable the business to provide the ser-
vice; and
l the extent to which the provision of the service would be expected to enhance the busi-
ness’s wealth.
There is no doubt that the onus is on accountants to make their reports as easy to under-
stand as they can possibly be. A key aspect of accountants’ work is communicating to
non-accountants, and they should never overlook this. At the same time, accounting
information cannot always be expressed in such a way that someone with absolutely no
accounting knowledge can absorb it successfully. The onus is also therefore on managers to
acquire a working knowledge of the basis on which accounting reports are prepared and
what they mean.
The two attributes are:
1 They must relate to the objective(s) that the decision is intended to work towards. In
most businesses this is taken to be wealth enhancement. This means that any informa-
tion relating to the decision that does not impact on wealth enhancement is irrelevant,
where wealth enhancement is the sole objective. In practice a business may have more
than one objective.
2 They must differ between the options under consideration. Where a cost will be the same
irrespective of the outcome of the decision that is to be taken it is irrelevant. It is only on
the basis of things that differ from one outcome to another that decisions can be made.
A sunk cost is a past and, therefore, an irrelevant cost in the context of any decision about
the future. Thus, for example, the cost of an item of inventories already bought is a sunk
cost. It is irrelevant, in any decision involving the use of the inventories, because this cost
will be the same irrespective of the decision made.
An opportunity cost is the cost of being deprived of the next best option to the one under
consideration. For example, where using an hour of a worker’s time on activity A deprives
the business of the opportunity to use that time in a profitable activity B, the benefit lost
from activity B is an opportunity cost of pursuing activity A.
Cost may be defined as the amount of resources, usually measured in monetary terms,
sacrificed to achieve a particular objective.
A committed cost is like a past cost in that an irrevocable decision has been made to incur
the cost. This might be because the business has entered into a binding contract, for exam-
ple to rent some premises for the next two years. Thus it is effectively a past cost even
though the payment (for rent, in our example) has yet to be made. Since the business can-
not avoid a committed cost, committed costs cannot be relevant costs.
2.4
2.3
2.2
2.1
Chapter 2
1.4
1.3
1.2
SOLUTIONS TO REVIEW QUESTIONS
471
Z03_ATRI3622_06_SE_APP3.QXD 5/29/09 10:43 AM Page 471
A fixed cost is one that is the same irrespective of the level of activity or output. Typical
examples of costs that are fixed, irrespective of the level of production or provision of a ser-
vice, include rent of business premises, salaries of supervisory staff and insurance.
A variable cost is one that varies with the level of activity or output. Examples include
raw materials and labour, where labour is rewarded in proportion to the level of output.
Note particularly that it is relative to the level of activity that costs are fixed or variable.
Fixed costs will be affected by inflation and they will be greater for a longer period than for
a shorter one.
For a particular product or service, knowing which costs are fixed and which are variable
enables managers to predict the total cost for any particular level of activity. It also enables
them to concentrate only on the variable costs in circumstances where a decision will not
alter the fixed costs.
The BEP is the break-even point, that is, the level of activity, measured either in physical
units or in value of sales revenue, at which the sales revenue exactly covers all of the costs,
both fixed and variable.
Break-even point is calculated as
Fixed costs/(sales revenue per unit − variable costs per unit)
which may alternatively be expressed as
Fixed costs/Contribution per unit
Thus break-even will occur when the contributions for the period are sufficient to cover the
fixed costs for the period.
Break-even point tends to be useful as a comparison with planned level of activity in an
attempt to assess the riskiness of the activity.
Operating gearing refers to the extent of fixed cost relative to variable cost in the total cost
of some activity. Where the fixed cost forms a relatively high proportion of the total, we say
that the activity has high operating gearing.
Typically, high operating gearing is present in environments where there is a relatively
high level of mechanisation (that is, capital-intensive environments). This is because such
environments tend simultaneously to involve relatively high fixed costs of depreciation,
maintenance, and so on and relatively low variable costs.
High operating gearing tends to mean that the effects of increases or decreases in the
level of activity have an accentuated effect on operating profit. For example, a 20% decrease
in output of a particular service will lead to a greater than 20% decrease in operating profit,
assuming no cost or price changes.
In the face of a restricting scarce resource, profit will be maximised by using the scarce
resource on output where the contribution per unit of the scarce resource is maximised.
This means that the contribution per unit of the scarce resource (for example, hour of
scarce labour, or unit of scarce raw material) for each competing product or service needs to
be identified. It is then a question of allocating the scarce resource to the product or service
that provides the highest contribution per unit of the particular scarce resource.
The logic of this approach is that the scarce resource is allocated to the activity that uses
it most effectively, in terms of contribution and, therefore, profit.
3.4
3.3
3.2
3.1
Chapter 3
APPENDIX C SOLUTIONS TO REVIEW QUESTIONS
472
Z03_ATRI3622_06_SE_APP3.QXD 5/29/09 10:43 AM Page 472
In process costing, the total production cost for a period is divided by the number of com-
pleted units of output for the period to deduce the full cost per unit. Where there is work
in progress at the beginning and/or the end of the period complications arise.
The problem is that some of the completed output incurred cost in the preceding period.
Similarly, some of the cost incurred in the current period leads to completed production in
the subsequent period. Account needs to be taken of these facts, if reliable full cost infor-
mation is to be obtained.
The only reason for distinguishing between direct and indirect costs is to help to deduce
the full cost of a unit of output in a job-costing environment. In an environment where
all units of output are identical, or can reasonably be regarded as being so, a process-
costing approach will be taken. This avoids the need for identifying direct and indirect costs
separately.
Direct cost forms that part of the total cost of pursuing some activity that can, unequi-
vocally, be associated with that particular activity. Examples of direct cost items in the
typical job-costing environment include direct labour and direct materials.
Indirect cost is the remainder of the cost of pursuing some activity.
In practice, knowledge of the direct costs tends to provide the basis used to charge over-
heads to jobs.
The distinction between direct and indirect cost is irrelevant for any other purpose.
Directness and indirectness is dictated by the nature of that which is being costed, as
much as the nature of the cost.
The notion of direct and indirect cost is concerned only with the extent to which particu-
lar elements of cost can unequivocally be related to, and measured in respect of, a particular
cost unit, usually a product or service. The distinction between direct and indirect costs is
made exclusively for the purpose of deducing the full cost of some cost unit, in an envir-
onment where each cost unit is not identical, or close enough to being identical for it to be
treated as such. Thus, it is typically in the context of job costing, or some variant of it, that
the distinction between direct and indirect cost is usefully made.
The notion of variable and fixed cost is concerned entirely with how costs behave in the
face of changes in the volume of output. The benefit of being able to distinguish between
fixed and variable cost is that predictions can be made of what total cost will be at particu-
lar levels of volume and/or what reduction or addition to cost will occur if the volume of
output is reduced or increased.
Thus the notion of direct and indirect cost, on the one hand, and that of variable and
fixed cost, on the other, are not linked to one another, and, in most contexts, some ele-
ments of direct cost are variable, while some are fixed. Similarly, indirect cost might be fixed
or variable.
The full cost includes all of the cost of pursuing the cost objective, including a ‘fair’ share
of the overheads. Generally the full cost represents an average cost of the various elements,
rather than a cost that arises because the business finds itself in a particular situation.
The fact that the full cost reflects all aspects of cost should mean that, were the
business to sell its output at a price exactly equal to the full cost (manufacturing and non-
manufacturing cost), the sales revenues for the period would exactly cover all of the cost
and the business would break even, that is make neither profit nor loss.
4.4
4.3
4.2
4.1
Chapter 4
SOLUTIONS TO REVIEW QUESTIONS
473
Z03_ATRI3622_06_SE_APP3.QXD 5/29/09 10:43 AM Page 473
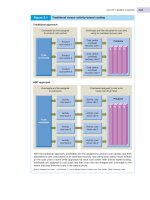
ABC is a means of dealing with charging overheads to units of output to derive full costs in
a multi-product (job or batch costing) environment.
The traditional approach tends to accept that once identifiable direct costs, normally
labour and materials, have been taken out, all of the other costs (overheads) must be treated
as common costs and applied to jobs using the same formula, typically on the basis of direct
labour hours.
ABC takes a much more enquiring approach to overheads. It follows the philosophy that
overheads do not occur for no reason, but they must be driven by activities. For example,
a particular type of product may take up a disproportionately large part of supervisors’
time. If that product were not made, in the long run, supervision costs could be cut (fewer
supervisors would be needed). Whereas the traditional approach would just accept that
supervisory salaries are an overhead, which needs to be apportioned along with other over-
heads, ABC would seek to charge that part of the supervisors’ salaries which is driven by the
particular type of product, to that product.
One criticism is on the issue of the cost/benefit balance. It is claimed that the work neces-
sary to analyse activities and identify the cost drivers tends to be more expensive than is
justified by the increased quality of the full costs that emerge.
Linked to this is the belief of many that full cost information is of rather dubious value
for most purposes, irrespective of how the full costs are deduced. Many argue that full cost
information is flawed by the fact that it takes no account of opportunity costs.
ABC enthusiasts would probably argue that deducing better quality full costs is not the
only benefit which is available, if the overhead cost drivers can be identified. Knowing what
drives costs can enable management to exercise more control over them. This benefit needs
to be taken into account when assessing the cost/benefit of using ABC.
Generally, a rise in the price of a commodity causes a fall in demand. A commodity is said
to have a relatively elastic demand where demand reacts relatively dramatically (stretches
more) in the face of a particular price alteration. Elastic demand tends to be associated with
commodities that are not essential, perhaps because there is a ready substitute.
It can be very helpful for those involved with pricing decisions to have some feel for the
elasticity of demand of the commodity that will be the subject of a decision. The sensitiv-
ity of the demand to the decision is obviously much greater (and the pricing decision more
crucial) with commodities whose demand is elastic than with commodities whose demand
is relatively inelastic.
A business will make the most profit from one of its products or services at the point where
marginal sales revenue equals marginal cost of production, or in other words, the point
where the increase in total sales revenue that will result from selling one more unit equals
the increase in total costs which will result from selling that unit.
A budget can be defined as a financial plan for a future period of time. Thus it sets out the
intentions which management has for the period concerned. Achieving the budget plans
should help to achieve the long-term plans of the business. Achievement of the long-term
plans should mean that the business is successfully working towards its objectives.
A budget differs from a forecast in that a forecast is a statement of what is expected to
happen without the intervention of management, perhaps because they cannot intervene
(as with a weather forecast). A plan is an intention to achieve.
Normally management would take account of reliable forecasts when making its plans.
6.1
Chapter 6
5.4
5.3
5.2
5.1
Chapter 5
APPENDIX C SOLUTIONS TO REVIEW QUESTIONS
474
Z03_ATRI3622_06_SE_APP3.QXD 5/29/09 10:43 AM Page 474
1 Budgets tend to promote forward thinking and the possible identification of short-term
problems. Managers must plan and the budgeting process tends to force them to do so.
In doing so they are likely to encounter potential problems. If the potential problems can
be identified early enough, solutions might be easily found.
2 Budgets can be used to help co-ordination between various sections of the business. It
is important that the plans of one area of the business fit in with those of other areas;
a lack of co-ordination could have disastrous consequences. Having formal statements
of plans for each aspect of the business enables a check to be made that plans are
complementary.
3 Budgets can motivate managers to better performance. It is believed that people are
motivated by having a target to aim for. Provided that the inherent goals are achievable,
budgets can provide an effective motivational device.
4 Budgets can provide a basis for a system of control. Having a plan against which actual
performance can be measured provides a potentially useful tool of control.
5 Budgets can provide a system of authorisation. Many managers have ‘spending’ budgets
such as research and development, staff training, and so on. For these people, the size of
their budget defines their authority to spend.
Control can be defined as ‘compelling things to occur as planned’. This implies that con-
trol can only be achieved if a plan exists. Budgets are financial plans. This means that, if
actual performance can be compared with the budget (plan) for each aspect of the business,
divergences from plan can be spotted. Steps can then be taken to bring matters back under
control where they are going out of control.
A budget committee is a group of senior staff that is responsible for the budget prepara-
tion process within an organisation. The existence of the committee places the budget
responsibility clearly with an identifiable group of people. This group can focus on the tasks
involved.
Feedforward controls try to anticipate what is likely to happen in the future and then assist
in making the actual outcome match the desired outcome. They contrast with feedback
controls, which simply compare actual to planned outcomes after the event. Feedforward
controls are therefore more pro-active.
A variance is the effect on budgeted profit of the particular cost or revenue item being con-
sidered. It represents the difference between the budgeted profit and the actual profit assum-
ing everything, except the item under consideration, had gone according to budget. From
this it must be the case that
Budgeted profit + favourable variances − unfavourable variances = actual profit.
The purpose of analysing variances is to identify whether, and if so where, things are not
going according to plan. If this can be done, it may be possible to find out the cause of
things going out of control. If this can be discovered, it may then be possible to put things
right for the future.
Where the budgeted and actual volumes of output do not coincide it is impossible to make
valid comparison of ‘allowed’ and actual costs and revenues. Flexing the original budget to
reflect the actual output level enables a more informative comparison to be made.
Flexing certainly does not mean that output volume differences do not matter. Flexing
will show (as the difference between flexed and original budget profits) the effect on profit
of output volume differences.
7.3
7.2
7.1
Chapter 7
6.4
6.3
6.2
SOLUTIONS TO REVIEW QUESTIONS
475
Z03_ATRI3622_06_SE_APP3.QXD 5/29/09 10:43 AM Page 475
Deciding whether variances should be investigated involves the use of judgement. Often
management will set a threshold of significance, for example 5 per cent of the budgeted
figure for each variance relating to revenue or cost items. All variances above this threshold
would then be investigated. Even where variances are below the threshold, any sign of a sys-
temic variance, shown, for example, by an increasing cumulative total for the factor, should
be investigated.
Knowledge of the cause of a particular variance may well put management in a position
to take actions that will be beneficial to the business in the future. Investigating variances,
however, is likely to be relatively expensive in staff time. A judgement needs to be made on
whether the value or benefit of knowing the cause of the variance will be justified by the
cost of this knowledge. As with most investigations of this type, it is difficult to judge the
value of the knowledge until after the variance has been investigated.
NPV is usually considered the best method of assessing investment opportunities because it
takes account of:
l The timing of the cash flows. By discounting the various cash flows associated with each pro-
ject according to when it is expected to arise, it recognises the fact that cash flows do not
all occur simultaneously. Associated with this is the fact that, by discounting using the
opportunity cost of finance (that is, the return which the next best alternative oppor-
tunity would generate), it is possible to identify the net benefit after financing costs have
been met (as the NPV).
l The whole of the relevant cash flows. NPV includes all of the relevant cash flows irrespec-
tive of when they are expected to occur. It treats them differently according to their date
of occurrence, but they are all taken account of in the NPV and they all have, or can
have, an influence on the decision.
l The objectives of the business. NPV is the only method of appraisal where the output of the
analysis has a direct bearing on the wealth of the business. (Positive NPVs enhance
wealth; negative ones reduce it). Since most private sector businesses seek to increase
their value and wealth, NPV clearly is the best approach to use, at least out of the
methods we have considered so far.
NPV provides clear decision rules concerning acceptance/rejection of projects and the
ranking of projects. It is fairly simple to use, particularly with the availability of modern
computer software that takes away the need for routine calculations to be done manually.
The payback method, in its original form, does not take account of the time value of
money. However, it would be possible to modify the payback method to accommodate this
requirement. Cash flows arising from a project could be discounted, using the cost of
finance as the appropriate discount rate, in the same way as with the NPV and IRR methods.
The discounted payback approach is used by some businesses and represents an improve-
ment on the original approach described in the chapter. However, it still retains the other
flaws of the original payback approach that were discussed: for example, it ignores relevant
data after the payback period. Thus, even in its modified form, the PP method cannot be
regarded as superior to NPV.
The IRR method does appear to be preferred to the NPV method among many practising
managers. The main reasons for this seem to be as follows:
l A preference for a percentage return ratio rather than an absolute figure as a means of
expressing the outcome of a project. This preference for a ratio may reflect the fact that
8.3
8.2
8.1
Chapter 8
7.4
APPENDIX C SOLUTIONS TO REVIEW QUESTIONS
476
Z03_ATRI3622_06_SE_APP3.QXD 5/29/09 10:43 AM Page 476
other financial goals of the business are often set in terms of ratios (for example, return
on capital employed).
l A preference for ranking projects in terms of their percentage return. Managers feel it is
easier to rank projects on the basis of percentage returns (though NPV outcomes should
be just as easy for them). We saw in the chapter that the IRR method could provide mis-
leading advice on the ranking of projects, and the NPV method was preferable for this
purpose.
Cash flows are preferred to profit flows because cash is the ultimate measure of economic
wealth. Cash is used to acquire resources and for distribution to shareholders. When cash is
invested in an investment project an opportunity cost is incurred, as the cash cannot be
used in other investment projects. Similarly, when positive cash flows are generated by the
project it can be used to reinvest in other investment projects.
Profit, on the other hand, is relevant to reporting the productive effort for a period.
This measure of effort may have only a tenuous relationship to cash flows for a period. The
conventions of accounting may lead to the recognition of gains and losses in one period
and the relevant cash inflows and outflows occurring in another period.
The objective of strategic management accounting (SMA) is to provide information to man-
agers that will help them to run the business in a way that will work towards achievement
of the business’s strategic objectives. Traditional management accounting is not necessarily
so much different, but lacks the clear focus on achievement of strategic objectives.
Given its focus, SMA necessarily needs to be more outward looking and more customer
oriented than the traditional approach. It also needs to focus on beating the competition.
Finally, it must monitor the business’s strategies and be concerned with bringing these to a
successful conclusion.
Possible reasons for Customer A being preferred to Customer B include:
l A may place fewer orders than B, so saving the business’s order handling costs.
l A may have the service provided in larger quantities than B. This might lead to savings
in travel costs or similar, if the service is provided on the customers’ premises.
l A may require fewer visits by sales representatives than B.
l A may be a quicker payer than B, assuming that sales are on credit.
There may well be other possibilities.
Shareholder value analysis is based on the principle that there are just a few key value
drivers that generate shareholder value, for example, investment in working capital. If man-
agers are focused on maximising performance with each of these so-called value drivers, the
maximum increase in shareholder wealth will be generated. This can be used to relate the
objectives of individual managers throughout the business to the primary objective for
the business as a whole. This should lead to managers working directly towards shareholder
value enhancement. It is claimed that more traditional approaches to management target
setting tend not always to lead to the desired outcome for the business as a whole.
The four main areas in the balanced scorecard are:
1 Financial. Here targets for measures such as return on capital employed will be stated.
2 Customer. Here the market/customers that the business will aim for is established, as will
be targets for such things as measures of customer satisfaction and rate of growth in cus-
tomer numbers.
9.4
9.3
9.2
9.1
Chapter 9
8.4
SOLUTIONS TO REVIEW QUESTIONS
477
Z03_ATRI3622_06_SE_APP3.QXD 5/29/09 10:43 AM Page 477
3 Internal business process. Here the processes that are vital to the business will be estab-
lished. This might include levels of innovation, types of operation and after-sales service.
4 Learning and growth. In this area issues relating to growing the business and development
of staff are identified and targets set.
Reporting non-financial measures may pose a number of problems. These include:
l resistance to the introduction of new measures (and, by implication, new ways of being
assessed);
l scepticism of proposed measures (the latest ‘flavour of the month’);
l the cost of reporting new measures;
l data integrity (the lack of common measurement bases and objectivity associated with
many non-financial measures);
l the difficulty of measuring the benefits (for example, establishing the link between a
particular non-financial measure and the achievement of business objectives).
Four possible measures may include:
l Sales per employee
l Output per employee
l Total output during the period
l Sales to assets employed.
Other measures may have been suggested which are equally valid.
Three non-financial measures might include:
l Turnover of staff during period
l New clients obtained during period
l Level of client satisfaction during period.
We saw in the chapter that negotiated prices can create problems for both the efficient use
of resources and divisional autonomy. They can also tie up central management in arbitra-
tional matters and deflect them from their more strategic role. This method is best used
when there is an external market for the services or goods of both buying and selling divi-
sions and when divisional managers are free to reject offers made by other divisions.
Market-based prices are, generally speaking, more appropriate as they reflect the oppor-
tunity cost of the goods. However, where the division is operating below capacity, a variable-
cost-based approach is more appropriate.
Although the credit manager is responsible for ensuring that receivables pay on time,
Tariq may be right in denying blame. Various factors may be responsible for the situation
described which are beyond the control of the credit manager. These include:
l a downturn in the economy leading to financial difficulties among trade receivables;
l decisions by other managers within the business to liberalise credit policy in order to
stimulate sales;
l an increase in competition among suppliers offering credit, which is being exploited by
customers;
11.1
Chapter 11
10.4
10.3
10.2
10.1
Chapter 10
APPENDIX C SOLUTIONS TO REVIEW QUESTIONS
478
Z03_ATRI3622_06_SE_APP3.QXD 5/29/09 10:43 AM Page 478
l disputes with customers over the quality of goods or services supplied;
l problems in the delivery of goods leading to delays.
You may have thought of others.
The level of inventories held will be affected in the following ways.
(a) An increase in production bottlenecks is likely to result in an increase in raw materials
and work in progress being processed within the plant. Therefore, levels of inventories
should rise.
(b) A rise in interest rates will make holding inventories more expensive if they are financed
by debt. This may, in turn, lead to a decision to reduce inventory levels.
(c) The decision to reduce the range of products should result in fewer inventories being
held. It would no longer be necessary to hold certain items in order to meet customer
demand.
(d) Switching to a local supplier may reduce the lead time between ordering an item and
receiving it. This should, in turn, reduce the need to carry such high levels of the par-
ticular item.
(e) A deterioration in the quality of bought-in items may result in the purchase of higher
quantities of inventories in order to take account of the defective element in invent-
ories acquired and, perhaps, an increase in the inspection time for items received. This
would lead to a rise in inventory levels.
Inventories are held:
l to meet customer demand,
l to avoid the problems of running out of inventories, and
l to take advantage of profitable opportunities (for example, buying a product that is
expected to rise steeply in price in the future).
The first reason may be described as transactionary, the second precautionary and the third
speculative. They are, in essence, the same reasons why a business holds cash.
(a) The costs of holding too little cash are:
l failure to meet obligations when they fall due which can damage the reputation of
the business and may, in the extreme, lead to the business being wound up;
l having to borrow and thereby incur interest charges;
l an inability to take advantage of profitable opportunities.
(b) The costs of holding too much cash are:
l failure to use the funds available for more profitable purposes;
l loss of value during a period of inflation.
11.4
11.3
11.2
SOLUTIONS TO REVIEW QUESTIONS
479
Z03_ATRI3622_06_SE_APP3.QXD 5/29/09 10:43 AM Page 479
Appendix D
Solutions to selected exercises
Strategic management involves five steps:
1 Establish mission and objectives. The mission statement is usually a brief statement of the
overall aims of the business. The objectives are rather more specific than the mission and
need to be both quantifiable and consistent with the mission or aims.
2 Undertake a position analysis. Here the business is seeking to establish how it is placed rela-
tive to its environment (competitors, markets, technology, the economy, political cli-
mate and so on), given the business’s mission and objectives. This is often approached
within the framework of an analysis of the business’s strengths, weaknesses, opportuni-
ties and threats (a SWOT analysis). Strengths and weaknesses are internal factors that are
attributes of the business itself, whereas opportunities and threats are factors expected to
be present in the environment in which the business operates. The SWOT framework is
not the only possible approach to undertaking a position analysis, but it seems to be a
very popular one.
3 Identify and assess the strategic options. This involves attempting to identify possible
courses of action that will enable the business to reach its objectives in the light of the
position analysis undertaken in Step 2.
4 Select strategic options and formulate plans. Here the business will select what seems to be
the best of the courses of action or strategies (identified in Step 3) and will formulate a
strategic plan in the form of long- and short-term budgets.
5 Perform, review and control. Here the business pursues the plans derived in Step 4, using
the traditional approach to compare actual performance against budgets, seeking to
control where actual performance appears not to be matching plans.
SWOT analysis of Jones Dairy Ltd
Strengths
l A portfolio of identifiable customers who show some loyalty to the business.
l Good cash flow profile. Though credit will be given, a week is the normal credit period.
l An apparently sound distribution system.
l A monopoly of doorstep delivery in the area.
l Barriers to entry. There are probably relatively high fixed costs, which implies a ‘critical
mass’ of volume is necessary.
l Good employees and ease of recruitment.
l Differentiated product; clearly different from what is supplied by the supermarket in that
it is delivered to the door.
l Apparently good marketing, since the decline in business is less than the national average.
l Good knowledge of the local market.
1.2
1.1
Chapter 1
Z04_ATRI3622_06_SE_APP4.QXD 5/29/09 10:43 AM Page 480
l Tendency for people to shop infrequently means that doorstep delivery may be the only
practical means of having fresh milk.
Weaknesses
l Ageing managers.
l Success might be dependent on the present management continuing to manage.
l Narrow product range.
l High price necessary to generate acceptable level of profit.
l Available substitute – that is, non-delivered milk.
l High operating gearing (probably) means that profit suffers disproportionately with a
downturn in demand. (This point will be considered in Chapter 3.)
l Single supplier.
Opportunities
l Possibility of extending the product range to include other dairy and non-dairy products
to existing customers.
l Possible geographical expansion to cover other local towns and villages.
l Possibly move to act as a wholesaler to local stores at differentiated prices. It is probable
that the bottlers would supply Jones more cheaply than they would supply individual
small stores.
l Using plant for some other purpose, such as leasing cold store facilities.
Threats
l Apparently strong trend against doorstep delivery driven by price differential.
l Trend away from dairy products for health/cultural reasons.
l The probability that Jones is entirely dependent on the only local bottler. More geo-
graphically remote bottlers may not be prepared to supply at an acceptable price.
l Increasing strength of supermarket buying power.
Lombard Ltd
Relevant costs of undertaking the contract are:
£
Equipment costs 200,000
Component X (20,000 × 4 × £5)
Any of these components used will need to be replaced. 400,000
Component Y (20,000 × 3 × £8)
All of the required units will come from inventories and this
will be an effective cost of the net realisable value. 480,000
Additional costs (20,000 × £8) 160,000
1,240,000
Revenue from the contract (20,000 × £80) 1,600,000
Thus, from a purely financial point of view the project is acceptable. (Note that there is no
relevant labour cost since the staff concerned will be paid irrespective of whether the con-
tract is undertaken.)
2.1
Chapter 2
SOLUTIONS TO SELECTED EXERCISES
481
Z04_ATRI3622_06_SE_APP4.QXD 5/29/09 10:43 AM Page 481
The local authority
(a) Net benefit of accepting the touring company proposal
£
Net reduction in ticket revenues (see workings below) (20,000)
Savings on: Costumes 5,600
Scenery 3,300
Casual staff 3,520
Net deficit (7,580)
Since there is a net deficit, on financial grounds, the touring company’s proposal should
be rejected.
Note that all of the following are irrelevant, because they will occur irrespective of
the decision:
l non-performing staff salaries
l artistes’ salaries
l heating and lighting
l administration costs
l refreshment revenues and costs
l programme advertising.
Workings
Normal ticket sales revenue:
£
200 @ £24 = 4,800
500 @ £16 = 8,000
300 @ £12 = 3,600
16,400
Ticket revenue at 50 per cent capacity for 20 performances:
(£16,400 × 50% × 20) £164,000
Touring company ticket sales:
Total revenue for each performance for a full house:
£
200 @ £22 = 4,400
500 @ £14 = 7,000
300 @ £10 = 3,000
14,400
£
Ticket revenues (£14,400 × 10 × 50%) 72,000
(£14,400 × 15 ×
2
/3 × 50%) 72,000
144,000
Net loss of revenue (£164,000 − £144,000) = £20,000
(b) Other possible factors to consider include:
l The reliability of the estimations, including the assumption that the level of occupancy
will not alter programme and refreshment sales revenue.
l A desire to offer theatregoers the opportunity to see another group of players.
l Dangers of loss of morale of staff not employed, or employed to do other than their
usual work.
2.2
APPENDIX D SOLUTIONS TO SELECTED EXERCISES
482
Z04_ATRI3622_06_SE_APP4.QXD 5/29/09 10:43 AM Page 482
Andrews and Co. Ltd
Minimum contract price
£
Materials Steel core: 10,000 × £2.10 21,000
Plastic: 10,000 × 0.10 × £0.10 100
Labour Skilled: –
Unskilled: 10,000 ×
5
/60 × £7.50 6,250
Minimum tender price 27,350
The local education authority
(a) One-off financial net benefits of closing:
D only A and B A and C
Capacity reduction 800 700 800
£m £m £m
Property developer (A) – 14.0 14.0
Shopping complex (B) – 8.0 –
Property developer (D) 9.0 – –
Safety (C) – – 3.0
Adapt facilities (1.8) – –
Total 7.2 22.0 17.0
Ranking based on total one-off benefits 3 1 2
(Note that all past costs of buying and improving the schools are irrelevant.)
Recurrent financial net benefits of closing:
D only A and B A and C
£m £m £m
Rent (C) – – 0.3
Administrators 0.2 0.4 0.4
Total 0.2 0.4 0.7
Ranking based on total of recurrent benefits 3 2 1
On the basis of the financial figures alone, closure of either A and B or A and C looks
best. It is not possible to add the one-off and the recurring costs directly, but the large
one-off cost saving associated with closing schools A and B makes this option look
attractive. (In Chapter 8 we shall see that it is possible to add one-off and recurring costs
in a way that should lead to sensible conclusions.)
(b) The costs of acquiring and improving the schools in the past are past costs or sunk costs
and, therefore, irrelevant. The costs of employing the chief education officer is a future
cost, but irrelevant because it is not dependent on outcomes, it is a common cost.
(c) There are many other factors, some of a non-quantifiable nature. These include:
l Accuracy of projections of capacity requirements.
l Locality of existing schools relative to where potential pupils live.
l Political acceptability of selling schools to property developers.
l Importance of purely financial issues in making the final decision.
l The quality of the replacement sporting facilities compared with those at school D.
l Political acceptability of staff redundancies.
l Possible savings/costs of employing fewer teachers, which might be relevant if eco-
nomies of scale are available by having fewer schools.
l Staff morale.
2.6
2.3
SOLUTIONS TO SELECTED EXERCISES
483
Z04_ATRI3622_06_SE_APP4.QXD 5/29/09 10:43 AM Page 483
Rob Otics Ltd
(a) The minimum price for the proposed contract would be:
£
Materials
Component X (2 × 8 × £180) 2,880
If the 16 units of this component are used on the proposed
contract, the business will need to buy an additional
16 units at the new price.
Component Y 0
The history of the components held in inventories is irrelevant
because it applies irrespective of the decision made on this
contract. Since the alternative to using the units on this
contract is to scrap them, the relevant cost is zero.
Component Z [(75 + 32) × £20] − (75 × £25) 265
The relevant cost here is how much extra the business will
pay the supplier as a result of undertaking the contract.
Other miscellaneous items 250
Labour
Assembly (25 + 24 + 23 + 22 + 21 + 20 + 19 + 18) × £48 8,256
The assembly labour cost is irrelevant because it will be
incurred irrespective of which work the members of staff do.
The relevant cost is based on the sales revenue per hour
lost if the other orders are lost less the material cost per hour
saved; that is £60 − £12 = £48.
Inspection (8 × 6 × £12 × 150%) 864
Total 12,515
Thus the minimum price is £12,515.
(b) Other factors include:
l Competitive state of the market.
l The fact that the above figure is unique to the particular circumstances at the time
– for example, having component Y available but having no use for it. Any sub-
sequent order might have to take account of an outlay cost.
l Breaking even (that is, just covering the costs) on a contract will not fulfil the busi-
ness’s objective.
l Charging a low price may cause marketing problems. Other customers may resent the
low price for this contract. The current enquirer may expect a similar price in future.
Motormusic Ltd
(a) Break-even point = fixed costs/contribution per unit
= (80,000 + 60,000)/[60 − (20 + 14 + 12 + 3)] = 12,727 radios.
These would have a sales value of £763,620 (that is, 12,727 × £60).
(b) The margin of safety is 7,273 radios (that is, 20,000 − 12,727). This margin would have
a sales value of £436,380 (that is, 7,273 × £60).
3.4
Chapter 3
2.7
APPENDIX D SOLUTIONS TO SELECTED EXERCISES
484
Z04_ATRI3622_06_SE_APP4.QXD 5/29/09 10:43 AM Page 484
Products A, B and C
(a) Total time required on cutting machines is:
(2,500 × 1.0) + (3,400 × 1.0) + (5,100 × 0.5) = 8,450 hours
Total time available on cutting machines is 5,000 hours. Therefore, this is a limiting
factor.
Total time required on assembling machines is:
(2,500 × 0.5) + (3,400 × 1.0) + (5,100 × 0.5) = 7,200 hours
Total time available on assembling machines is 8,000 hours. Therefore, this is not a
limiting factor.
ABC
(per unit) (per unit) (per unit)
£££
Selling price 25 30 18
Variable materials (12) (13) (10)
Variable production costs (7) (4) (3 )
Contribution 6 13 5
Time on cutting machines 1.0 hour 1.0 hour 0.5 hour
Contribution per hour on cutting machines £6 £13 £10
Order of priority 3rd 1st 2nd
Therefore, produce:
3,400 product B using 3,400 hours
3,200 product C using 1,600 hours
5,000 hours
(b) Assuming that the business would make no saving in variable production costs by sub-
contracting, it would be worth paying up to the contribution per unit (£5) for product C,
which would therefore be £5 × (5,100 − 3,200) = £9,500 in total.
Similarly it would be worth paying up to £6 per unit for product A – that is, £6 ×
2,500 = £15,000 in total.
Darmor Ltd
(a) Contribution per hour of skilled labour of product X is
= £14
Given the scarcity of skilled labour, if the management is to be indifferent between the
products, the contribution per skilled labour hour must be the same. Thus for product
Y the selling price must be
[£(14 × (9/12)) + 9 + 4 + 25 + 7] = £55.50
(that is, the contribution plus the variable costs), and for product Z the selling price
must be
[£(14 × (3/12)) + 3 + 10 + 14 + 7] = £37.50
(b) The business could pay up to £26 an hour (£12 + £14) for additional hours of skilled
labour. This is the potential contribution per hour, before taking account of the labour
rate of £12 an hour.
£(30 − 6 − 2 − 12 − 3)
(6/12)
3.6
3.5
SOLUTIONS TO SELECTED EXERCISES
485
Z04_ATRI3622_06_SE_APP4.QXD 5/29/09 10:43 AM Page 485
Intermediate Products Ltd
(a)
ABCD
Total costs per unit (£) (65) (41) (36) (46)
Less Fixed costs (£) 20 8 8 12
Variable cost per unit (£) (45) (33) (28) (34)
Buying/selling price per unit (£) 70 45 40 55
Contribution per unit (£) 25 12 12 21
Hours on special machine 0.5 0.4 0.5 0.3
Contribution per hour (£) 50 30 24 70
Order of preference 2nd 3rd 4th 1st
Optimum use of hours on special machine Balance of hours
D 3,000 × 0.3 = 900 5,100 (that is, 6,000 − 900)
A 5,000 × 0.5 = 2,500 2,600 (that is, 5,100 − 2,500)
B 6,000 × 0.4 = 2,400 200 (that is, 2,600 − 2,400)
C400 × 0.5 = 200
6,000
Therefore, make all of the demand for Ds, As and Bs plus 400 (of 4,000) Cs.
(b) The contribution per hour from Cs is £24, and so this is the maximum amount per hour
that it would be worth paying to rent the machine, for a maximum of 1,800 hours (that
is, 3,600 × 0.5, the time necessary to make the remaining demand for Cs).
(c) Other possible actions to overcome the shortage of machine time include the following:
l Alter the design of the products to avoid the use of the special machine.
l Increase the selling price of the product so that the demand will fall, making the
available machine time sufficient but making production more profitable.
Gandhi Ltd
(a) Given that the spare capacity could not be used by other services, the standard service
should continue to be offered. This is because it renders a positive contribution.
(b) The standard service renders a contribution per unit of £15 (that is, £80 − £65), or £30
during the time it would take to render one unit of the nova service. The nova service
would provide a contribution of only £25 (that is, £75 − £50).
The nova service should, therefore, not replace the standard service.
(c) Under the original plans, the following contributions would be rendered by the basic
and standard services:
£
Basic 11,000 × (£50 − £25) = 275,000
Standard 6,000 × (£80 − £65) = 90,000
365,000
If the basic were to take the standard’s place, 17,000 units (that is, 11,000 + 6,000) of
them could be produced in total. To generate the same total contribution, each unit
of the standard service would need to provide £21.47 (that is, £365,000/17,000) of con-
tribution. Given the basic’s variable cost of £25, this would mean a selling price of
£46.47 each (that is, £21.47 + £25.00).
3.8
3.7
APPENDIX D SOLUTIONS TO SELECTED EXERCISES
486
Z04_ATRI3622_06_SE_APP4.QXD 5/29/09 10:43 AM Page 486
Promptprint Ltd
(a) The plan (budget) may be summarised as:
£
Sales revenue 196,000
Direct materials (38,000)
Direct labour (32,000)
Total indirect cost (77,000) (2,400 + 3,000 + 27,600 + 36,000 + 8,000)
Profit 49,000
The job may be priced on the basis that both indirect cost and profit should be appor-
tioned to it on the basis of direct labour cost, as follows:
£
Direct materials 4,000
Direct labour 3,600
Overheads 8,663 (£77,000 × 3,600/32,000)
Profit 5,513 (£49,000 × 3,600/32,000)
21,776
This answer assumes that variable overheads vary in proportion to direct labour cost.
Various other bases of charging overheads and profit loading the job could have been
adopted. For example, materials cost could have been included (with direct labour) as
the basis for profit loading, or even apportioning overheads.
(b) This part of the question is, in effect, asking for comments on the validity of ‘full cost-
plus’ pricing. This approach can be useful as an indicator of the effective long-run cost
of doing the job. On the other hand, it fails to take account of relevant opportunity
costs as well as the state of the market and other external factors. For example, it ignores
the price that a competitor printing business may quote.
(c) Revised estimates of direct material cost for the job:
£
Paper grade 1 1,500 (£1,200 × 125%) (this item of inventories needs to be replaced)
Paper grade 2 0 (it has no opportunity cost value)
Card 510 (£640 − £130: using the card on another job would save
£640, but cost £130 to achieve that saving)
Inks and so on 300 (this item of inventories needs to be replaced)
2,310
Bookdon plc
(a) To answer this question, we need first to allocate and apportion the overheads to
product cost centres, as follows:
4.5
4.4
Chapter 4
SOLUTIONS TO SELECTED EXERCISES
487
Z04_ATRI3622_06_SE_APP4.QXD 5/29/09 10:43 AM Page 487
APPENDIX D SOLUTIONS TO SELECTED EXERCISES
488
Cost Basis of Total Department
apportionment
Machine Fitting Canteen Machine
shop section main’ce
section
£££££
Allocated items Specific 90,380 27,660 19,470 16,600 26,650
Rent, rates, Floor area 17,000 9,000 3,500 2,500 2,000
heat, light (3,600/ (1,400/ (1,000/ (800/
6,800) 6,800) 6,800) 6,800)
Dep’n and Book value 25,000 12,500 6,250 2,500 3,750
insurance (150/300) (75/300) (30/300) (45/300)
132,380 49,160 29,220 21,600 32,400
Canteen Number of
employees – 10,800 8,400 (21,600) 2,400
(18/36) (14/36) (4/36)
132,380 59,960 37,620 – 34,800
Machine Specified % – 24,360 10,440 – (34,800)
maintenance (70%) (30%)
section
132,380 84,320 48,060 – –
Note that the canteen overheads were reapportioned to the other cost centres first
because the canteen renders a service to the machine maintenance section but does not
receive a service from it.
Calculation of the overhead absorption (recovery) rates can now proceed:
(i) Total budgeted machine hours are:
Hours
Product X (4,200 × 6) 25,200
Product Y (6,900 × 3) 20,700
Product Z (1,700 × 4) 6,800
52,700
Overhead absorption rate for the machine shop is:
= £1.60/machine hour
(ii) Total budgeted direct labour cost for the fitting section is:
£
Product X (4,200 × £12) 50,400
Product Y (6,900 × £3) 20,700
Product Z (1,700 × £21) 35,700
106,800
Overhead absorption rate for the fitting section is:
× 100% = 45% or £0.45 per £ of direct labour cost.
£48,060
£106,800
£84,320
52,700
Z04_ATRI3622_06_SE_APP4.QXD 5/29/09 10:43 AM Page 488
(b) The cost of one unit of product X is calculated as follows:
£
Direct materials 11.00
Direct labour
Machine shop 6.00
Fitting section 12.00
Overheads
Machine shop (6 × £1.60) 9.60
Fitting section (£12 × 45%) 5.40
44.00
Therefore, the cost of one unit of product X is £44.00.
Products A, B and C
Allocation and apportionment of overheads to product cost centres
Basis of Department
apportionment
Cutting Machining Pressing Engineering Personnel
££££ £
Total 154,482 64,316 58,452 56,000 34,000
Personnel Specified 18,700 (55%) 3,400 (10%) 6,800 (20%) 5,100 (15%) (34,000)
173,182 67,716 65,252 61,100 –
Engineering Specified 12,220 (20%) 27,495 (45%) 21,385 (35%) (61,100)
185,402 95,211 86,637 – –
Note that the personnel overheads were reapportioned to the other cost centres first because
the canteen renders a service to the engineering department section, but does not receive a
service from it.
Calculation of the overhead absorption (recovery) rates
In both the cutting and pressing departments, no machines seem to be used, and so a direct
labour hour basis of overhead absorption seems reasonable.
In the machining department, machine hours are far in excess of labour hours and the
overheads are probably machine-related. In this department, machine hours seem a fair
basis for cost units to absorb overheads.
Total planned direct labour hours for the cutting department are thus:
Product A 4,000 × (3 + 6) = 36,000
Product B 3,000 × (5 + 1) = 18,000
Product C 6,000 × (2 + 3) = 30,000
84,000
The overhead absorption rate for the cutting department is £185,402/84,000 = £2.21 per
direct labour hour.
Total planned machine hours for the machining department are thus:
Product A 4,000 × 2.0 = 8,000
Product B 3,000 × 1.5 = 4,500
Product C 6,000 × 2.5 = 15,000
27,500
The overhead absorption rate for the machining department is £95,211/27,500 = £3.46 per
machine hour.
4.6
SOLUTIONS TO SELECTED EXERCISES
489
Z04_ATRI3622_06_SE_APP4.QXD 5/29/09 10:43 AM Page 489
Total planned direct labour hours for the pressing department are:
Product A 4,000 × 2 = 8,000
Product B 3,000 × 3 = 9,000
Product C 6,000 × 4 = 24,000
41,000
The overhead absorption rate for the cutting department = £86,637/41,000 = £2.11 per direct
labour hour.
(a) Cost of one completed unit of product A:
£
Direct materials 7.00
Direct labour
Cutting department – skilled (3 × £16) 48.00
– unskilled (6 × £10) 60.00
Machining department (0.5 × £12) 6.00
Pressing department (2 × £12) 24.00
Overheads
Cutting department (9 × £2.21) 19.89
Machining department (2 × £3.46) 6.92
Pressing department (2 × £2.11) 4.22
176.03
(b) Cost of one uncompleted unit of product B:
£
Direct materials 4.00*
Direct labour
Cutting department – skilled (5 × £16) 80.00
– unskilled (1 × £10) 10.00
Machining department (0.25 × £12) 3.00
Overheads
Cutting department (6 × £2.21) 13.26
Machining department (1.5 × £3.46) 5.19
115.45
* This assumes that all of the materials are added in the cutting or machining departments.
Offending phrases and explanations
Offending phrase
‘Necessary to divide up the
business into departments’
‘Fixed costs (or overheads)’
4.7
APPENDIX D SOLUTIONS TO SELECTED EXERCISES
490
Explanation
This can be done but it will not always be of much
benefit. Only in quite restricted circumstances will it
give significantly different job costs.
This implies that fixed costs and overheads are the same
thing. They are not really connected with one another.
‘Fixed’ is to do with how costs behave as the level of
output is raised or lowered; ‘overheads’ are to do with
the extent to which costs can be directly measured in
respect of a particular unit of output. Though it is true
that many overheads are fixed, not all are. Also, direct
labour is usually a fixed cost.
Z04_ATRI3622_06_SE_APP4.QXD 5/29/09 10:43 AM Page 490
‘Usually this is done on the
basis of area’
‘When the total fixed cost
for each department has
been identified, this will be
divided by the number of
hours that were worked’
‘It is essential that this
approach is taken in order
to deduce a selling price’
(a) Charging overheads to jobs on a departmental basis means that overheads are collected
‘product’ cost centre (department) by ‘product’ cost centre. This involves picking up the
overheads that are direct to each department and adding to them a share of overheads
that are general to the business as a whole. The overheads of ‘service’ cost centres must
then be apportioned to the product cost centres. At this point, all of the overheads for
the whole business are divided between the ‘product’ cost centres, such that the sum of
the ‘product’ cost centre overheads equals those for the whole business.
Dealing with overheads departmentally is believed to provide more fair and useful
information to decision makers, because different departments may have rather differ-
ent overheads, and applying overheads departmentally can take account of that and
reflect it in job costs.
In theory, dealing with overheads on a departmental basis is more costly than on a
business-wide basis. In practice, it possibly does not make too much difference to the
cost of collecting the information. This is because, normally, businesses are divided into
departments, and the costs are collected departmentally, as part of the normal routine
for exercising control over the business.
(b) In order to make any difference to the job cost that will emerge as a result of dealing
with overheads departmentally, as compared with doing so on a business-wide basis,
the following both need to be the case:
l the overheads per unit of the basis of charging (for example direct labour hours) need
to be different from one department to the next; and
l the proportion (but not the actual amounts) of total overheads that are charged to
jobs must differ from one job to the next.
Assume, for the sake of argument, that direct labour hours are used as the basis of
charging overheads in all departments. Also assume that there are three departments,
A, B and C.
There will be no difference to the overheads charged to a particular job if the rate
of overheads per direct labour hour is the same for all departments. Obviously, if the
4.8
SOLUTIONS TO SELECTED EXERCISES
491
All of the other references to fixed and variable costs
are wrong. The person should have referred to indirect
and direct costs.
Where overheads are apportioned to departments, they
will be apportioned on some logical basis. For certain
costs – for example, rent – the floor area may be the
most logical; for others, such as machine maintenance
costs, the floor area would be totally inappropriate.
Where overheads are dealt with on a departmental basis,
they may be divided by the number of direct labour
hours to deduce a recovery rate. However, this is only
one basis of applying overheads to jobs. For example,
machine hours or some other basis may be more
appropriate to the particular circumstances involved.
It is relatively unusual for the ‘job cost’ to be able to
dictate the price at which the manufacturer can price its
output. For many businesses, the market dictates the price.
Z04_ATRI3622_06_SE_APP4.QXD 5/29/09 10:43 AM Page 491
charging rate is the same in all departments, that same rate must also apply to the busi-
ness taken as a whole.
Also, even where overheads per direct labour hour differ significantly from one
department to another, if all jobs spend, say, about 20 per cent of their time in
Department A, 50 per cent in Department B and 30 per cent in Department C, it will
not make any difference whether overheads are charged departmentally or overall.
These conclusions are not in any way dependent on the basis of charging overheads
or even whether overheads are charged on the same basis in each department.
The statements above combine to mean that, probably in many cases in practice,
departmentalising overheads is not providing information that is significantly different
from that which would be provided by charging overheads to jobs on a business-wide
basis.
Woodner Ltd
AB C DE F G H
Output Sales price Total sales Marginal Total Total cost Marginal Profit/(loss)
per unit revenue unit sales variable (variable cost
(A × B) revenue cost cost + per unit
(A × £20) £2,500)
units £ £ £ £ £ £ £
0 0 0 0 0 2,500 – (2,500)
10 95 950* 95
†
200 2,700 20 (1,750)
20 90 1,800 85 400 2,900 20 (1,100)
30 85 2,550 75 600 3,100 20 (550)
40 80 3,200 65 800 3,300 20 (100)
50 75 3,750 55 1,000 3,500 20 250
60 70 4,200 45 1,200 3,700 20 500
70 65 4,550 35 1,400 3,900 20 650
80 60 4,800 25 1,600 4,100 20 700
90 55 4,950 15 1,800 4,300 20 650
100 50 5,000 5 2,000 4,500 20 500
* (10 × £95)
†
((950 − 0)/(10 − 0))
An output of 80 units each week will maximise profit at £700 a week. This is the nearest,
given the nature of the input data, to the level of output where marginal cost per unit equals
marginal revenue per unit. (For the mathematically minded, calculus could have been used
to find the point at which slopes of the total sales revenue and total cost lines were equal.)
Cost-plus pricing
Cost-plus pricing means that prices are based on calculations/assessments of how much it
costs to produce the good or service, and includes a margin for profit. ‘Cost’ in this context
might mean relevant cost, variable cost, direct cost or full cost. Usually cost-plus prices are
based on full costs. These full costs might be derived using a traditional or an ABC approach.
If a business charges the full cost of its output as a selling price, it will in theory break
even. This is because the sales revenue will exactly cover all of the costs. Charging some-
thing above full cost will yield a profit. Thus, in theory, cost-plus pricing is logical.
5.2
5.1
Chapter 5
APPENDIX D SOLUTIONS TO SELECTED EXERCISES
492
Z04_ATRI3622_06_SE_APP4.QXD 5/29/09 10:43 AM Page 492
If a cost-plus approach to pricing is to be taken, the issue that must be addressed is the
level of profit required from each unit sold. This must logically be based on the total profit
that is required for the period. Normally, businesses seek to enhance their wealth through
trading. The extent to which they expect to do this is normally related to the amount of
wealth that is invested to promote wealth enhancement. Businesses tend to seek to produce
a particular percentage increase in wealth. In other words, they seek to generate a particu-
lar return on capital employed. It seems logical, therefore, that the profit loading on full
cost should reflect the business’s target profit and that the target should itself be based on
a target return on capital employed.
An obvious problem with cost-plus pricing is that the market may not agree with the
price. Put another way, cost-plus pricing takes no account of the market demand function
(the relationship between price and quantity demanded). A business may fairly deduce the
full cost of some product and then add what might be regarded as a reasonable level of
profit, only to find that a rival producer is offering a similar product for a much lower price,
or that the market simply will not buy at the cost-plus price.
Most suppliers are not strong enough in the market to dictate pricing; most are ‘price
takers’, not ‘price makers’. They must accept the price offered by the market or they do not
sell any of their wares. Cost-plus pricing may be appropriate for price makers, but it has less
relevance for price takers.
The cost-plus price is not entirely useless to price takers, however. When contemplating
entering a market, knowing the cost-plus price will tell the price taker whether it can pro-
fitably enter the market or not. As has been said above, the full cost can be seen as a long-
run break-even selling price. If entering a market means that this break-even price, plus an
acceptable profit, cannot be achieved, then the business should probably stay out. Having
a breakdown of the full cost may put the business in a position to examine where costs
might be capable of being cut in order to bring the full cost-plus profit to within a figure
acceptable to the market.
Being a price maker does not always imply that the business dominates a particular
market. Many small businesses are, to some extent, price makers. This tends to be where
buyers find it difficult to make clear distinctions between the prices offered by various sup-
pliers. An example of this might be a car repair. Though it may be possible to obtain a series
of binding estimates for the work from various garages, most people would not normally do
so. As a result, garages normally charge cost-plus prices for car repairs.
Kaplan plc
(a) The business makes each model of suitcase in a batch. The direct materials and labour
costs will be recorded in respect of each batch. To these costs will be added a share
of the overheads of the business for the period in which production of the batch takes
place. The basis of the batch absorbing overheads is a matter of managerial judgement.
Direct labour hours spent working on the batch, relative to total direct labour hours
worked during the period, is a popular method. This is not the ‘correct’ way, however.
There is no correct way. If the activity is capital-intensive, some machine hour basis
of dealing with overheads might be more appropriate, though still not ‘correct’.
Overheads might be collected, cost centre by cost centre (department by department),
and charged to the batch as it passes through each product cost centre. Alternatively,
all of the overheads for the entire production facility might be totalled and the over-
heads dealt with more globally. It is only in restricted circumstances that overheads
charged to batches will be affected by a decision to deal with them by cost centres,
rather than globally.
Once the ‘full cost’ (direct costs plus a share of indirect costs) has been ascertained
for the batch, the cost per suitcase can be established by dividing the batch cost by the
number in the batch.
5.3
SOLUTIONS TO SELECTED EXERCISES
493
Z04_ATRI3622_06_SE_APP4.QXD 5/29/09 10:43 AM Page 493
(b) The uses to which full cost information can be put have been identified as:
l For pricing purposes. In some industries and circumstances, full costs are used as the
basis of pricing. Here the full cost is deduced and a percentage is added on for profit.
This is known as cost-plus pricing. A solicitor handling a case for a client probably
provides an example of this.
In many circumstances, however, suppliers are not in a position to deduce prices
on a cost-plus basis. Where there is a competitive market, a supplier will probably
need to accept the price that the market offers – that is, most suppliers are ‘price tak-
ers’ not ‘price makers’.
l For income-measurement purposes. To provide a valid means of measuring a business’s
income, it is necessary to match expenses with the revenue realised in the same
accounting period. Where manufactured products are made or partially made in one
period but sold in the next, or where a service is partially rendered in one account-
ing period but the revenue is realised in the next, the full cost (including an appro-
priate share of overheads) must be carried from one accounting period to the next.
Unless we are able to identify the full cost of work done in one period, which is the
subject of a sale in the next, the profit figures of the periods concerned will become
meaningless.
Unless all related production costs are charged in the same accounting period as
the sale is recognised in the income statement, distortions will occur that will render
the income statement much less useful. Thus it is necessary to deduce the full cost of
any production undertaken completely or partially in one accounting period but sold
in a subsequent one.
l For budgetary planning and control. Often budgets are set in terms of full costs. If
budgets are to be used as the yardsticks that actual performance is to be assessed, the
information on actual performance must also be expressed in the same full-cost
terms. Knowing the full cost of the suitcases could be helpful in these activities.
l General decision making. Knowing the full cost of the suitcases might be helpful in
making a decision as to whether to continue to make all or some of the models. It is
argued, however, that relevant costs, which might be just the variable costs, would
provide a more helpful basis for the decision.
(c) Whereas the traditional approach to dealing with overheads is just to accept that they
exist and deal with them in a fairly broad manner, ABC takes a much more enquiring
approach. ABC takes the view that overheads do not just ‘occur’, but that they are
caused or ‘driven’ by ‘activities’. It is a matter of finding out which activities are driving
the costs and how much cost they are driving.
For example, a significant part of the costs of making suitcases of different sizes might
be resetting machinery to cope with a batch of a different size from its predecessor batch.
Where a particular model is made in very small batches, because it has only a small mar-
ket, ABC would advocate that this model is charged directly with its machine-setting
costs. The traditional approach would be to treat machine setting as a general overhead
that the individual suitcases (irrespective of the model) might bear equally. ABC, it is
claimed, leads to more accurate costing and thus to more accurate assessment of
profitability.
(d) The other advantage of pursuing an ABC philosophy and identifying cost drivers is that,
once the drivers have been identified, they are likely to become much more susceptible
to being controlled. Thus assessment by management of the benefit of certain activities
against their cost becomes more feasible.
GB Company – the International Industries (II) enquiry
(a) The minimum acceptable price of 120,000 motors to be supplied over the next four
months is:
5.6
APPENDIX D SOLUTIONS TO SELECTED EXERCISES
494
Z04_ATRI3622_06_SE_APP4.QXD 5/29/09 10:43 AM Page 494
£000
Direct materials 600 (120,000 × £5.00)
Direct labour 720 (120,000 × £6.00)
Variable manufacturing overheads 360 (120,000 × £3.00 (that is, £3.00 for half an hour))
Fixed manufacturing overheads 60 (4 × £15,000)
Total 1,740
The offer price is:
120,000 × £19.00 = £2,280,000
On this basis, the price of £19 per machine could be accepted, subject to a number of
factors identified in (b) below.
(b) The assumptions on which the above analysis and decision in (a) are based include the
following:
l That the contract can be accommodated within the 30 per cent spare capacity of
GB. If this is not so, then there will be an opportunity cost relating to lost ‘normal’
production, which must be taken account of in the decision.
l That sales commission and freight costs will not be affected by the contract.
l It is unlikely that work more remunerative to GB than the contract will be available
during the period of the contract.
There are also some strategic issues involved in the decision, including:
l The possibility that the contract could lead to other and better-remunerated work
from II.
l A problem of selling similar products in the same market at different prices. Other
customers, knowing that GB is selling at marginal prices, may make it difficult for the
business to resist demand from other customers for similarly priced output.
Sillycon Ltd
(a)
Overhead analysis
Electronics Testing Service
£000 £000 £000
Variable overheads 1,200 600 700
Apportionment of service dept (800:600) 400 300 (700)
1,600 900 –
Direct labour hours (’000) 800 600
Variable overheads per direct labour hour £2.00 £1.50
Electronics Testing Service
£000 £000 £000
Fixed overheads 2,000 500 800
Apportionment of service dept (equally) 400 400 (800)
2,400 900 –
Direct labour hours (’000) 800 600
Fixed overheads per direct labour hour £3.00 £1.50
5.7
SOLUTIONS TO SELECTED EXERCISES
495
Z04_ATRI3622_06_SE_APP4.QXD 5/29/09 10:43 AM Page 495