Food Production Approaches, Challenges and Tasks Part 11 pot
Bạn đang xem bản rút gọn của tài liệu. Xem và tải ngay bản đầy đủ của tài liệu tại đây (663.89 KB, 19 trang )
Milk Biodiversity: Future Perspectives of Milk
and Dairy Products from Autochthonous Dairy Cows Reared in Northern Italy
179
be appreciated, with the increase of free fatty acids, mainly short chain ones (Randolph and
Erwin, 1974); several fatty acids are endowed of a good antibiotic power, that can be
expressed via inhibition of enzyme/fatty acid synthesis/nutrient uptake, cell lysis,
metabolites leakage, disruption of electron transport chain, interference with oxidative
phosphorylation and lipid peroxidation (Desbois and Smith, 2010; Clément et al., 2007).
Furthermore, by enhancing the activity of stearoyl CoA desaturase (SCD), the nutritional
value of milk would be ameliorated, but the simple up-regulation of its activity seems to be
limited, as reported in a comprehensive milk lipid synthesis model (Shorten et al., 2004). In
the present research, the local breeds considered show either higher levels in cis-MUFAs or
in desaturase indices: features that are likely to be linked to genetics, as evidenced by
Schennink et al. (2008), by a complex interaction in gene/allele expressions, and that could
be used to improve the nutritional value of milk.
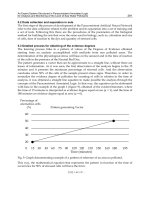
About reproduction physiology, the results obtained indicate that the reproductive
physiology of Varzese and Cabannina is characterized by an early resumption of ovarian
activity and by an early fecundation opportunity: in fact, the onset of first estrus can be
observed 20 days after birth and the opportunity to impregnate can occur in the following
cycle, i.e. approximately 40 from birth. That would allow farmers to achieve the goal of a
calf/year, as the primary indicator of welfare, reproductive efficiency and good mammary
function. According to unpublished data, obtained during trials, it could be said that
autochthonous breeds have peculiar features to solve current problems of the scenario of
high yielding dairy cows. As previously said, in the current system of cattle breeding, cows
have dramatically increased "energy and financial voracity "(diet based on starch and
protein meals, great health and structural investments due to several high recurring diseases
(Ingvartsen et al., 2003; Collard et al., 2000; Carlén et al., 2004). In post partum period,
energy needs required by high-yielding Holstein cows has increased by 25% compared to
thirty years ago, despite the considerably limited growth in muscle masses (Agnew et al.,
2003). All experts know about mobilization of various constituents from adipose tissue to
support breast functions in producing milk (Veerkamp, 1998), but few know that the muscle
is an important structure for reserves of amino acids. In highly selected cows this
phenomenon is much more marked than in cows genetically less selected (Pryce 2004). A
cow’s energy balance decreases even a couple of weeks before parturition, as a result of the
animal’s reduced ability of food ingestion. In the first weeks after birth, food ingestion
cannot compensate the wide adipose tissue mobilization. Therefore, cows maintain this
status of negative energy balance (NEB) for 5-7 weeks from birth (Grummer 2007). At the
beginning of lactation, mobilization of adipose tissue and low blood glucose bioavailability
are key events to induce metabolic syndromes (Ingvartsen et al., 2003), ketosis, liver
diseases, paretic-spastic syndromes and foot diseases (Collard et al., 2000). In autochthonous
dairy farms ketosis and other metabolic syndromes are hardly ever present: in fact, these
cows can keep up their double aptitude for maintaining a good milk production and
creating a favorable muscle mass. A feature giving Cabannina and Varzese cows an
interesting physiological ability to solve imbalances during NEB status through abundant
energy reserves (consisting of subcutaneous and inframisial adipose tissue and muscle
itself) immediately available to provide the animals with glucose and amino acids.
In conclusion, restoration of endangered niche breeds can undoubtedly give a boost to local
products and to conservation of livestock biodiversity; FAO sustains livestock biodiversity
Food Production – Approaches, Challenges and Tasks
180
as a “safety net for the future”, mainly in developing countries, as reported in a recent
document, FAO, 2010. These principles can also be extended to developed countries with
the aim to better exploit local resources and preserve relic breeds from an impending
extinction which would mean the loss of a priceless legacy. In the forthcoming years, the
peculiar nutritional and nutraceutical aspects present in milk and in dairy products deriving
from biodiversity farms will hopefully show up.
9. Acknowledgment
The authors are grateful for animal and sampling supply to Mr. Luigi Antonio Chierico, a
precursory breeder in Valle Salimbene, (Pavia, Lombardy), who runs the only and unique
bovine biodiversity farm existing in the world.
10. References
Ackman, R.G. (2002). The gas chromatograph in practical analyses of common and
uncommon fatty acids for the 21st century. Analytica Chimica Acta, Vol.465, No.1-2,
(August 2002), pp. 175-192, ISSN 0003-2670
Agnew, R.E.; Yan, T.; Murphy, J.J.; Ferris, C.P. & Gordon, F.J. .(2003). Development of
maintenance requirement and energetic efficiency for lactation from production
data of dairy cows. Livestock Production Science, Vol.82, No.(1-2), pp. 151-162, ISSN
1871-1413
Badinand, F. (1993). Involution uterine-physiologie-pathologie. Atti della Società Italiana di
Buiatria, Vol XXV, pp. 41-57, ISSN
Banks, W., Clapperton, J. L. & W. Steele. 1983. Dietary manipulation of the content and fatty
acid composition of milk fat. Proceedings of the Nutrition Society. Vol.42, No.3, pp.
399-406, ISSN 0029-6651
Bigi, D. & Zanon, A. (2008). Atlante delle razze autoctone, Edagricole, ISBN 978-88-506-5259-4,
Milano, Italia.
Carlén, E.; Strandberg, E. & Roth, A. 2004. Genetic Parameters for Clinical Mastitis, Somatic
Cell Score, and Production in the First Three Lactations of Swedish Holstein Cows.
Journal of Dairy Science, Vol.87, No.9, (September 2004), pp. 3062-3070, ISSN 0022-0302
Chilliard, Y., Ferlay, A.; Mansbridge, R.M. & Doreau, M. (2000). Ruminant milk fat
plasticity: nutritional control of saturated, polyunsaturated, trans and conjugated
fatty acids. Annales de Zootechnie, Vol.49, No.3, (November 2000), pp. 181-205, ISSN
0003-424X
Clément, M.; Tremblay, J.; Lange, M.; Thibodeau, J. & Belhumeur, P. (2007). Whey-derived
free fatty acids suppress the germination of Candida albicans in vitro. Fems Yeast
Research, Vol.7, No.2, (March 2007), pp. 276-285, ISSN 1567-1356
Collard, B.L.; Boettcher, P.J.; Dekkers, J.C.M.; Petitclerc, D. & Schaeffer, L.R. (2000).
Relationships between energy balance and health traits of dairy cattle in early
lactation. Journal of Dairy Science, Vol.83, (May 2000), pp.2683- 2690, ISSN 0022-0302
Desbois, A.P. & Smith, V.J (2010). Antibacterial free fatty acids: activities, mechanisms of
action and biotechnological potential. Applied Microbiology and Biotechnology, Vol.85,
No.6, pp. 1629-1642, ISSN 1432-0614
Milk Biodiversity: Future Perspectives of Milk
and Dairy Products from Autochthonous Dairy Cows Reared in Northern Italy
181
Elliot, K.; McMahon, K.J.; Gier, H.T. & Marion G.B. (1968). Uterus of the cow after
parturition: bacterial content. American Journal of Veterinary Research, Vol.29, pp. 77-
81, ISSN 0002-9645
Elwood, P.C.; Pickering, J.E.; Givens, D.I. & Gallacher, J.E. (2010). The consumption of milk
and dairy foods and the incidence of vascular disease and diabetes: an overview of
the evidence. Lipids, Vol.5, No.10, (March 2010), pp. 925-939, ISSN 1558-9307
Fauquant, C.; Briard, V.; Leconte, N. & Michalski, MC. (2005). Differently sized native milk
fat globules separated by microfiltration: fatty acid composition of the milk fat
globule membrane and triglyceride core. You have full text access to this content,
European Journal of Lipid Science and Technology, Vol.107, (February 2005), pp.80-86,
ISSN 1438-9312
Forcato, D.O.; Carmine, M.P. ; Echeverria, G.E.; Pecora, R.P. & Kivatinitz, S.C. (2005). Milk
fat content measurement by a simple UV spectrophotometric method: An
alternative screening method. Journal of Dairy Science, Vol.88, No.2, (February 2005),
pp.478-481, ISSN 0022-0302
Givens, D.I. (2008). Session 4: Challenges facing the food industry in innovating for health:
impact on CVD risk of modifying milk fat to decrease intake of SFA and increase
intake of cis-MUFA, Proceedings of the Nutrition Society, ISSN 0029-6651,
Symposium, Dublin, IRAN, REPUBLIQUE ISLAMIQUE (18/06/2008), pp. 419-427
Grummer, R.R. (1990). Effect of feed on the composition of milk fat. Journal of Dairy Science,
Vol.73, pp. 88, ISSN 0022-0302
Grummer, R.R. (2007). Strategies to improve fertility of high yielding dairy farms: Management
of the dry period. Theriogenology, Vol.S68, pp. S281-S288, ISSN 0093-691X
Hurtgen, J.P. & Ganiam, V.K. (1979). The effect of intrauterine and cervical manipulation on
the equine oestrous cycle and hormone profiles. Journal of Reproduction and Fertility,
Vol.27, pp. 191-197, ISSN 0022-4251
Huszar, G.; Maiocco, J. & Naftolin F. (1980). Monitoring of collagen and collagen fragments
in chromatography of protein misture. Analytical Biochemistry, Vol.105, No.1, (June
1980), pp. 424-429, ISSN 0003-2697
Ingvartsen, K.L.; Dewhurst, R.J. & Friggens, N.C. (2003). On the relationship between
lactational performance and health: is it yield or metabolic imbalance that causes
diseases in dairy cattle? A position paper. Livestock Production Science, Vol.83, pp.
277-308, ISSN 1871-1413
Kaidi, R.; Brown, P.J.; David, J.S.E.; Etherington, D.J. & Robins S.P. (1991a). Uterine collagen
during involution in cattle. Matrix, Vol.11, pp. 101-107, ISSN 1936-2994
Kaidi, R.; Brown, P.J. & David, J.S.E. (1991b). Uterine involution in cattle. Veterinary Annual,
Vol.31, pp. 39-50, ISSN 0083-5870
Lauszus, F.F.; Rasmussen, O.W.; Henriksen, J.E.; Klebe, J.G.; Jensen, L.; Lauszus, K.S. &
Hermansen, K. (2001). Effect of a high monounsaturated fatty acid diet on blood
pressure and glucose metabolism in women with gestational diabetes mellitus.
European Journal of Clinical Nutrition, Vol.55, No.6, (June 2001), pp. 436-443, ISSN
0954-3007
Lopez, C. (2005). Focus on the supramolecular structure of milk fat in dairy products.
Reproduction Nutrition Development, Vol.45, No.4, (July-August 2005), pp. 497-511,
ISSN 0926-5287
Food Production – Approaches, Challenges and Tasks
182
Lopez, C.; Briard-Bion, V.; Ménard, O.; Beaucher, E.; Rousseau, F.; Fauquant, J.; Leconte, N.
& Robert, B. (2011). Fat globules selected from whole milk according to their size:
different compositions and structure of the biomembrane, revealing
sphingomyelin-rich domains. Food Chemistry, Vol.125, No.2, (March 2011), pp. 355-
368, ISSN 0308-8146
Manirakiza, P.; Covaci, A. & Schepens, P. (2001). Comparative study on total lipid
determination using Soxhlet, Roese-Gottlieb, bligh & dyer, and modified bligh &
dyer extraction methods. Journal of Food Composition and Analysis, Vol.14, No.1,
(February 2001), pp. 93-100, ISSN 1096-0481
Mele, M.; Conte, G.; Castiglioni, B.; Chessa, S.; Macciotta, N.P.P.; Serra A.; Buccioni, A.;
Pagnacco, G. & Secchiari, P. (2007). Stearoyl-Coenzyme A desaturase gene
polymorphism and milk fatty acid composition in Italian Holsteins. Journal of Dairy
Science, Vol.90,No.9, (September 2007), pp. 4458-4465, ISSN 0022-0302
Michalski, M.; Gassi, J.Y.; Famelart, M.H.; Leconte, N.; Camier, B.; Michel, F. & Briard, V.
(2003). The size of native milk fat globules affects physical-chemical and sensory
properties of Camembert cheese. Dairy Science and Technology. Le Lait, Vol.83, No.2
(June 2003), pp.131-143, ISSN 1958-5594
Michalski, M.C.; Ollivon, M.; Briard, V.; Leconte, N. & Lopez, C. (2004). Native fat globules
of different sizes selected from raw milk: thermal and structural behaviour.
Chemistry and Physics of Lipids, Vol.132, No.2, (December 2004), pp. 247-261, ISSN
0009-3084
Michalski, M.C.; Camier, B.; Gassi, J.Y.; Briard-Bion, V.; Leconte, N.; Famelart, M.H. &
Lopez, C. (2007). Functionality of smaller vs control native milk fat globules in
Emmental cheeses manufactured with adapted technologies. Food Research
International, Vol.40, No.1, (January 2007), pp. 191-202, ISSN 0963-9969
Molto-Puigmarti, C.; Castellote, A.I. & Lopez-Sabater, M.C. (2007). Conjugated linoleic acid
determination in human milk by fast-gas chromatography. Analytica Chimica Acta,
Vol.602, No.1, pp. 122-130, ISSN 0003-2670
Pereira, S.L.;. Leonard, A.E. & Mukerji, P. (2003). Recent advances in the study of fatty acid
desaturases from animals and lower eukaryotes. Prostaglandins Leukotrienes and
Essential Fatty Acids, Vol.68, No.2, (February 2003), pp. 97-106, ISSN 1098-8823
Perfield, J.W. II; Delmonte, P.; Lock, A.L.; Yurawecz, M.P. & Bauman, D.E. (2006). Trans-10,
trans-12 conjugated linoleic acid does not affect milk fat yield but reduces Δ9-
desaturase index in dairy cows. Journal of Dairy Science, Vol.89, No.7, (July 2006),
pp. 2559-2566, ISSN 0022-0302
Perfield, J.W. II; Lock, A.L.; Griinari, J.M.; Sab, A.; Delmonte, P.; Dwyer, D.A. & Bauman,
D.E. (2007). Trans-9, Cis-11 conjugated linoleic acid reduces milk fat synthesis in
lactating dairy cows. Journal of Dairy Science, Vol.90, No.5, (May 2007), pp. 2211-
2218, ISSN 0022-0302
Pryce, J.E., Royal, M.D.; Garnsworthy, P.C. & Mao, I.L. (2004). Fertility in the high-
producing dairy cow. Livestock Production Science, Vol.86, No.1-3, (March 2004), pp.
125-135, ISSN 1871-1413
Randolph, H.E. & Erwin, R.E. (1974). Influence of mastitis on properties of milk.10. Fatty-
acid composition. Journal of Dairy Science, Vol.57, No.8, (August 1974), pp. 865-868,
ISSN 0022-0302
Milk Biodiversity: Future Perspectives of Milk
and Dairy Products from Autochthonous Dairy Cows Reared in Northern Italy
183
Ros, E. (2003). Dietary cis-monounsaturated fatty acids and metabolic control in type 2
diabetes. The American Journal of Clinical Nutrition, Vol.78, No.3suppl, (September
2003), pp. 617S-625S, ISSN 1938-3207
Rosenberger, G. (1979). L’esame clinico del bovino, Ed. Essegivi, Edagricole, ISBN 88-206-3713-
8, Piacenza, Italy
Roxström, A.; Strandberg, E.; Berglund, B.; Emanuelson, U. & Philipsson, J. (2001a). Genetic
and environmental correlations among female fertility traits and milk production
in different parities of Swedish Red and White dairy cattle. Acta Agriculturae
Scandinavica, Section A - Animal Science, Vol.51, No.1, pp.7-14, ISSN 0906-4702
Roxström, A.; Strandberg, E.; Berglund, B.; Emanuelson, U. & Philipsson, J. (2001b). Genetic
and environmental correlations among female fertility traits and the ability to show
oestrus, and milk production. Acta Agriculturae Scandinavica, Section A - Animal
Science, Vol.51, No.3, pp. 192-199, ISSN 0906-4702
Sandri, S.; Summer, A.; Tosi, F.; Mariani, M.S.; Pecorari, M.; Franceschi, P.; Formaggioni, P.;
Pederzani, D. & Malacarne, M. (2010). Influence of somatic cell content on dairy
aptitude of milk. Scienza e Tecnica Lattiero-Casearia, Vol.61, No.1, pp. 5-18, ISSN
0390-637X
Schennink, A.; Stoop, W.M.; Visker, M.H.P.W.; Heck, J.M.L.; Bovenhuis, H.; Poel, J.J.v.d.;
Valenberg, H.J.F.v. & Arendonk, J.A.M.v. (2007). DGAT1 underlies large genetic
variation in milk-fat composition of dairy cows. Animal Genetics, Vol.38, No.5,
(October 2007), pp. 467–473, ISSN: 1365-2052
Schennink, A.; Heck, J.M.L.; Bovenhuis, H.; Visker, M.H.P.W.; Valenberg, H.J.F.v. &
Arendonk, J.A.M.v. (2008). Milk fatty acid unsaturation: genetic parameters and
effects of Stearoyl-CoA desaturase (SCD1) and Acyl CoA: diacylglycerol
acyltransferase 1 (DGAT1). Journal of Dairy Science, Vol.91, No.5, (May 2008), pp.
2135-2143, ISSN 0022-0302
Shorten, P.R.; Pleasants, T.B. & Upreti, G.C. (2004). A mathematical model for mammary
fatty acid synthesis and triglyceride assembly: the role of stearoyl CoA desaturase
(SCD). Journal of Dairy Research, Vol.71, No.4, pp. 385-397, ISSN 0022-0299
Sørensen, A.C.; Lawlor, T. & Ruiz, F. (2007). A survey on fertility in the Holstein populations
of the world. In: Proceedings of the Int Conf on Fertility in dairy cows “EAAP Satellite
Meeting”, pp. 1:17, ISBN 91-576-5678-9, Liverpool Hope University, UK, 30-31
August 2007
Soyeurt, H.; Dardenne, P.; Gillon, A.; Croquet, Vanderick, C.S.; Mayeres, P.; Bertozzi, C. &
Gengler, N. (2006). Variation in fatty acid contents of milk and milk fat within and
across breeds. Journal of Dairy Science, Vol.89, No.12, (December 2006), pp. 4858-
4865, ISSN 0022-0302
Soyeurt, H.; Gillon, A.; Vanderick, S., Mayeres, P.; Bertozzi, C. & Gengler, N. (2007).
Estimation of heritability and genetic correlations for the major fatty acids in
bovine milk. Journal of Dairy Science, Vol.90, No.9, (September 2007), pp. 4435-4442,
ISSN 0022-0302
Soyeurt, H.; Dehareng, F.; Mayeres, P.; Bertozzi, C. & Gengler, N. (2008). Variation of Δ9-
desaturase activity in dairy cattle. Journal of Dairy Science, Vol.91, No.8, (August
2008), pp. 3211-3224, ISSN 0022-0302
Food Production – Approaches, Challenges and Tasks
184
Veerkamp, R.F. (1998). Selection for economic efficiency of dairy cows using information on
live weight and feed intake: A review. Journal of Dairy Science, Vol.81, No.(4), pp.
1109-1119, ISSN 0022-0302
Vessby, B. (2003). Dietary fat, fatty acid composition in plasma and the metabolic syndrome.
Current Opinion in Lipidology, Vol.14, No.1, (February 2003), pp.15-19, ISSN 1473-
6535
11
Rapid Methods as Analytical Tools for Food and
Feed Contaminant Evaluation: Methodological
Implications for Mycotoxin Analysis in Cereals
Federica Cheli
1
, Anna Campagnoli
2
,
Luciano Pinotti
1
and Vittorio Dell’Orto
1
1
Dipartimento di Scienze e Tecnologie
Veterinarie per la Sicurezza Alimentare,
Università degli Studi di Milano, Milano,
2
Università Telematica San Raffaele Roma, Roma,
Italy
1. Introduction
Over the past years, food quality is perceived to have improved and food safety has become
an important food quality attribute (Röhr et al., 2005). This implies that all aspects of food
production and therefore of the feed supply chain must be considered to ensure the safety of
human food (Pinotti & Dell’Orto, 2011).
As a result, public authorities and regulatory agencies are pushing producers,
manufacturers, and researchers to pay serious attention to food and feed production
processes and to develop comprehensive quality policies and management systems to
improve food safety and try to enhance consumer information to regain consumers trust in
food.
From this point of view, the knowledge and control of the level and distribution of
contaminants and undesirable substances in food and feed are become a worldwide topic of
interest due to the high economic and sanitary impact on human/animal health. Since it is
impossible to fully eliminate the presence of undesirable substances and contaminants, an
adequate surveillance and frequent checks are fundamental to assure quality and safety of
raw materials destined for direct consumption or industrial processes.
To guarantee food safety, the availability and the need for confirmatory methods of analysis
with high sensitivity/accuracy to meet the regulatory requirements remain critical.
However, the traditional methods have some typical drawbacks which include: high costs of
implementation, long time of analysis and low samples throughput, and the need for high
qualified manpower (Tang et al., 2009). The availability of fast, reliable and simple to use
detecting tools for food feed products is therefore a target both for the safeguard of
customer's health and production improvement (Tang et al., 2009) and it is undoubtedly one
of the main challenges and an imperative for a modern feed and food industry.
Food Production – Approaches, Challenges and Tasks
186
In recent years, a number of cost-effective and fit-for-purpose approaches have been
proposed to determine the effectiveness of the safety measures and to achieve logistical and
operational targets. From this point of view, rapid analytical methods would keep
commodities and products moving rapidly through the industrial processes, saving time
and requiring less technical training. Analytical approaches that provide qualitative or semi-
quantitative results for many chemical and microbiological applications are available and
would reduce costs by operating a selection of samples to be submitted to more expensive,
sensitive and specific analyses and can be recommended for use in sample screening.
Among these, a group of rapid methods comprises some approach miming human/animal
senses, for instance electronic nose. In many cases, these devices offer a particular kind of
information, pointing on a general description of samples rather than providing a set of
specific “discontinuous” analytical responses. This further aspect could result useful, under
specific conditions, to give an evaluation regarding the “total quality” value of the matrices
with a single analysis.
The aim of this chapter will be to evaluate the potentiality offered by rapid analytical
approaches to food and feed evaluation, focusing on contaminants and undesirable
substances. A critical overview, highlighting characteristics and applications of these
techniques, will be offered with examples pointed on specific matrices and contaminants,
cereals and mycotoxins, respectively.
2. Food and feed contaminants: Mycotoxins
Cereals are still by far the world's most important sources of food, both for direct human
consumption and indirectly, as inputs to livestock production. FAO’s latest forecast for
world cereal production in 2011 stands at nearly 2 313 million tones, 3.3 percent higher than
in 2010 (FAO, 2011). For the feed sector, cereals represent the main components of industrial
feeds, which estimated production, worldwide, is more than 717 million tons (Best, 2011).
These volumes make extremely complex the issue of the control and evaluation of quality
and safety features and extremely high the amount of analysis that must be performed to
meet the regulatory requirements or to give added value to products intended for human
and animal consumption. In terms of food safety, cereals represent very heterogeneous
materials characterized by a large set of undesirable substances and contaminants. Among
the most important risks associated to cereals’ consumption are mycotoxins (Codex
Alimentarius , 1991).
Mycotoxins are metabolites of fungi capable of having acute toxic, carcinogenic, mutagenic,
teratogenic, immunotoxic, and oestrogenic effects in man and animals (D’Mello et al., 1999;
Wild & Gong, 2010). Since the discovery of aflatoxins in 1960 and subsequent recognition
that mycotoxins are of significant health concern to both humans and animals, mycotoxins
have received considerable attention as biotoxins in the food chain. Extensive mycotoxin
contamination has been reported to occur in both developing and developed countries. It
has been estimated that up to 25% of the world’s crops grown for feed and food may be
contaminated with mycotoxins (Fink-Gremmels, 1999; Hussein & Brasel, 2001). These data
are in line with those reported by the Rapid Alert System for Food and Feed in the
European Union (RASFF, 2009), for which of total 3 322 information notifications of possible
risks to human health, 669 were related to mycotoxins. This also means that, if the estimated
Rapid Methods as Analytical Tools for Food and Feed
Contaminant Evaluation: Methodological Implications for Mycotoxin Analysis in Cereals
187
world production is about 2 300 million tonnes (2011), there are potentially about 500
million tonnes of mycotoxin contaminated grains entering the feed and food supply chain.
Furthermore, according to the possible carry-over of mycotoxins, feed contamination can
represent also a hazard for the safety of food of animal origin and can contribute to
mycotoxin intake in human population (Monaci & Palmisano, 2004; Jorgensen, 2005). In this
context, one of the latest surveys (Taylor-Pickard, 2009) confirms that feedstuffs are typically
contaminated with more than one toxin, which may have a cumulative effect in terms of
toxicity in the animals. This places a number of economic and food safety risks for growers,
cereal food business operators and food and feed manufacturers. The risks of contamination
are greater when raw materials are not traceable or derive from countries where adequate
monitoring infrastructures are not in place (Pinotti et al., 2005;). In this field, the geographic
origin of food and feed material is also important (Pinotti & Dell’Orto, 2011). Although it is
known that mycotoxins are ubiquitous and not just limited to humid and hot countries,
where the climate is more favourable to microbial and fungal contamination, it has been
reported that some toxins can occur more frequently than other according to the producing
area of the food/feed material. Thus zeralenone, fumonisin and aflatoxin were the most
widespread toxins found in Asian commodities. By contrast, zeralenone and deoxynivalenol
were the most prevalent toxins in continental Europe samples, even after adjusting for the
seasonality of contamination for these different toxins (Taylor-Pickard, 2009). By-products
typically contain higher levels of toxins’ contamination compared to whole raw materials.
From a safety perspective, it is well documented that milling and thermal processing such as
baking, extrusion cooking and roasting are treatments that may affect redistribution,
stability, change and removal of mycotoxins in the processed food (Brera et al., 2006;
Bullerman & Bianchini, 2007; Castells et al., 2008; Cheli et al., 2010). Therefore, controls are
needed at all stages of cereal production and processing in order to guarantee the quality
and safety of the production.
The knowledge and control of the level and distribution of mycotoxins in food and feed are
a worldwide objective of producers, manufacturers, regulatory agencies and researchers due
to the high economic and sanitary impact on food and feed safety and human/animal
health. As stated before, since it is impossible to fully eliminate the presence of undesirable
substances and contaminants, maximum concentrations should be set at a strict level which
is reasonably achievable considering the risk related to the consumption of the food and,
consequently, an adequate surveillance and frequent checks are fundamental to assure
quality and safety of raw materials destined for direct consumption or industrial processes.
Communities fixed maximum levels for mycotoxins in foodstuffs through the Commission
Regulation (EC) No 1881/2006 of 19 December 2006 and Commission Regulation (EC)
1126/2007 of 28 September 2007. In the field of animal nutrition, specific indications on
mycotoxins and other undesirable substances in animal feed are considered in the
Commission Directive 2003/100/EC of 31 October 2003 and in the Commission
Recommendation 2006/576/EC of 17 August 2006.
3. Contaminated food and feed as analytical matrices. Approach to error
reduction during sampling and analytical procedures
Ingredients for human foods as for animal feeds are typically very heterogeneous and
complex matrices to be analyzed. On the other hand, food and feed contamination can be
Food Production – Approaches, Challenges and Tasks
188
heterogeneous as well, including biological, chemical and physical contaminants. The
biological contamination, comprising microorganism, natural occurring toxins (i.e.
mycotoxins from fungi, phycotoxins from algae, toxins from cyanobacteria, histamine,
vegetal alkaloids, etc.), and chemical contamination (i.e. agrochemicals as pesticides, plant
growth regulators, veterinary drugs, and environmental contaminants as metals, dioxins,
BCBs, etc.) get more concern for food and feed safety (Tang et al., 2009). When contaminants
and undesirable substances have to be detected or quantified with reasonably confidence, a
further critical aspect must be considered, such as their distribution, within a lot to be
analyzed. This can be very different due to the characteristics of both food/feed matrices
and undesirables molecules themselves. Usually contaminants are divided into two groups,
substances uniformly distributed (pesticides, additives, heavy metals, PCBs, dioxins,
medicine residues, etc) and non uniformly distributed (natural toxins, GMO, salmonellae,
etc.). The type of distribution of contaminants in food and feed has major implications for
attempting to precisely and accurately measure the level of contamination in a commodity
bulk that is fundamental for products intended for food/feed uses in order to respect the
final purposes, i.e. fixed maximum tolerable levels or other operational targets for food/feed
industry. Once again a good example is provided by mould and mycotoxin distribution in
food and feed commodities. It is well known that mycotoxin contamination is
heterogeneously distributed in raw materials (Whitaker, 2004; Larsen et al., 2004). Bulk
cereal moisture usually facilitates the development of localized clumps particularly rich in
moulded kernels. These small percentages of extremely contaminated portions (“hot spots”)
are randomly distributed in a lot (average value usually registered about 0.1%) (Johansson
et al., 2000a). This condition can lead to an underestimation of the real level of mycotoxin if
a too small sample size without contaminated particles is analysed or, instead, to an
overestimation of the true level in the case of a too small sample size featuring or more
contaminated particles are analyses. Accordingly, when a quantification for a specific
contaminant has to be performed in a specific food matrix, all the above mentioned aspects
give a fundamental contribute to sampling variability, uncertainty of measurements and
finally, to analytical results (Cheli et., 2007a). For these reasons, an analytical methodology
to really be considered "fit-for-purpose" should be chosen taking into account not only the
sensitivity / specificity, precision and accuracy of the measurement technique adopted, but
also its compatibility with an adequate sampling method. In fact, under certain
circumstances, as in the case of above described complex, coarse matrices and/or
contaminants characterized by the tendency to heterogeneous distribution into the matrix,
it appears intuitive that the sampling error could account for an important part of the total
error of the final result. On the other hand this topic reveals further interesting
implications. If is concrete the hypothesis that, in a specific condition, sampling
uncertainty dominates in the uncertainty of the final result, then the choice of an
expensive and effective analytical method could result an inefficient strategy. Otherwise,
the adoption of a rapid, low cost and high sample throughput analytical approach able to
test a high number of samples can represent a better option (Fearn, 2011). From this point
of view some statistical approaches can represent helpful tools not only for results’
analysis and final data interpretations but also to estimate the importance of the sampling
error and in general to estimate the usefulness of a specific analytical application (French,
1989).
Rapid Methods as Analytical Tools for Food and Feed
Contaminant Evaluation: Methodological Implications for Mycotoxin Analysis in Cereals
189
As a consequence, the definition of the concept of sampling procedure (also defined
“Sampling plan”), and of sampling strategy, as a function of the final target of analysis, and,
when possible, the selection of the opportune analytical technique, including rapid methods,
represent topics that deserve further in-depth examination in order to achieve the
optimization and the fitness of purpose of an analytical approach for contaminant
evaluation in food and feed.
3.1 Plan a sampling procedure for mycotoxins
A sampling plan for mycotoxins may be defined as a “test procedure combined with a
sample acceptance limit” (Johansson at al., 2000b). A sampling procedure is a multistage
process and consists of a sampling phase and an analytical phase. The analytical phase can
be further splitted into sample preparation and instrumental analysis (Whitaker, 2006). All
the phases are associated to a variability which can impair the reliability of the final result.
Each phase of a sampling plan is associated to a specific level of uncertainty and therefore,
as mentioned above, in no circumstance is it possible to obtain a quantitative value for the
contamination associated with 100% certainty (Whitaker, 2006). It is intuitive that each step
of a sampling protocol specifically contributes to the final uncertainty of the procedure. The
total variance of a specific sampling plan (TV) may be expressed by using statistic variance
as a measure of variability and may be described as the sum of sampling variance (SV), and
analytical variance (AV) as follows (1):
TV=SV+ AV (1)
(in which AV reassumes the sum of sample preparation variance (SPV) plus instrumental
analysis variance (IV)). TV and variance distribution in the different steps of the sampling
protocol give indications on the sampling plan efficiency and are also able to compare
effectiveness of different sampling plans to the final purpose (Cheli et al., 2009a).
The contribution from SV has often been underestimate, though it is accountable for the
largest source of variation associated to the quality of the final analytical result (Whitaker,
2003, Cheli et al., 2009a). There appears to be more substantial literature on food than feed
(Cheli et al., 2009a).
Due to the frequently uneven contaminant and undesirable substance distribution in solid
samples, such as grains and other alimentary commodities, raw material and matrices,
obtaining a representative sample is a way of minimizing false results and increases the
chances of accurate determination of mycotoxins in a batch or lot. When designing a specific
sampling plan, all critical points have to be considered in order to reduce SV and increase the
reliability of the final sample, such as collection of a sufficiently large number/size of
incremental samples, choice of the sampling points, aggregate sample size properties,
homogeneity of sample components in terms of size and specific weight. All these parameters
must specifically consider the type of product and mycotoxin level of contamination. For
mycotoxins, it becomes even more important than usual to consider the contribution of SV to
the uncertainty of any measurement, and there are implications for the type of measurement
technology that may be judged fit for purpose. The contribution of SV, SPV and IV to TV has
been evaluated and quantified in several products (Table 1). In this context, quantitative data
are available for foodstuffs, but are still lacking for the majority of feedstuffs.
Food Production – Approaches, Challenges and Tasks
190
Matrix, mycotoxin and test procedure SV,
%TV
SPV,
%TV
IV,
%TV
References
Shelled corn,
0.91 kg sample, Romer mill,
50 g subsample, 1 aliquot analysed,
aflatoxin 20 ng/g
75.6 15.9 8.5 Whitaker, 2006
Shelled corn,
4.54 kg sample, Romer mill,
100 g subsample, 2 aliquots analysed,
aflatoxin 20 ng/g
55.21 29.1 15.7 Whitaker, 2006
Shelled corn,
1.13 kg sample, Romer mill,
50 g subsample, 1 aliquot analysed,
aflatoxin 20 ng/g
77.8 20.5 1.7
Johansson et al.,
2000c
Wheat,
0.454 kg sample, Romer mill,
25 g subsample, 1 aliquot analysed,
Deoxynivalenol ppm
22 56 22
Whitaker et al.,
2002
Shelled corn,
5 kg sample, Romer mill,
100 g subsample, 1 aliquot analysed,
aflatoxins 20 ng/g
59.8 34.5 5.7
Johansson et al.,
2000c
Peanut,
2.27 kg sample,
100 g subsample,
aflatoxin 100 ppb
92.7 7.2 0.1
Whitaker et al.,
1994
Shelled corn,
kg sample,
25g subsample, 1 aliquot analysed,
fumonisin 2 mg/kg
61 18.2 20.8
Whitaker et al.,
1998
Table 1. Distribution of variability associated to each sampling step: sampling (SV), sample
preparation (SPV) and instrumental analysis (IV) (modified from Cheli et al., 2009a).
The methods of sampling and analysis for the official control of the levels of mycotoxins, are
reported in Commission Regulation (EC) No 401/2006 of 23 February 2006 and Commission
Regulation (EC) No 152/2009 of 27 January 2009. These regulations provide different
sampling plans according to the type of food and feed products, respectively. However,
screening, monitoring, controlling, exposure studies or targeted purposes may require
specific sampling and analytical approaches (Miraglia et al., 2005).
3.2 Toward optimization of sampling and analysis procedures
Some aspects related to sampling plan evaluation and the establishment of a decision
strategy are more detailed by Fearn et al. (2002) in an interesting paper in which the authors
describe a possible approach to the systematic optimization of the different phases during
the entire sampling procedure. Later on, this approach enables an economic evaluation of
Rapid Methods as Analytical Tools for Food and Feed
Contaminant Evaluation: Methodological Implications for Mycotoxin Analysis in Cereals
191
the entire process, and, as a consequence, an objective comparison among different plans
applicable to the same situation. Cost can be in fact defined as the measurement unit to take
the optimal decision if it is considered that the optimal decision represents the choice of the
most economic from different plans when quality of results are comparable. In a sampling
procedure, total cost can be defined as the analytical cost plus the potential losses incurred
in using the result.
To plan a sampling procedure, the analytical method, numbers of replicates samples,
numbers of replicate measurements per samples and the sampling technique have to be
selected. Thus, a systematic approach is first to optimize numbers of replicate samples and
analyses separately for each combination of sampling technique and analytical methods.
Then the optimised total costs of different methods may be compared.
As described in 3.1 paragraph, the uncertainty of the measurement can be expressed in
terms of total measurement variance, calculated as the sum of sampling and analytical
variance. Considering a measurement process in which n samples are taken and m replicate
analyses per sample made, the uncertainty of the measurement is dependent on the number
of samples and replicate analyses. Increasing the number of samples and/or analyses will
reduce the uncertainty but will increase cost to obtaining the measurement. For a given cost,
different allocations of resources between sampling and analysis may give different
variances. As a consequence, for a fixed cost, a balance between sampling and analysis may
be found with the aim to reach the best economic purpose and the minimum total
measurement variance (besides usually there are few sampling or analytical methods
available for a given problem so the choice can be simplified).
Thus, the total variance of the sampling plan can be more completely described as in (2)
TV
2
=(SV
2
/n)+(AV
2
/mn) (2)
where n is the total number of samples taken and m is the number of analyses carried out on
each sample; while the total cost of obtaining the measurement (cost of the entire sampling
plan) (TC) including sampling (SC) and analysis cost (AC), can be defined as in (3)
TC=nSC+mnA (3)
Either fixing the cost TC and minimizing the variance TV
2
or vice versa, the optimal number
of replicate analyses can be shown to be (4)
m
opt
=(SV/AV)·√(SC/AC) (4)
The value of m will need to be rounded to the nearest whole number. New rounded value
for m give important information. If m does not seem sensible, this may indicate that the
sampling and analytical methods are badly matched. Large values of m
opt
will result if the
analytical variance is large compared with sampling variance or if the sampling
cost is large
compared with the analytical cost. Then it may be better considering more precise analyses
or less expensive and less precise sampling procedures to get a better balance. Of course not
all choices can be permitted and each operational situations allow a specific range of
possibilities, so some compromise value of m will need to be chosen. It will rarely be a good
idea to make more than 4 or 5 replicate measurements on a sample. Values of much less
Food Production – Approaches, Challenges and Tasks
192
than one for m
opt
will occur if the sampling variance or analytical cost dominate. Again may
be useful to consider alternative analytical procedures that are less precise and therefore less
costly.
A practical example can be done. Starting from the assumption that the standard deviation
and the cost for single sample of an analytical method are usually known and that
frequently when a sampling methodology is consolidated the relative standard deviation
and cost can be inferred, we can suppose the sampling has a SD=0.8 with a cost of 21.00
Euros, while the analysis has a SD=0.6 and a cost for single sample of 4.00 Euros. m
opt
will be
calculated as (5)
m
opt
=(0.6/0.8)·√(21.00/4.00)=1.72
(5)
so m
opt
will be approximate to 2. Then each sample will cost 29.00 Euros (21.00+2*4.00) and
results associated to a SD=0.91.
After having obtained cost and SD of result, the next step is to find the optimal level of
sampling replications n, balancing measurement costs against possible losses. When
choosing a value for n, then each optimized method can be compared with the other
candidate methods. If the optimal n is less than one in situations where an m of greater than
one has been used it may be reasonable trying smaller values of m.
When optimising each method separately, then they can be compared by comparing the
total costs. In the absence of other operational or technical considerations the least cost
option will be chosen.
As general consideration the use of a decision strategy like those described allows a rational
approach to the problem of choosing analytical methods, a sampling scheme and how to
mach efficiently these two phases of the sampling procedure. Under certain circumstances,
there is no doubt that some parameters may be difficult to quantify. Probably for instance,
the most problematic of the inputs will usually be the losses arising from measurement
errors. In situations where the potential losses are very large, it may be necessary to take
account of a nonlinear utility for money. Despite these aspects, it can be state that is still
possible to get useful results from this approach.
4. Rapid methods for mycotoxin analysis
The use of so called “Rapid Methods” is highly relevant for improving the knowledge on
the presence and distribution of mycotoxins in food and feed and for creating a reliable
database (Stroka et al., 2004). These low cost, simple, rapid and reliable methods may be
applied in laboratory and non-laboratory environment and combine effective sampling with
analysis of a large number of samples for a screening approach. As a general rule, rapid
methods that provide qualitative or semi-quantitative results are recommended in sample
screening. An analytical method is usually referred to as “rapid” when it requires, at most, a
few minutes to obtain a result (van Amerongen et al., 2007). Currently, there are three main
tendencies to develop rapid methods for mycotoxin analysis in order to reduce the quantity
of assays and, therefore, to shorten time and to lower costs for feed and food quality control:
1) improvement of speed, user-friendliness, reliability, non-destructiveness, 2) use in a non-
laboratory environment, 3) simultaneous determination of multiple mycotoxins (Maragos,
Rapid Methods as Analytical Tools for Food and Feed
Contaminant Evaluation: Methodological Implications for Mycotoxin Analysis in Cereals
193
2004). In recent years, a number of rapid, cost-effective and fit-for-purpose approaches have
been proposed to determine the effectiveness of the safety measures, to determine legal
compliance, to achieve logistical and operational targets, to keep commodities and products
moving rapidly through marketing channels, to save time and investments in complex
instruments. Some are advanced enough for field studies and have already reached the
stage of commercialization, some are at a transition phase between research and application
to analysis of food/feed samples, other still have to face the challenge of validation by
multiple laboratories. A list of the emerging rapid methods for mycotoxin analysis is
reported in Table 2.
Methods Advantages Disadvantages References
LFD (lateral flow device) Rapid
No expensive
equipment
Easy to use
Semi-quantitative
Validation
required for each
matrix
Maragos, 2004; Zeng
et al., 2006;
Goryacheva et al.,
2007.
FPI (fluorescence
polarization
immunoassay)
High sensitivity
Low matrix
interference
Not usable for
simultaneous
detection of
several individual
mycotoxins
Maragos, 2004;
Goryacheva et al.,
2007.
CE (capillary
electrophoresis)
High sensitivity
Non polluting
technology
Possible simultaneous
multi-component
analysis
Expensive
equipment
Expensive
Clean-up may be
required
Maragos, 2004;
Maragos & Appel,
2007.
SPR (surface plasmon
resonance)
Rapid
No clean up
Cross reactivity
Tudos et al., 2003;
Van der Gaag et al.,
2003; Maragos, 2004.
MIP (molecularly
imprinted polymers)
Low cost
Stable
Reusable
Poor selectivity
Maragos, 2004;
Logrieco et al., 2005;
Krska & Welzig, 2006.
IR spectroscopy (NIR,
FR-NIR)
Rapid
Non destructive
measurements
No clean up
Easy to use
Expensive
equipment
Calibration model
must be validated
Good for
classification
Kos et al., 2002, 2003;
Petterson & Aberg,
2003; Berardo et al.,
2005; De Girolamo et
al., 2009.
EN (electronic nose)
Rapid
Non destructive
measurements
No clean up
Calibration model
must be validated
Good for
classification
Keshri & Magan,
2000; Olsson et al.,
2002; Presicce et al.,
2006; Cheli et al.,
2009b; Campagnoli et
al., 2011.
Table 2. Examples of emerging rapid methods for mycotoxin analysis.
Food Production – Approaches, Challenges and Tasks
194
Emerging technologies and their potential application in rapid mycotoxin detection have
been recently reviewed (Maragos, 2004; Krska & Welzig, 2006; Zeng et al., 2006; Goryacheva
et al., 2007; Cheli et al., 2008; Maragos & Busnam, 2010). The most known rapid screening
methods for mycotoxin detection, especially for the screening of raw materials, are
antibody-based methods, ELISA test. The ELISA methods have been commercially available
since many years and are extensively used as rapid screening methods. Kits are available in
quantitative, semi-quantitative or qualitative formats (Zeng et al., 2006). These methods are
easy to use, fast and suitable for testing mycotoxin in the field too. Within the concept of
flexible out of laboratory testing, non instrumental (visual) membrane based immunoassays
(dipstick, lateral flow and flow-through tests) have been developed and are commercially
available for several mycotoxins and matrices. The main advantages of non instrumental
ELISA methods are field portability, not requirement of any specialized equipment and
simple sample preparation procedures, while the main disadvantages are subjective
interpretation, lower sensitivity and higher cost/test compared with instrumental ELISA
methods (Zeng et al., 2006; Goryacheva et al., 2007). Although immunochemical methods
have become one of the most useful tools for mycotoxin rapid screening, the price for
simplification may be usually lower sensitivity. The main problems with antibody-based
methods are related to the characteristics of the antibody, test specificity (cross-reactivity),
matrix interference and interpretation of the result, if the method is semi-quantitative, when
the mycotoxin concentration is close to the method cut-off level. Still insufficient validation
studies of ELISA methods for all commodities limit their use to those matrices for which
they were validated.
Apart from ELISA, the more recent and best candidates as mycotoxin analytical methods for
further developments in terms of rapid methods, multi-mycotoxin assays, easy to use and to
be validated by multiple laboratories are capillary electrophoresis (CE), fluorescence
polarization immunoassay (FPI) and surface plasmon resonance (SPR). CE methods are
laboratory-based methods because of the size and required automation of the
instrumentation, while FPI and SPR methods may be much more portable and therefore
may be used outside the laboratory and have reached the stage of commercialization. CE
methods for aflatoxins, fumonisins, ochratoxin A, deoxynivalenol, moniliformin and
zearalenone have been reviewed by Maragos (1998). The main advantage of CE is the
possibility to reach a sensitivity comparable to that of established HPLC methods.
Combination of CE with immunoassay makes it possible a simultaneous multi-component
analysis due to the high resolving power of CE.
FPI are solution based-assays in which a mycotoxin-fluorophore conjugate (tracer) is used.
Applications of FPI assays have been described for detection of deoxynivalenol, fumonisins,
aflatoxins, zearalenone and ochratoxin A in cereals, semolina and pasta (Maragos, 2004;
Goryacheva et al., 2007). Good correlation have been found between comparative analyses
performed by FPI and HPLC. The main advantages of FPI are a high sensitivity and a low
matrix interference. The potential speed of FPI assays combined with the portability of
commercially available devices, suggests this to be a promising technology for mycotoxin
detection. A limit of FPI is that it cannot be used for simultaneous detection of several
individual mycotoxins.
SPR is a measure of mass changes that occur in a sensor surface. Applications of SPR assay
for detection of DON, fumonisins, aflatoxins, zearalenone and ochratoxin A have been
Rapid Methods as Analytical Tools for Food and Feed
Contaminant Evaluation: Methodological Implications for Mycotoxin Analysis in Cereals
195
developed and optimized (Daly et al., 2000; Schnerr et al., 2002; Tudos et al., 2003; van der
Gaag et al., 2003). SPR sensitivity for aflatoxin B1 has been demonstrated to be higher than
ELISA assay. Studies on naturally contaminated samples showed that SPR results are in
agreement with liquid chromatography mass spectrometry (LC-MS) measurements (Tudos
et al., 2003; van der Gaag et al., 2003). A technique for the simultaneous detection of four
different mycotoxins in a single measurement using SPR commercially available portable
equipment was recently reported (van der Gaag et al., 2003).
Emerging challenge of sensors for mycotoxins is represented by the development of non-
biologically based binding, such as molecularly imprinted polymers (MIPs) (Maragos, 2004;
Logrieco et al., 2005; Krska et al., 2005). Rapid future applications of MIPs are expected if
affinity problems are overcome. Mimicking antibodies is the basic idea of MIPs technology.
The preliminary results of MIPs technology in zearalenone, deoxynivalenol, and ochratoxin
A analysis has been reported (Visconti & De Gerolamo, 2005; Krska & Welzig, 2006).
Although the affinity of MIPs are not yet competitive with those of antibodies, this
technique offers a good potential for further developments.
Near Infrared (NIR) Spectroscopy, micro system technology tools based on DNA arrays,
electronic noses and tongues, biosensors and chemical sensors for the detection of fungal
contaminants in feed and food are other emerging, available and promising methods
(Larsen et al., 2004; Maragos, 2004; Logrieco et al., 2005; Zeng et al., 2006; Cheli et al., 2008).
Infrared (IR) spectroscopy has been continuously evolving, as can be deduced comparing
the old mid-IR equipment manufactured in the 1950s and based on dispersive
monochromators with the present customized near infrared (NIR) instrumentation. The
incorporation of the Fourier transform technique (FT) together with the interferometric
spectrometers into the mid-IR instruments has increased the use of this technique in food
analysis (Ibañez & Cifuentes, 2001). Although NIR spectroscopy has been used routinely
since many years as a rapid method in feed and food industry for determination of
constituents such as humidity, proteins, lipids with a precision comparable with that of the
official methods of analysis, a limited number of publications concerning mycotoxins and
NIR spectroscopy have been reported. This is because the concentration of mycotoxins
normally found in feed and food has been considered low for this technique. Recently NIR
and mid-infrared (MI) spectroscopy with attenuated total reflection (IR/ATR and FT-
IR/ATR) have been used in order to rapidly detect the presence of fungal infection and
estimation of fungal metabolites and mycotoxins in naturally and artificially contaminated
products (Kos et al., 2002, 2003; Petterson & Aberg, 2003; Berardo et al., 2005; De Girolamo et
al., 2009). Multivariate analysis for the extraction of additional information from the
recorded spectra gave promising results on the capability of these techniques as tools and
models not only for the detection of mould presence, but also for the prediction of the
presence of mycotoxins. Chemometric models applied to FT-IR/ATR analysis enabled
correct classification of non contaminated and contaminated maize and wheat with
deoxynivalenol (Kos et al., 2003; De Girolamo et al., 2009). The developed method enabled
the separation of samples with a cut off level for DON of 300 µg/kg, a value below the
maximum level and guidance value proposed by the EU for maize and wheat intended for
human and animal consumption. Improvements of the classification performance of FT-
IR/ATR analysis can be achieved optimising sample preparation procedure and applying
particle size analysis to samples (Kos et al., 2007). The use of NIR spectroscopy for the
Food Production – Approaches, Challenges and Tasks
196
determination of DON in wheat and fumonisin B1 in maize has been investigated (Petterson
& Aberg, 2003; Berardo et al., 2005). It has been shown that it is possible to predict DON
concentration in wheat kernels by NIR at levels higher than ca. 400 µg/kg (Petterson &
Aberg, 2003), indicating the high potential of IR spectroscopy for accurately predicting the
presence or absence of mycotoxins in cereals.
4.1 The analytical approaches miming senses: The example of electronic nose
Further example of rapid methods are those based on electronic senses, which represent an
evolution of sensory evaluation traditionally entrusted to the human/animal senses. The
evaluation of food and feed in terms of smell, taste, morphology and colour is often
overlooked, but contains a lot of information directly related to quality and safety. In
particular, the smell and aroma of a food, due to the presence of many volatile chemicals,
are sensory parameters of great interest, which can be used as indicators of food quality
(Cheli et al., 2007b). Fungal spoilage induces nutritional losses, off-flavours, organoleptic
deterioration often associated to mycotoxins formation. Research studies correlated fungal
activity with the production of volatile metabolites characterized by gas chromatography
mass spectrometry (GC-MS) (Magan & Evans, 2000). These authors conclude that
accumulation and pattern of fungal volatiles can be used as indicators of fungal activity and
as taxonomic markers in order to differentiate between fungal species and between
toxigenic and non toxigenic fungal strains. Since volatile headspace analysis can be
evaluated as a whole by the use of electronic nose (EN), this technique is becoming
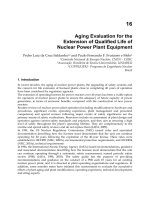
widespread in order to evaluate mould spoilage, quality and safety of food and feed. An EN
is an instrument which comprises an array of electronic chemical sensors with partial
specificity and an appropriate pattern recognition system, capable of recognizing simple or
complex odours (Gardner & Bartlett, 1994)(Fig. 1). The array of non-specific chemical
detectors interacts with different volatile compounds and provide signals that can be
utilised effectively as a fingerprint of the volatile molecules rising from the samples
analysed. After the achievement of a fingerprint, the identification and/or quantification of
the odours by means of a pattern recognition system become possible.
Fig. 1. An example of electronic nose.
Rapid Methods as Analytical Tools for Food and Feed
Contaminant Evaluation: Methodological Implications for Mycotoxin Analysis in Cereals
197
The electronic nose does not distinguish each volatile substance, but express the global
odour of a product (Gardner & Bartlett, 1994). This ability, as in the case of other devices as
electronic tongue or certain applications of computer image analysis, can enable a general
evaluation regarding the “total quality” value of the food and feed analyzed. The process is
completed with the aid of appropriate mathematical and statistical methods. As previously
cited, the use of EN for evaluating the quality of stored grain has been reported. Sensor
technology has been shown to enable to determine the mycological quality of grains. The
first type of study carried out with EN technology has been made in order to differentiate
between non-infected and infected samples with different species or strain of fungi, through
the variation of the metabolic pathway due to the contamination of grains. The ability of EN
to differentiate grains and bakery products clean or contaminated (naturally or artificially
infected) with different mould species have been demonstrated (Magan & Evans, 2000;
Olsson et al., 2000; Balasubramanian et al., 2007; Paolesse et al., 2006). Detection and
differentiation between mycotoxigenic and non-mycotoxigenic strains of Fusarium spp.
using volatile production profiles evaluated by EN has been also reported (Keshri & Magan,
2000; Magan & Evans, 2000; Falasconi et al., 2005; Presicce et al., 2006; Sahgal et al., 2007).
Further developments of studies carried out with EN technology have been made in order
to evaluate the possibility of using fungal volatile metabolites as indicators of mycotoxin
presence (Campagnoli et al., 2009b). Results from a study carried out on naturally
contaminated barley samples showed that it was possible to use volatile compounds to
predict whether the OTA level in samples was below or above 5 μg/kg; seven of 37 samples
were misclassified (Olsson et al., 2002). EN analysis enabled correct classification of
naturally contaminated maize with aflatoxins (Campagnoli et al., 2009a, 2009b; Cheli et al.,
2009b). EN analysis was applied to wheat in the case of naturally DON contaminated
samples (Tognon et al., 2005; Dell’Orto et al., 2007; Campagnoli et al., 2009b). A simple
analytical protocol, combined with the application of the CART (Classification and
Regression Tree) model and PCA (Principal Component Analysis) for the selection of
variables and the classification of samples was used in another paper (Campagnoli et al.,
2011). Results obtained indicated that the EN equipped with ten MOS (Metal Oxide
Semiconductor) sensors array allows the classification of naturally contaminated samples on
the basis of DON content into three classes on the basis of the European Union limits for
DON in unprocessed durum wheat: (a) non-contaminated; (b) contaminated below the limit
(DON < 1,750 μg/kg); (c) contaminated above the limit (DON > 1,750 μg/kg); with a
validated prediction error rate of 0% when a 20-sample dataset was considered.
(Campagnoli et al., 2011). The same model was used with a 122-sample dataset, 9
contaminated and 113 non-contaminated samples, more faithfully reproducing a real-life
situation characterised by unbalanced classes. Although, classifying performance was lower
than in the 20-sample dataset case, reasonable results were achieved, with a validated
prediction error rate of 3.28% (Table 3). Four errors were computed in prediction; however,
none of the contaminated samples were misclassified as non-contaminated, avoiding the
worst eventuality under in-field conditions.
Less information is available regarding quantification capability of electronic nose in order
to predict mycotoxins concentration in cereals. Tests were conducted on DON levels in
barley and wheat. Positive correlation was found between electronic nose data and reference
concentration of DON (Olsson et al., 2002). However the performance of the regression
model on prediction was quite low (PRESS =0.65, R
2
=0.63, adjR
2
=0.63) (Tognon et al., 2005;
Dell’Orto et al., 2007).