Proteomic Applications in Biology Part 14 pptx
Bạn đang xem bản rút gọn của tài liệu. Xem và tải ngay bản đầy đủ của tài liệu tại đây (2 MB, 17 trang )
Proteomic Applications in Biology
210
Beyond the abovementioned properties, Y. lipolytica remains the only known ascomycetes
yeast readily growing on alkaline media and in the presence of salts at near-saturating
concentrations. These phenomena have been studied by both genetic and biophysical
methods. Genetic and molecular biology data implicated the involvement of Rim101- and
calcineurine-dependent signal pathways in the high pH adaptation (Lambert et al, 1997).
Biophysical data by Zvyagilskaya et al (2000) demonstrated the exchange of proton-
dependent machineries involved in metabolite symport (e.g. phosphate ion) through the
plasma membrane as a mechanism for Na
+
-dependent adaptability. Rim101- and
calcineurine-dependent regulatory pathways as well as the proton/Na
+
symport switch are
ubiquitous in all studied yeast including Saccharomyces cerevisiae. Under normal conditions,
these mechanisms usually provide a launch of emergency responses to stress, allowing only
a short-term survival of the cells under the alkaline / high salt conditions. In contrast, Y.
lipolytica permanently grows on media with a pH up to 10. On the other hand, similar to
other ascomycetes, Y. lipolytica is considered to prefer an acidic pH media. Many strains of
this species demonstrate an exclusive resistance to low pH (Yuzbashev et al, 2010). Taken
together, these data show that the ambivalent pH adaptation molecular mechanisms in Y.
lipolytica coupled to an extreme halotolerance, remains obscure. Their discovery may
significantly contribute to practical applicability of Y. lipolytica.
2. Research objectives
Taking into account the availability of a complete genomic sequence, we aimed to apply
proteomics technique for the identification of Y. lipolytica proteins whose occurrence
depends on pH medium and apparently contributes to global mechanisms of pH
adaptation.
3. Methods
3.1 Yeast strain and culture conditions
Y. lipolytica strain PO1f (MatA, leu2-270, ura3-302, xpr2-322, axp-2) was purchased from
CIRM-Levures collection (France) where it was deposited under accession number CLIB-
724. The strain differs from the wild type Y. lipolytica by auxotrophy towards Leu and Ura
and by an ability to grow on sucrose. Y. lipolytica basic strain was maintained on solid
media of the following composition (g/l): yeast extract – 2.5; bactopeptone – 5.0; glycerol –
15.0; malt-extract– 3.0; agar – 20.0; pH 4.0-4.2 or 8.9-9.0. Liquid nutrient broths were
prepared as follows (g/l): - MgSO
4
×7H
2
O - 0.5; NaCl - 0.1; CaCl
2
- 0.05; KH
2
PO
4
- 2; K
2
HPO
4
× 3H
2
O – 0,5; (NH
4
)
2
SO
4
- 0.3; Ca pantotenate - 0.4; inositol - 2.0; nicotinic acid - 0.4; n-amino
benzoic - 0.2; pyridoxine -0.4; riboflavin - 0.2; thiamine - 0.1; biotin - 0.002; folic acid - 0.002;
H
3
BO
4
-0.5; CuSO
4
× 5H
2
O -0.04; KI - 0.1; FeCl
3
× 6H
2
O - 0.2; MnSO
4
× H
2
O - 0.4; NaMoO
4
×
2H
2
O - 0.2; ZnSO
4
- 0.4; pH – 4.0-4.2 or 8.9-9.0, yeast extract "Difco" - 2.0. 1% glycerol was
used as a principal carbon and energy supply. pH was controlled permanently during
cultivation.
3.2 Cell extract preparation
Cell cultures (24 h) were used for proteomic studies (average А
590
=7.5-8.0). The biomass
was harvested by centrifugation at 4000g for 10 min. The cells were washed twice with ice-
cold deionized water and eventually pelleted.
Identification of Proteins Involved in pH Adaptation in Extremophile Yeast Yarrowia lipolytica
211
To prepare protein extracts, 100 mg of the cell pellet was transferred to a vial containing 2ml
lysis buffer (9M urea, 5% β-mercaptoethanol, 2% Triton X-100, and 2% ampholytes, pH 3.5-
10 (Sigma, USA)) and thoroughly suspended. The sample was either immediately heated in
a boiling bath for 3-5 min or placed on ice and sonicated in an ultrasonic desintegrator
(MSE-Pharmacia) for 2 min (4 cycles 30 sec each). In both cases the homogenate was clarified
by centrifugation in a microfuge for 20 min at maximum speed. The pellet was discarded
and 100 μl of the clear supernatant was used for isoelectrofocusing (IEF).
3.3 Two-dimensional gel electrophoresis (2DE)
The first dimension separation employed IEF in glass tubes (2.4 × 180mm) filled with 4%
polyacrylamide gel prepared with 9M urea, 2% Triton X-100 and 2% ampholyte mixture.
Ampholytes of 5-7 and 3.5-10 pH ranges mixed at 4:1 ratio were used in all experiments. The
protein extracts (100μl) were applied at the acidic end of the gel, and IEF was carried out
using a Model 175 electrophoretic cell (Bio-Rad, USA) until 2400 V/h was achieved. The
polyacrylamide gel columns with protein samples separated by IEF were applied as a
starting point for separation in the second dimension, for which slab electrophoresis in
polyacrylamide gel (200 × 200 × 1 mm) was used with a linear 7.5-20% gradient of
acrylamide in the presence of 0.1% SDS using a vertical electrophoretic cell (Helicon
Company, Russia). A well was created for protein marker application at the edge of each gel
slab. Further details of the modified 2DE approach are described earlier (Kovalyova et al,
1994; Laptev et al, 1995; Kovalyov et al, 1995).
For protein visualization, the polyacrylamide gel slabs were stained with Coomassie Blue R-
250 and then with silver nitrate according to the well-described methods (Blum et al, 1987)
and modified by the addition of 0.8% acetic acid to sodium thiosulfate. The stained gels
were documented by scanning on an Epson Expression 1680 scanner, and densitometry was
carried out using the Melanie software (GeneBio, Switzerland) according to the
manufacturer’s protocol.
Molecular masses (M) of the fractionated proteins were determined by their electrophoretic
mobility in the second dimension as compared to protein markers from standard heart
muscle lysates (Kovalyova et al, 1994). The results of the mass determinations were verified
by a calibration curve plotted using a marker kit (MBI Fermentas, Lithuania) with M
ranging 10-200kDa. Isoelectric points (pI) of fractionated proteins were determined from
their electrophoretic location in the first dimension, as described earlier (Kovalyova et al,
1994; Laptev et al, 1995), taking into account the known localization of identified reference
proteins. Theoretical values of M were also taken from the Swiss-Prot database taking into
account evidence for posttranslational processing of signal sequences (when available).
3.4 Protein identification by mass spectrometry
Isolation of protein fractions from polyacrylamide gel slabs, hydrolysis with trypsin, and
peptide extraction for protein identification by matrix assisted laser desorption/ionization
time of flight mass-spectrometry (MALDI-TOF MS) were carried out according to published
protocols (Shevchenko et al, 1996) with some modifications (Govorun et al, 2003). A sample
(0.5 μl) was mixed on the target with equal volume of 20% acetonitrile containing 0.1%
trifluoroacetic acid and 20 mg/ml of 2,5-dihydroxybenzoic acid (Sigma-Aldrich, USA) and air
dried. Mass spectra were recorded on a Reflex III MALDI-TOF mass spectrometer (Bruker
Daltonics, USA) equipped with a UV-laser (336nm) in the positive mode with masses ranging
Proteomic Applications in Biology
212
from 500-8000Da. The mass spectra were internally calibrated using trypsin autolysis
products. The proteins were identified with Mascot software (Matrix Science, USA) using
databases of the US National Center of Biotechnological Information (ncbi.nhm.nih.gov).
The NCBI database was searched within a mass tolerance of ±70 ppm for the appropriate
species proteins; with one missed cleavage allowed. Protein score > 84 are significant
(p<0.05). Carbamidomethylation ion of a cysteine residue and the oxidation of methionine
are considered modification. Proteins were evaluated by considering the number of
matched tryptic peptides, the percentage coverage of the entire protein sequence, the
apparent MW, and the pI of the protein.
4. Results
4.1 Equalizing culture growth conditions
Previously we reported data about pH adaptation of Y. lipolytica carried out in minimal
synthetic medium with succinate as the single source of carbon and energy (Guseva et al,
2010). However, elucidation of principles enabling Y. lipolytica to survive under strong
alkaline conditions requires discrimination of partial physiological reactions of certain
media components. This is possible only if several media pairs (each with acidic and
alkaline pH) are compared. Therefore, we aimed to reproduce the experiments in a complete
liquid medium containing 2% yeast extract and 1% glycerol. It was prepared in three
versions with pH 4.0, 5.5 and 9.0. Growth curves were plotted using A
600
as a criterion (Fig.
1). The inoculums for each culture were produced on a solid medium using the same pH as
the main experiment. Inoculation dosage was ≈10
4
cells per ml.
Surprisingly, retardation of Y. lipolytica growth at pH 4.0 and 5.5 versus pH 9.0 was found
during periods of 1-20 h after inoculation. During periods of 20-24 h A
600
as well as cfu
contents, determined by microbiological method, were the same in all three cases.
Consequently, only 24 h old cultures were subjected to further proteomic studies.
Fig. 1. Growth curves of Y. lipolytica at rich media with different pH’s.
0
1
2
3
4
5
6
7
8
9
0 1020304050
рН
4,0
рН
5,5
рН
9,0
A
600
Hours after inoculatio
n
Media:
Identification of Proteins Involved in pH Adaptation in Extremophile Yeast Yarrowia lipolytica
213
4.2 Analysing morphological differences of Y. lipolytica culture by microscopy
Measuring A
600
of the culture is a precise and simple qualitative technique. However, it does
not allow the visualization of putative morphological cell changes under different pH
conditions. These changes may compromise the accuracy of A
600
data conversion to cell
number.
In order to track morphological changes in Y. lipolytica cells in liquid media at pH 4.0 and 9.0
cultures were subjected to visual phase-contrast microscopy (100
x
magnification) with no
fixation. The data (Fig. 2) demonstrate that average cell volume was 2-4 times larger in the
culture at pH 4.0 when compared to pH 9.0. The cells grown in alkaline media contained
massive vacuoles occupying most cell volume.
Taken together, these observations lead to conclusion that the volume of the cytoplasm
relative to the total volume of the cells is much reduced when growing under alkaline
conditions. One could also presume that the ratio between proteins in the cytoplasm and
intracellular membrane compartments (vacuoles, mitochondria, Golgi apparatus) may also
be altered (Brett & Merz, 2008).
4.3 Preparing Y. lipolytica protein extracts
Accurate pair-wise comparison of proteomes requires thorough equalizing and normalizing
of source biological material. Massive and tightly cross-linked polysaccharide cell walls are
a specific attribute of all yeast species including Y. lipolytica. It protects the cells from rapid
changes in environmental conditions but also substantially hinders experimental processing
of yeast samples (Dagley et al, 2011). This problem is commonly addressed in transcriptomic
studies, but proteomic research also requires optimal extraction procedures. Fortunately,
even mechanically durable cell walls are susceptible to mechanical crushing (ultrasonic
treatment, French-press, glass beads) but such procedures take time. In the course of
mechanical homogenization, intracellular lysosomes are broken, and thus incapsulated
cathepsins come in contact with cytoplasmic proteins. Taken together these issues may
result in the degradation of proteins that intend to be subjected to further analysis. On the
other hand, many membrane and cell-wall associated proteins are poorly extracted by water
or buffers. Moreover, detergent treatment does not always provide an exhaustive extraction
technique. Heavily glycosylated proteins located in ER, Golgi apparatus and in the cell wall
are often excluded by such processes (Morelle et al, 2009; Pascal et al, 2006).
These two problems substantially preclude complete characterization of the yeast proteome
and may compromise validity of the obtained data. Thus far, only a single report has
undertaken a proteomic study of Y. lipolytica (Morin et al, 2007). These authors analyzed
proteins from water soluble cell fractions produced by mechanical disintegration and the
subsequent removal of the insoluble fraction by centrifugation. Hence, the membrane, cell-
wall and cytoskeleton associated proteins were excluded from consideration. Taking into
account presumed contribution of membrane transport machinery to pH adaptation in Y.
lipolytica (Zvyagilskaya et al, 2000) a complete proteome assay seemed to be more relevant
to our research objectives.
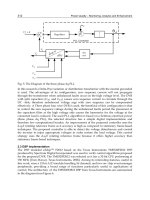
To address this problem, we proposed two modifications of a chemical lysis method
adapted from the preparation of human muscle tissue (Kovalyova et al, 2009). The first
modification (Fig. 3, 4 and 5) included the instant resuspension of the yeast cells in a hot
lysis buffer containing urea, reducing agent, Triton X-100 and ampholytes. The second
included a preliminary ultrasonic treatment of the cells suspended in the same buffer on ice
Proteomic Applications in Biology
214
А
B
Fig. 2. Y. lipolytica cells cultured in growth media under acidic (A; pH 4.0) and alkaline (B;
pH 9.0) conditions (growth time 24 h). Images from an optical microscope with 100
x
magnification.
Identification of Proteins Involved in pH Adaptation in Extremophile Yeast Yarrowia lipolytica
215
Fig. 3. 2D electophoregarm of Y. lipolytica proteome cultured on pH 4.0 medium (double
silver/Coomassie R-250 staining). The cells were lysed in the denaturing buffer without
mechanical disintegration. MALDI-TOF MS analysis of the spots specific for this specimen
(not found in Fig. 4 or 5).
Fig. 4. 2D electophoregarm of Y. lipolytica proteome cultured on pH 5.5 medium (double
silver/Coomassie R-250 staining). The cells were lysed in the denaturing buffer without
mechanical disintegration. MALDI-TOF MS analysis of the spots specific for this specimen
(not found on Fig. 3 and 5).
1
2
7
3
4
5
6
Proteomic Applications in Biology
216
Fig. 5. 2D electophoregarm of Y. lipolytica proteome cultured on pH 9.0 medium (double
silver/Coomassie R-250 staining). The cells were lysed in the denaturing buffer without
mechanical disintegration. MALDI-TOF MS analysis of the spots specific for this specimen
(not found on Fig. 3 and 4).
(Fig. 6 and 7). The volume ratio between cell pellet and the lysis buffer must be about 1:20.
The cells must be placed into a vial containing the buffer to provide instant resuspension of
the sample. After homogenization, the non-soluble pellet containing polysaccharides must
be discarded by an intensive centrifugation step to avoid clogging of IEF tubes.
Both methods resulted in gels that produced ≈1000 individual spots, compared to other
tested methods which rendered <100 spots (data not shown). However, the overall spot
pattern obtained by two methods from the same biological material was significantly
different (compare Fig. 3 to Fig. 6 and Fig. 5 to Fig. 7). Moreover, the quality of the protein
extract produced under alkaline conditions was always less than in samples produced
under acidic conditions. However, the results were highly reproducible for the same
method even when applied to independently cultured material.
4.4 Studies of Y. lipolytica protein extracts by 2DE and MALDI-TOF MS
A total of 5 types of extracts were analyzed. Three samples were produced using hot buffer
extraction from whole cells (the cultures were produced in media at pH 4.0, 5.5 and 9.0).
Two samples were obtained from the cells subjected to ultrasonic disintegration directly in
the ice-cold lysis buffer (the cultures were produced in media at pH 4.0 and 9.0). The unique
spots specific for each sample were identified by comparison with the samples obtained by
the same technique. Only intense spots corresponding to abundant cell proteins were
analyzed by MALDI-TOF MS. Although cultures produced at pH 4.0 and 5.5 were analyzed
separately, we suggest that differences between them must be considered as the “base-line
8
9
10
11
12
Identification of Proteins Involved in pH Adaptation in Extremophile Yeast Yarrowia lipolytica
217
Fig. 6. 2D electophoregarm of Y. lipolytica proteome cultured on pH 4.0 medium (double
silver/Coomassie R-250 staining). The cells were homogenized by ultrasonic treatment with
subsequent denaturing buffer without mechanical disintegration. MALDI-TOF MS analysis
of the spots specific for this specimen (not found on Fig. 7).
Fig. 7. 2D electophoregarm of Y. lipolytica proteome cultured on pH 9.0 medium (double
silver/Coomassie R-250 staining). The cells were homogenized by ultrasonic treatment with
subsequent denaturing buffer without mechanical disintegration. MALDI-TOF MS analysis
of the spots specific for this specimen (not found on Fig. 6).
4v
5v
6v
3v
7v
1v
2v
Proteomic Applications in Biology
218
fluctuation” since both pH ranges are considerably below the pH of the cytoplasm.
Comparison within this pair may allow an estimation of the reproducibility of the employed
techniques e.g. as described by (Huang et al, 2011).
The data shown demonstrates that many selected spots from the 2D electophoregrams were
not able to be identified by MALDI-TOF MS analysis (Table 1). Consequently, only two
Code Exp. Mr
kDa
YL protein
identified by
Mascot
Mascot
Score
Calc. Mr
Da
Homolo
g
ue with known
function
1 72 Invalid data
2 48 Invalid data
7 12 Invalid data
3 39 YALI0B03564p 106 34031
P43070 C. albicans Glucan
1,3- -glucosidase
precursor (EC 3.2.1.58)
(Exo-1-3-β- glucanase)
4 23 YALI0B15125p 247 21311
P34760 S. cerevisiae
YML028w TSA1 thiol-
specific antioxidant
5 25 Invalid data
6 13 YALI0F09229p 99 17031
P36010 S. cerevisiae
YKL067w YNK1
nucleoside diphosphate
kinase
8 75 Invalid data
9 38 Invalid data
10 11 Invalid data
11 29 YALI0F17314p 163 29514
P04840 S. cerevisiae
YNL055c POR1
mitochondrial outer
membrane porin
3v 13 YALI0E19723p 95 17290
P04037 S. cerevisiae
YGL187c COX4
cytochrome-c oxidase
chain IV
5v 24 YALI0F05214p 151 26679
P00942 S. cerevisiae
YDR050c TPI1 triose-
phosphate isomerase
singleton
6v 21 YALI0B03366p 97 20957
P14306 S. cerevisiae
YLR178C
carboxypeptidase Y
inhibitor (CPY inhibitor)
(Ic)(DKA1/NSP1/TFS1)
7v 12 Invalid data
1v 72 Invalid data
2v 12 YALI0D20526p 106 13681
P22943 S. cerevisiae
YFL014W 12 kDa heat
shock protein (Glucose
and lipid-regulated
protein)
Table 1. 2DE protein spots subjected to identification by MALDI-TOF MS
Identification of Proteins Involved in pH Adaptation in Extremophile Yeast Yarrowia lipolytica
219
clearly alkaline-inducible proteins were identified. The most prominent candidate proteins
exhibiting great pH-inducibility and high overall expression levels (e.g. 1v, 8, 9 and 10)
could not be identified. A higher proportion of spots were successfully identified from the
samples originating from pH 5.5 medium compared to the samples from pH 4.0 medium.
Furthermore, gel resolution and total number of resolved spots also increased under pH 5.5
conditions. This could be explained by the observation that the share of cytoplasm proteins
in the total cell volume is proportionally higher under optimal conditions (pH 5.5) and
decreases under acidic or alkaline stress in favor of the membrane compartments (vacuoles,
mitochondria, ER, Golgi apparatus) (see Fig. 2). This idea is supported by observation that 6
out of 8 proteins represented in Table 1 are “pH-reactive” and are allocated to non-
cytoplasm compartments. It is also in a good agreement with numerous communications
about involvement of ER and mitochondria to anti-stress adaptation of organisms from all
kingdoms (Hoepflinger et al 2011; Rodriguez-Colman et al, 2010). Reactive oxygen species
(ROS) formation accompanies all responses to stresses and cross-talk between ER and
mitochondria contributes to abatement of damage caused by uncontrolled oxidation (Bravo
et al, 2011; Tikunov et al, 2010).
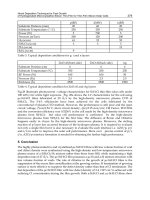
4.5 Functions and genomic organisation of the genes encoding potential “pH-reactive
proteins” in Y. lipolytica
In order to systematically assess properties of the up-and down-regulated alkaline-sensitive
proteins, we arranged the available functional data from Swiss-Prot records for each
identified protein (Table 2).
Genomic localization of the pH-regulated proteins is not uniform. However, one can make
an observation that no pH-reactive genes were found on chromosomes A or C.
The data demonstrate an important role of non-cytoplasmic cell compartments in the pH
adaptation of Y. lipolytica. Only two proteins (4 and 5v) from the eight identified have
annotated subcellular locations corresponding to the cytoplasm. While it is possible that
adaptation to the acidic and alkaline pH depends on these polypeptide structures, one must
take into account that many potentially important pH-reactive proteins failed to be
identified. Therefore, we cannot conclude that all major pH-reactive proteins were found. It
is worth noting that this and other studies (Guseva et al, 2010) have failed to identify plasma
membrane components (ATPase subunits and pumps) responsible for direct ion exchange
between the cytoplasm and the environment.
A comparison of this study with pH-reactive proteins identified previously (Guseva et al,
2010) in Y. lipolytica cultivated on a minimal medium with succinate was undertaken. Two
proteins YALI0F17314p and YALI0B03366p were found in both cases. YALI0F17314p (outer
membrane mitochondrial porin, VDAC) was the only alkaline-inducible protein found in
both cases. In contrast, YALI0B03366p (carboxypeptidase Y inhibitor, a lysosomal
component) was found to be an alkaline-inducible on minimal medium with succinate and
alkaline-repressible in complete medium with glycerol (present study). This comparison
leads to the conclusion that the outer membrane mitochondrial porin is possibly an essential
part of Y. lipolytica pH-adaptation machinery, independent of the utilized nutrient source.
Another identified alkaline-inducible component of Y. lipolytica, Hsp12 is an intrinsically
unstructured stress protein that folds upon membrane association and modulates
membrane function (Welker et al, 2010). Hsp12 of S. cerevisiae is upregulated several 100-
fold in response to stress. Our phenotypic analysis showed that this protein is important for
survival under a variety of stress conditions, including high temperature. In the absence of
Proteomic Applications in Biology
220
a. Alkaline-inducible proteins
Code YL
Swiss
-Prot
acc. #
Function Protein cell
localization
Gene (Gene
Bank acc.
Number)
Chromosom
al
localization
11 YALI
0F173
14p
POR1
mitochondrial
outer membrane
porin
Outer mebrane
of mitochondria
gi|50556244 F (2311796-
2313207)
2v YALI
0D20
526p
12 kDa heat shock
protein
Cytoplasm/inte
rnal membrans
gi|50551205 D (2604298-
2604907)
b. Alkaline-repressible proteins
Code YL
Swiss
-Prot
acc. #
Function Protein cell
localization
Gene (Gene
Bank acc.
Number)
Chromosoma
l localization
3 YALI
0B035
64p
Glucan 1,3- beta -
glucosidase
precursor
Golgi appartus gi|50545854 B (498811-
499752)
4 YALI
0B151
25p
Peroxiredoxin
(PRX) family,
Typical 2-Cys
PRX subfamily
Cytoplasm gi|50546891 B (2015063-
2015653)
6 YALI
0F092
29p
nucleoside
diphosphate
kinase
Mitochondria
matrix
gi|50555578 F (1287080-
1287730)
3v YALI
0E197
23p
COX4
cytochrome-c
oxidase chain IV
Inner
membrane of
mitochondria
gi|50553496 E (2354436-
2354924)
5v YALI
0F052
14p
TPI1 triose-
phosphate
isomerase
singleton
(glycolysis)
Cytoplasm gi|50555229 F (783915-
784734)
6v YALI
0B033
66p
carboxypeptidase
Y inhibitor
Vacuole gi|50545840 B (481138-
482256)
Table 2. Functions and genomic organisation of the genes encoding potential “pH-reactive
proteins” in Y. lipolytica
Hsp12, we observed changes in cell morphology under stress conditions. Surprisingly, in
the cell, Hsp12 exists both as a soluble cytosolic protein and associated with the plasma
membrane. The in vitro analysis revealed that Hsp12, unlike all other Hsps studied so far, is
completely unfolded; however, in the presence of certain lipids, it adopts a helical structure.
Identification of Proteins Involved in pH Adaptation in Extremophile Yeast Yarrowia lipolytica
221
The presence of Hsp12 does not alter the overall lipid composition of the plasma membrane
but increases membrane stability (Welker et al, 2010). This information allows us to
hypothesize that the biological function of Hsp12 is in rearranging and repairing membrane
compartments under the stress conditions. This point of view is in perfect agreement with
observations about the key role of the inner membrane compartments in the alkaline
adaptation in Y. lipolytica. Unfortunately the involvement of this protein in many types of
stress responses may result in data concerning its expression pattern poorly reproducible.
5. Conclusion
A new yeast cell extraction procedure enabled the resolution of more than 1000 individual
protein spots of Y. lipolytica samples for each gel. This is ∼2-fold more than in outlined by
previous studies (Morin et al, 2007) where water soluble cell fractions were analyzed. In
total, two proteins were up-regulated at pH 9.0, the mitochondrial outer membrane porin
(VDAC ) and 12 kDa heat shock protein.
These data complement the conclusions by Morin et al (2007) who emphasized the
occurrence of energy metabolism proteins within the proteome portion as up-regulated in Y.
lipolytica hyphae during the dimorphic transition. Similar conclusions were reported for
stress adaptation in S. cerevisiae (Martínez-Pastor et al, 2010; Rodriguez-Colman et al, 2010)
and Candida albicans (Dagley et al, 2011). VDAC is not only responsible for protein import
into mitochondria but essentially contributes to antioxidant resistance of mitochondria
(Tikunov et al, 2010).
To the best of our knowledge, we provide the first report about the application of proteomic
techniques to address the problem of Y. lipolytica adaptation to growth in alkaline
conditions. In contrast to the previously hypothesized involvement of plasma membrane
transporters and global transcription regulators (e.g. Rim101) in high pH adaptation, our
study elucidated a key role for mitochondrial proteins and represents a new result for Y.
lipolytica. On the other hand, this observation is in a good agreement with reports
concerning the pivotal role of non-cytoplasmic compartments in stress adaptation in other
biological systems e.g. yeast and plants (Bravo et al, 2011; Hoepflinger et al 2011; Rodriguez-
Colman et al, 2010).
In our opinion, this work exemplifies a prompt and inexpensive study which could be easily
undertaken for any physiological experiment with the organisms whose genome has been
recently sequenced. Finally, it should be noted that a total cell proteome assay is strongly
recommended for this kind of study, although some effort to determine an appropriate lysis
buffer for protein extraction must be undertaken.
6. References
Blum, H.; Beir, H. & Cross, H.G. (1987) Improved silver staining of plant proteins, RNA and
DNA in polyacrylamide gels. Electrophoresis, Vol. 8, No. 2, (February 1987), pp. 93-
99, ISSN 0173-0835.
Bravo, R.; Vicencio, JM.; Parra, V.; Troncoso, R.; Munoz, JP.; Bui, M.; Quiroga, C.; Rodriguez,
AE.; Verdejo, H.E.; Ferreira, J.; Iglewski, M.; Chiong, M.; Simmen, T.; Zorzano, A.;
Hill, J.A.; Rothermel, B.A.; Szabadkai, G.; Lavandero, S. (2011) Increased ER-
mitochondrial coupling promotes mitochondrial respiration and bioenergetics
Proteomic Applications in Biology
222
during early phases of ER stress. Journal of Cell Science, Vol. 124, No. 13, (July 2011),
pp. 2143-2152, ISSN 2157-7013.
Brett, C.L. & Merz, A.J. (2008) Osmotic regulation of Rab-mediated organelle docking.
Current Biology, Vol. 18, No. 14, pp. 1072-1077, (July 2008), ISSN 0960-9822.
Dagley, M.J.; Gentle, I.E.; Beilharz, T.H.; Pettolino, F.A.; Djordjevic, J.T.; Lo, T.L.;
Uwamahoro, N.; Rupasinghe, T.; Tull, D.L.; McConville, M.; Beaurepaire, C.;
Nantel, A.; Lithgow, T.; Mitchell, A.P. & Traven, A. (2011) Cell wall integrity is
linked to mitochondria and phospholipid homeostasis in Candida albicans through
the activity of the post-transcriptional regulator Ccr4-Pop2. Molecular Microbiolgy,
Vol. 79, No. 4, (February 2011), pp. 968-989, ISSN 0950-382X.
Dujon, B., Sherman, D., Fischer, G., Durrens, P., Casaregola, S., Lafontaine, I., De Montigny,
J., Marck, C., Neuvéglise, C., Talla, E., Goffard, N., Frangeul, L., Aigle, M.,
Anthouard, V., Babour, A.; Barbe, V.; Barnay, S.; Blanchin, S.; Beckerich, J.M.;
Beyne, E.; Bleykasten, C.; Boisramé, A.; Boyer, J.; Cattolico, L.; Confanioleri, F.; De
Daruvar, A.; Despons, L.; Fabre, E.; Fairhead, C.; Ferry-Dumazet, H.; Groppi, A.;
Hantraye, F.; Hennequin, C.; Jauniaux, N.; Joyet, P.; Kachouri, R.; Kerrest, A.;
Koszul, R.; Lemaire, M.; Lesur, I.; Ma, L.; Muller, H.; Nicaud, JM.; Nikolski, M.;
Oztas, S.; Ozier-Kalogeropoulos, O.; Pellenz, S.; Potier, S.; Richard, G.F.; Straub,
M.L.; Suleau, A.; Swennen, D.; Tekaia, F.; Wésolowski-Louvel, M.; Westhof, E.;
Wirth, B.; Zeniou-Meyer, M.; Zivanovic, I.; Bolotin-Fukuhara, M.; Thierry, A.;
Bouchier, C.; Caudron, B.; Scarpelli, C.; Gaillardin, C.; Weissenbach, J.; Wincker, P.
& Souciet, J.L. (2004) Genome evolution in yeasts. Nature, Vol. 430, No. 6995, (July
2004) pp. 35-44, ISSN 0028-0836.
Govorun, V.M.; Moshkovskii, S.A.; Tikhonova, O.V.; Goufman, E.I.; Serebryakova, M.V.;
Momynaliev, K.T.; Lokhov, P.G.; Khryapova, E.V.; Kudryavtseva, L.V.; Smirnova,
O.V.; Toropygin, I.Yu.; Maksimov, B.I. & Archakov, A.I. (2003) Comparative
analysis of proteome maps of Helicobacter pylori clinical isolates. Biochemistry
(Moscow), Vol. 68, No. 1, (January 2003), pp. 42-49, ISSN 0006-2979.
Guseva, M.A.; Epova, E.Iu.; Kovalev, L.I. & Shevelev, A.B. (2010). The study of adaptation
mechanisms of Yarrowia lipolytica yeast to alkaline conditions by means of
proteomics. Prikladnaia Biokhimiia i Mikrobiologiia (Moscow), Vol. 46, No. 3, (May-
June 2010), pp. 336-341, ISSN 1521-6543.
Hoepflinger, M.C.; Pieslinger, A.M. & Tenhaken, R. (2011) Investigations on N-rich protein
(NRP) of Arabidopsis thaliana under different stress conditions. Plant Physiology
and Biochemistry (March 2011) Vol. 49, No. 3, pp. 293-302, ISSN 0981-9428
Huang C.J.; Damasceno L.M.; Anderson K.A.; Zhang S.; Old L.J. & Batt C.A. (2011) A
proteomic analysis of the Pichia pastoris secretome in methanol-induced cultures.
Appl Microbiol Biotechnol, Vol. 90, No. 1, (April 2011), pp. 235-247, ISSN 0175-7598.
Kovalyov, L.I.; Shishkin, S.S.; Efimochkin, A.S.; Kovalyova, M.A.; Ershova, E.S.; Egorov,
T.A., & Musalyamov, A.K. (1995) The major protein expression profile and two-
dimensional protein database of human heart. Electrophoresis, Vol. 16, No. 7, (July
1995), pp. 1160-1169, ISSN 0173-0835.
Kovalyova, M.A.; Kovalyov, L.I.; Khudaidatov, A.I.; Efimochkin, A.S. & Shishkin, S.S. (1994)
Comparative analysis of protein composition of human skeleton and cardiac
muscle by 2D electrophoresis. Biochemistry (Moscow), Vol. 59, No. 5, (May 1994), pp.
493-498, ISSN 0006-2979.
Identification of Proteins Involved in pH Adaptation in Extremophile Yeast Yarrowia lipolytica
223
Kovalyova M.A.; Kovalyov L.I.; Toropygin I.Y.; Shigeev S.V.; Ivanov A.V. & Shishkin S.S.
(2009) Proteomic analysis of human skeletal muscle (m. vastus lateralis) proteins:
identification of 89 gene expression products. Biochemistry (Moscow), Vol. 74, No.
11, (November 2009), pp. 1239-1252, ISSN 0006-2979.
Lambert, M.; Blanchin-Roland, S.; Le Louedec F.; Lepingle, A. & Gaillardin, C. (1997)
Genetic analysis of regulatory mutants affecting synthesis of extracellular
proteinases in the yeast Yarrowia lipolytica: identification of a RIM101/pacC
homolog. Molecular and Cellular Biology, Vol. 17, No. 7, (July 1997), pp. 3966-3976,
ISSN 0270-7306.
Laptev, A.V.; Shishkin, S.S.; Egorov, Ts.A.; Kovalyov, L.I.; Tsvetkova, M.N.; Galyuk, M.A.;
Musalyamov, A.Kh. & Efimochkin, A.S. (1994) Searching new gene products in
human cardiac muscle. Microsequencing proteins after 2D-electrophoresis.
Molecular Biology (Moscow), Vol. 28, (Jan-Feb 1994), pp. 52-58, ISSN0026-8933.
Martínez-Pastor, M.; Proft, M. & Pascual-Ahuir, A. (2010) Adaptive changes of the yeast
mitochondrial proteome in response to salt stress. OMICS, Vol. 14, No. 5, (October
2010), pp. 541-552, ISSN 1557-8100.
Morelle, W.; Faid, V.; Chirat, F. & Michalski, J.C. (2009) Analysis of N- and O-linked glycans
from glycoproteins using MALDI-TOF mass spectrometry. Methods in Molecular
Biology, Vol. 5, No. 34, (Mach 2009), pp. 5-21, ISSN:1064-3745
Morín, M.; Monteoliva, L.; Insenser, M.; Gil, C. & Domínguez, A. (2007) Proteomic analysis
reveals metabolic changes during yeast to hypha transition in Yarrowia lipolytica.
Journal of Mass Spectrometry, Vol. 42, No. 11, (November 2007), pp. 1453-1462, ISSN
1076-5174.
Pascal, C.; Bigey, F.; Ratomahenina, R.; Boze, H.; Moulin, G. & Sarni-Manchado P. (2006)
Overexpression and characterization of two human salivary proline rich proteins.
Protein expression and purification, Vol. 47, No. 2, (June 2006), pp. 524-532, ISSN 1046-
5928.
Rodriguez-Colman M.J.; Reverter-Branchat, G.; Sorolla, M.A.; Tamarit, J.; Ros, J. & Cabiscol,
E. (2010) The forkhead transcription factor Hcm1 promotes mitochondrial
biogenesis and stress resistance in yeast. Journal of Biological Chemistry, Vol. 285, No
47, (November 2010), pp. 37092-37101, ISSN 0021-9258.
Shevchenko, A.; Wilm, M.; Vorm, O. & Mann, M. (1996) Mass spectrometric sequencing of
proteins from silver-stained polyacrylamide gels. Analytical Chemistry, Vol. 68, No.
5, (March 1996), pp. 850-858, ISSN 0003-2700.
Tikunov, A.; Johnson, C.B.; Pediaditakis, P.; Markevich, N.; Macdonald, J.M.; Lemasters, J.J.
& Holmuhamedov E. (2010) Closure of VDAC causes oxidative stress and
accelerates the Ca(2+)-induced mitochondrial permeability transition in rat liver
mitochondria. Archives of Biochemistry and Biophysics, Vol. 495, No. 2, (March 2010),
pp. 174-181, ISSN 0003-9861
Welker S.; Rudolph B.; Frenzel E.; Hagn F.; Liebisch G.; Schmitz G.; Scheuring J.; Kerth A.;
Blume A.; Weinkauf S.; Haslbeck M.; Kessler H. & Buchner J. (2010) Hsp12 is an
intrinsically unstructured stress protein that folds upon membrane association and
modulates membrane function. Molecular Cell, Vol. 39, No. 4, (August 2010), pp.
507-520, ISSN 1097-2765.
Yuzbashev, T.V.; Yuzbasheva, E.Y.; Sobolevskaya, T.I.; Laptev, I.A.; Vybornaya, T.V.; Larina,
A.S.; Matsui, K.; Fukui, K. & Sineoky, S.P. (2010). Production of succinic acid at low
Proteomic Applications in Biology
224
pH by a recombinant strain of the aerobic yeast Yarrowia lipolytica. Biotechnology and
Bioengineering, Vol. 107, No. 4, (November 2010), pp. 673-682, ISSN 1097-0290.
Zvyagilskaya, R.; Parchomenko, O. & Persson, B.L. (2000) Phosphate-uptake systems in
Yarrowia lipolytica cells grown under alkaline conditions. IUBMB Life, Vol. 50, No. 2,
(August 2000), pp. 151-155, ISSN 1521-6543.
11
The Role of Conventional Two-Dimensional
Electrophoresis (2DE) and Its Newer
Applications in the Study of Snake Venoms
Jaya Vejayan
1
*, Mei San Tang
1
and Ibrahim Halijah
2
1
School of Medicine and Health Sciences,
Monash University Sunway Campus,
Jalan Lagoon Selatan, Selangor Darul Ehsan
2
Institute of Biological Sciences, University of Malaya, Kuala Lumpur
Malaysia
1. Introduction
The objective of this chapter is to provide an overview of the different approaches that have
been undertaken in our laboratory and by other researchers to investigate the different
aspects of snake venoms using two-dimensional electrophoresis (2DE). It will also highlight
the few novel modifications that we have employed to improve the protocol of 2DE, in
order to further increase its versatility as a research tool in the study of snake venoms.
2. The utilization of proteomics to characterize snake venoms
The biological and pathological activities of snake venoms are associated with proteins and
peptides in the venoms. These venom constituents are often conveniently classified as either
neurotoxic or hemotoxic (Calvete et al., 2009). The venoms of the Elapidae and Viperidae
families are among the most thoroughly investigated. The main constituents of the Elapidae
venoms are the neurotoxic proteins with lower molecular weights. On the other hand, the
main constituents of the Viperidae venoms are the hemotoxic proteins with higher
molecular weights. Nevertheless, this classification is not mutually exclusive, since in certain
venoms, such as the Elapidae Ophiophagus hannah, the main constituents are the higher
molecular weight enzymes, which are typically more characteristic of Viperidae venoms
(Tan & Saifuddin, 1989). Apart from this widely accepted classification of neurotoxins and
hemotoxins, the other aspect in the diversity of venom proteins includes the relative
abundances of each protein family. High abundance proteins are important in generic
killing and are generally the primary targets of immunotherapy while low abundance
proteins are considered to be more important in evolutionary studies (Calvete et al., 2009).
Understanding the differences in venom proteins abundances is important as it also has an
influence on the method that is required to study these proteins with different abundances
in different venoms.
In the early studies of snake venoms, in order to dissect and to analyze the complexity of
snake venom constituents, the typical workflow employed has been to isolate and
subsequently characterize the biochemical characteristics of individual venom proteins
Proteomic Applications in Biology
226
(Bougis et al., 1986; Graham et al., 2008; Ownby & Colberg, 1987; Tan & Saifuddin, 1989). For
example, the crude venom of O. hannah was fractionated by Sephadex G75 gel filtration
chromatography and DEAE-Sephacel ion-exchange chromatography and the biological
properties of the individual chromatography fractions were subsequently determined by
utilizing various biochemical assays (Tan & Saifuddin, 1989). The objectives of the study
were to investigate the presence of toxic components in the O. hannah venom and to provide
information for further investigations of the biochemistry and toxicology of O. hannah
venom. Graham et al (2008) analyzed 30 venoms from the Elapidae and Viperidae families
by G50 gel filtration chromatography and following comparison of the chromatography
profiles, definitive patterns that could be used for preliminary analyses of venom
components were established.
However, the comparison of elution profiles was limited by the less-than-optimum
resolution of peaks, especially those containing venom components that were present at
higher amount in the venom, resulting in broader peaks within the chromatography
profiles, masking the presence of other components (Chippaux et al., 1991). Biochemical
analysis and characterization also did not allow for the differentiation and comparison of
venom constituents in terms of protein structure (Chippaux et al., 1991). Nevertheless, with
the development and refinement of chromatographic techniques that allow for further
detailed analyses of fraction components, such strategy of isolation and characterization of
venom constituents remains the mainstay of toxinology (Graham et al., 2008).
Notwithstanding the few limitations of 2DE, its recent revitalization and its utilization as
part of the workflow to analyze venom complexity has encouraged a new direction in
venom studies that uses a more global approach in visualizing venom complexity (Fox &
Serrano, 2008). Separating proteins based on two independent parameters – pI value by
isoelectric focusing (IEF) in the first dimension and molecular weight by SDS-PAGE in the
second dimension – 2DE is able to resolve venom proteins into a few thousand individual
spots, producing a specific profile for each venom analyzed via 2DE (Carrette et al., 2006).
The different 2DE profiles of venoms will then be used for comparison and this concept of
between-gel comparison, or comparative proteomics, has largely been put into a few
different practical applications of snake venom study.
2.1 Venom variation
Venom variation is one of the very important aspects in the study of snake venom. Snake
venom variation is essential to both basic venom research and the management of snake
envenomation (Fox & Serrano, 2008). During the selection of a snake donor for crude venom
that is to be used for research purposes, it is essential that the chosen venoms are rich in the
components of study interests (Chippaux et al., 1991). Therapeutically, the knowledge of
venom variations at all levels, including inter-species and intra-species variations, would aid
in the decision of an appropriate antivenom and allow for more effective treatment of
envenomation victims (Chippaux et al., 1991). Subsequently, the production of antivenom is
also reliant on the knowledge of venom variations.
Within our laboratory, we have attempted to develop a 2DE-based approach to investigate
the variations among the venoms of eight Malaysian snakes (Vejayan et al., 2010). Even
though there were venom proteins distributed throughout the entire 2DE profiles, as
expected with such a complex sample, a closer examination revealed that each venom
profile had its own distinguishing features. For instance, each of the three Crotalinae
venoms (Trimeresurus sumatranus, Tropidolaemus wagleri, Calloselasma rhodostoma) had profiles