Proteomics Human Diseases and Protein Functions Part 6 docx
Bạn đang xem bản rút gọn của tài liệu. Xem và tải ngay bản đầy đủ của tài liệu tại đây (3.17 MB, 25 trang )
Proteomics – Human Diseases and Protein Functions
114
5.1 Materials and methods
5.1.1 Tissue cultures
All of the cell cultures were maintained at 37
o
C and 5% CO
2
in a humidified cultured
chamber. C2C12 myoblasts (ATCC) and D122 Lewis lung carcinoma cells (gift from Lea
Eisenbach) were cultured in DMEM medium supplemented with 10% FBS and
penicillin/streptomycin. Two stably transfected cell lines were produced from D122 using a
pcDNA3.1 expression vector. D122v3B harbor the empty vector, while D122a4 cells over-
express the full length BRE (Chan et al., 2005). D122v3B and D122a4 were maintained in
DMEM plus 10% FBS and 400 mg/mL of G418 (Invitrogen), Immortalized human
esophageal epithelial (SHEE) cell line and the malignantly transformed esophageal
carcinoma cell line (SHEEC) were cultured in DMEM medium plus F-12 Nutrient Mixture
(1:1) supplemented with 10% FBS (GibcoBRL) and penicillin/streptomycin (Shen et al.,
2000). Chang cells (ATCC, CCL-13) were cultured in Minimum Essential Medium Eagle plus
10% FBS.
5.1.2 Transgenic mice
The transgenic mice were generated carrying the full-length BRE gene and the transthyretin
(TTR) promoter. The TTR promoter is specifically expressed in hepatocytes in the liver
(Ching et al, 2001). All mice were maintained in the Laboratory Animal Services Centre,
Chinese University of Hong Kong. Ethical approval has been obtained from the animal
ethics committee, Chinese University of Hong Kong before performing the animal
experiments.
5.1.3 Subcellular fractioning of soluble proteins
SHEE and SHEEC cells were extracted in lysis buffer (8M Urea, 2M Thiourea, 2% CHAPS,
0.01% TBP, 0.01% NP-40) containing protease inhibitors (GE Healthcare). After extraction,
the lysates were incubated on ice for 30 min and then centrifuged at 8000 rpm for 15 min to
remove all cell debris. The fractions (cytosol, membrane, and nucleoplasm) were obtained
using a ProteoExtract Subcellular Proteome Extraction Kit (Calbiochem) following
instructions provided by the manufacturer. The total protein concentration for each fraction
was determined using a Bio-Rad Protein Assay kit (Bio-Rad, Richmond).
5.1.4 BRE gene silencing analysis
Two BRE-specific siRNAs were designed corresponding to 5’-
TCTGGCTGCACATCATTGA-3’ (nucleotides 124–142, nucleotide position number 1 being
the start of the initiation codon), and 5’-CTGGACTGGTGAATTTTCA-3’ (nucleotides 491–
509). siRNA sequence 5’-AAGCCUCGAAAUAUCUCCU-dTT-3’ with no known mRNA
targets was used as a control.
5.1.5 Semi-quantitative RT-PCR analysis
The total RNA was isolated and purified by using TRIzol solution (Invitrogen Corporation,
United States). 1 µg of the total RNA was used for reverse-transcription to synthesize the
complementary DNA (cDNA) according to the procedures of ImProm-II™ Reverse
Transcription System. cDNA was used as the template for PCR amplification. 20 μl of PCR
mixture containing 1 μl of cDNA, 2.5 μl of PCR 10X buffer (Bio-firm, Hong Kong), 0.75 μl of
magnesium chloride solution (25 mM, Bio-firm, Hong Kong), 1 μl of dNTP mix (10 mM,
Comparative Proteomics:
An Approach to Elucidating the Function of a Novel Gene Called BRE
115
Promega Corporation, United States), 1 μl of forward primer, 1 μl of reverse primer, 0.25 μl of
Taq polymerase (Bio-firm, Hong Kong) and DEPC-treated water in a PCR microcentrifuge
tube was placed into the thermal cycler for PCR amplification. All of the primers used in this
study were manufactured and desalted by Invitrogen Corporation. The primers’ sequences
and the annealing temperature and duration shown in Table 1 were designed with Primer3
Primers Sequences
Annealing
temp &
duration
mouse
β
-actin
Forward: 5’-TGAGACCTTCAACACCCCAG-3’ and
Reverse: 5’-TTCATGAGGTAGTCTGTCAGGTCC-3’
or
forward: 5’-TGAGACCTTCAACACCCCAG-3’
reverse: 5’-TTCATGAGGTAGTCT GTCAGGTCC-3’
59
o
C
, 45s
55
o
C , 60s
mouse
BRE
Forward: 5’-CTAGTCGCCGGTTACTGA-3’
Reverse: 5’-TTCATGAGGTAGTCTGTCA-3’
or
Forward: 5’-CCACATTCCCACATACCTTCTC-3’
Reverse: 5’—GCCATTTCATTTCCATCCCATC-3’
56
o
C, 45s
55
o
C, 60s
mouse
M
dm4
Forward: 5’-CTCCAAGCAAGAGGTACTG-3’
Reverse: 5’-AATGACCTGGTCCTCCTAG-3’
54
o
C, 60s
M
ouse Akt-3
Forward: 5’-
CTGGCACCAGAGGTATTAGA-3’
Reverse: 5’-AGGAGAACTGAGGGAAGTGT-3’
56
o
C, 60s
M
ouse 26S Proteasome
Forward: 5’-TGATCTGTAACCTGGCCTAC-3’
Reverse: 5’-GTTACCCTCAGTGTCTTGGA-
57
o
C, 60s
mouse
Prohibitin
Forward: 5’-TGAGTGATGACCTCACAGA-3
Reverse: 5’-CAGTCTGCATAGGCACTTG-3’
54
o
C, 45s
mouse
p
53
Forward:5’-ACTCTCCTCCCCTCAATAAG-3’
Reverse: 5’-CTGGAGTCTTCCAGTGTGAT-3’
54
o
C, 60s
human
β
-actin
Forward: 5’-ATGGATGATGATATCGCCGCG-3’
Reverse: 5’-CTCCATGTCGTCCCAGTTG GT-3’
55
o
C, 45s
human BRE
Forward:
5’-ATCTTGCCTCCTGGAATCCT-3’
Reverse: 5’-CACGTACTGCACCTTGTTGG-3’
57
o
C, 60s
human Prohibitin
Forward: 5’-
CGGAG AGGACTATGATGAGC-3’
Reverse: 5’- GGTAGGTGATGTTCCGAGAG-3’
57
o
C, 60s
human c
y
clin A
Forward: 5’-TCCTGTCTTCCATGTCAGTG-3’
Reverse: 5’- TAGGTCTGGTGAAGGTCCAT-3’
57
o
C,60s
Human TNF-R1
Forward: 5’-
ACCAAGTGCCACAAAGGAACC -3’
Reverse: 5’-TACACACGGTGTTCTGTTTCTCC -3’
56
o
C, 60s
human
p
53
Forward: 5’-GCCTGACTCAGACTGACATT-3’
Reverse 5’-GACAGCTTCCCTGGTTAGTA-3’
54
o
C, 60s
mouse TUSC4
Forward: 5’-CTGGTATCC ATCCTCCAGTA-3’
Reverse: 5’-GTCTTGCAGCAGATCTCATC-3’
53
o
C, 60s
mouse ENO1
Forward: 5’-CTACGAGGCCCTCTAAGAACTCC-3’
Reverse: 5’-TCCTTCCCGTACTTCTCCTT-3’
58
o
C, 60s
mouse DPF2
Forward: 5’-TCCTTGGCGAGC AATACTAC-3’
Reverse: 5’-GCTGCCATCCTGAGAGATAA -3’
53
o
C, 60s
mouse HSPA7
Forward: 5’-GCAGTCGGATATGAAGCACT-3’
Reverse: 5’-CTCCTCCCAAGTGGGTATCT-3’
58
o
C, 60s
mouse HSPA2
Forward: 5’-GACGAATGTCAGGAGGTGAT-3’
Reverse: 5’-CTAAGTTGTTGCACCTCTCC-3’
58
o
C, 60s
Table 1. Primers used in the study.
Proteomics – Human Diseases and Protein Functions
116
software (version 0.4.0, Rozen and Skaletsky; ). The PCR mixtures
were reacted in a PTC-100 thermal cycler (MJ Research, Watertown, MA, USA) set under the
following amplification conditions: initial denaturation at 95°C for 2 min, followed by a total of
35 cycles of denaturation at 95°C for 1 min, annealing at different temperature according to the
primer’ conditions as shown in Table 1 and extension at 72°C for 1 min. An additional 7 min
extension step at 72ºC was performed at the end of the last cycle. After the electrophoresis, the
PCR products were analyzed on a 1.5% agarose gel with ethidium bromide staining, the
intensities of the PCR products were visualized and determined using the GelDoc-It imaging
system (UVP, BioImaging System, USA). β-actin was used as a house keeping gene for internal
control and normalization. The experiments were repeated three times.
5.1.6 Western blot analysis
Control and treated cells were lysed in 200 μl of lysis buffer (50 mM NaCl, 20 mM Tris, pH
7.6, 1% NP-40, 1 X protease inhibitor mixture) for 60 min. The lysates were cleared by
centrifugation at 16 000×g at 4
o
C for 10 min. Crude protein concentration was measured by
using a protein assay kit (Bio-Rad). 30 to 50 μg of total protein lysate were resolved on 10 to
12% SDS-PAGE, with Rainbow molecular weight markers and electroblotted onto Hybond
NC membranes (GE Healthcare). The blots were incubated with Akt-3 (1:100, sc-11521 Santa
Cruz Biotechnology), Bre (1:500 to 1000, Chan et al,. 2008), mdmX (1:100, sc-14738, Santa
Cruz Biotechnology), prohibitin (1:000, sc-18196, Santa Cruz Biotechnology),p53 (1:000, sc-
6243, Santa Cruz Biotechnology) or -tubulin (1:1000 to 1500, Zymed Laboratories), -
tubulin (1:1500, Zymed Laboratories), cyclin A (1:1000, sc-11521, Santa Cruz Biotechnology),
prohibitin (1:600, sc-18196, Santa Cruz Biotechnology), TNF-R1 (1:800, sc-8436, Santa Cruz
Biotechnology), CDK2 (M2) (1:800, sc-163 Santa Cruz Biotechnology). Bound antibodies
were detected using the appropriate horseradish peroxidase-conjugated secondary
antibodies (Southern biotechnology), followed by development with an ECL Western
blotting Detection kit (GE Healthcare). The blots were analyzed using Quantity One
software (Bio-Rad) and the intensity of the bands produced for each antibody was
normalized against the tubulin band (internal control) produced from each sample. Three
replicates of each sample were studied.
5.1.7 In situ hybridization
All of the procedures performed were according to Lee et al. (2001). The liver samples were
fixed in 4% paraformaldehyde (w/v, Sigma, United States) for 24 hrs. The fixed samples
were washed in Dulbecco’s Phosphate Buffered Saline (DPBS, Invitrogen Corporation,
United States) for 15 min with three changes. The samples were then dehydrated, cleared
and embedded in paraffin wax. Finally, the specimens were sectioned at 7 μm and mounted
onto TESPA treated slides. The riboprobe was prepared from pGEM-T plasmid containing
1,205 bp encoding BRE sequence. The plasmid cDNA was linearized by EcoRI and in-vitro
transcribed to generate digoxigenin (DIG)-labeled sense and antisense BRE riboprobe using
a DIG RNA labeling kit (Roche Applied Science, United States). After dewaxing the paraffin
sections, the specimens were rehydrated and equilibrated in DPBS for 10 min. The sections
were digested with 10 μg/ml of proteinase K (Fermentas Life Science, Canada) for 7 min
and post-fixed in 2% paraformaldehyde for 5 min. After washing in DPBS for 10 minutes
twice, the samples were incubated in pre-hybridization buffer (2X SSC, 1X Denhardt’s
reagent, 5mM EDTA , 0.1% sodium dodecyl sulfate, 10X Dextran sulfate (Chemicon, United
Comparative Proteomics:
An Approach to Elucidating the Function of a Novel Gene Called BRE
117
States), 50 μg/ml salmon sperm DNA and 50% formamide) for 2 hrs. The samples were
then added and hybridized in 0.5 μg/ml of DIG-labeled antisense riboprobe. The sense
probe was used as a negative control. The hybridization temperature was 55
o
C and the
incubation time was 16 hrs. Following hybridization, the samples were washed in 2X SSC at
42
o
C for 20 mins with two changes, 0.1% SDS (w/v) in 0.2X SSC buffer for 15 min and then
0.2X SSC buffer for 10 mins. The alkaline phosphatase-conjugated digoxigenin antibody
(1:50, Roche Applied Science, United States) was added to the specimens for 2 hrs and then
washed in DPBS for 10 min with four changes. Nitroblue tetrazolium salt and 5-bromo-4-
chloro-3-indolylphosphate (NBT/BCIP, Roche Applied Science, United States) were used as
the color substrates. After color development, the sections were mounted in 50% glycerol
(v/v, USB, United States). The experiment was performed in triplicates.
5.1.8 BrdU (Bromodeoxyuridine) labeling assay
Chang liver cells were cultured in 8-well glass slide (Nalge Nunc international, Naperville)
with Minimum Essential Medium Eagle plus 10% FBS. After 80% confluent, the cultures
were transfected with Ctl-siRNA or BRE-siRNA respectively according to maufacturers’
instructions. Forty-eight hours after transfection, BrdU was added into the cultures to a
final concentration of 20 M and incubated at 37
o
C for 4 hrs. The treated cultures were then
fixed with 2% paraformaldehyde for 24 hr. The fixed cultures were processed for
immunohistochemistry by using mouse BrdU antibodies (1:1000, Sigma-Aldrich, United
States). The BrdU positive and negative cells were counted and analysed by Spot Digital
Camera & Carl Zeiss Microscope Axiophot 2 Integrated Biological Imaging System.
5.1.9 First dimensional separation of samples – Isoelectric focusing
The cell lysate for the first DE was performed on an IPGphor IEF system using 11-cm long
IPG electrode strip with 4-7 pH gradient (Amersham Biosciences, United Kingdom) and an
Ettan IPGphor Strip Holder (Amersham Biosciences, United Kingdom). 150 μg of protein
was applied for each IPG strip. The total volume of protein sample and rehydration buffer
(8M Urea, 2% CHAPS (w/v), 1% IPG buffer (v/v, Amersham Biosciences, United
Kingdom), 40 mM DTT loaded onto the strip holder was 210 μl. 1ml of IPG Cover Fluid
(Amersham Biosciences, United Kingdom) was applied to each strip so as to minimize
evaporation and urea crystallization. The rehydration step was done under voltage and
followed by a separation process. The electrophoresis condition for step 1 was 30 V for 13
hrs; step 2 was 500 V for 1 hr; step 3 was 2000 V for 1 hr and step 4 was 5000 V for 20 hrs.
The program was stopped when the total volt-hours reached 40000.
5.1.10 Second dimensional separation – Sodium dodecyl sulphate polyacrylamide-gel
After first DE was completed, the IPG strips were removed from the strip holders. Each strip
was then treated with 1% DTT in 6.5 ml of equilibration buffer (50 mM Tris, 6M of urea, 30%
glycerol, 2% SDS, 0.1% bromophenol blue) for 30 min. The strips were further treated with
1% iodoacetamide (IAA, w/v, Sigma-Aldrich, United States) dissolved in the 6.5 ml of the
same equilibration buffer. The strips were treated in the solution for 30 min. The
equilibrated strips were then loaded on the 12% SDS-acrylamide separating gels. The 2-DE
was performed in an ISO-DALT apparatus (Hoefer Scientific Instruments). Prestained
protein molecular weight marker (Fermentas Life Science, Canada) with the range of 20 to
120 kDa was used to determine the sizes of the proteins on the gel.
Proteomics – Human Diseases and Protein Functions
118
5.1.11 Gel to gel matching
The gels were stained and scanned by using a GS 800 Densitometer (Bio-Rad Laboratories,
United States) and images were captured for further analysis. The protein spots on the gel
were analyzed by the discovery series, PDQuest 2D Analysis Software (Bio-Rad
Laboratories, United States) version 7.13 PC. The experiment was performed in triplicate.
5.1.12 Protein identification by mass fingerprinting
All protein spots of interest were isolated from the gel and processed for destaining. The gel
pieces were first washed in MilliQ water, immersed in 200 μl of destaining solution (15 mM
potassium ferricyanide and 50 mM sodium thiosulphate) and then incubated at room
temperature until they turned into colorless. Each gel piece was then washed with 400 μl of
MilliQ water for 15 min, three times. The destained gel pieces were equilibrated in 200 μl of
10 mM ammonium bicarbonate/50% acetonitrile each for about 15 min. The solution was
discarded and the equilibrated gel pieces were dehydrated by incubating in 200 l of
acetonitrile for 15 min. The solution was then poured off and the spots were dried in an
incubator at 30ºC for 5 min. Fifteen μg/ml trypsin working solution in 40 mM ammonium
bicarbonate/50% acetonitrile (v/v) was used for in-gel digestion. Twelve μl of the working
solution was added to each gel sample. The samples were then incubated at 35ºC for 16 hrs.
After trypsinization, 3 μl of extraction solution (50% acetonitrile (v/v) and 5% trifluoroacetic
acid (Fluka Chemika, Switzerland) were added to each gel piece to stop the reaction.
They are then centrifuged at 3,000 rpm for 2 min at room temperature. Three μl of
reaction mixture from each sample was mixed with α-cyano-4-hydroxycinnamic acid
matrix and then spotted onto a sample plate (Applied Biosystems, United States) for
the MALDI-TOF mass spectroscopy. The mass spectrums generated were analyzed using
the software Data Explorer Version 4.0.0.0 (Applied Biosystems, United States) and by
mass fingerprinting search using the search engine provided by Protein prospector
( To determine the significance of
variance in the experiments, data were analyzed using the two-tailed, paired student’s t-test.
P<0.05 was considered to be statistically significant. All statistical analysis was performed
using the SPSS software.
5.2 Results and discussions of the comparative proteomic analysis of BRE
5.2.1 Comparative proteomic analysis reveals BRE regulates prohibitin and p53
expression
BRE gene encodes a highly conserved stress-modulating protein. To gain further insight into
the function of this gene, we used comparative proteomics to investigate the protein profiles
of C2C12 and D122 cells resulting from small interfering RNA (siRNA)-mediated silencing
as well as overexpression of BRE. It was found that silencing BRE expression in C2C12 cells
would up-regulate Akt-3 and carbonic anhydrase III expression. In contrast, 26S proteasome
regulatory subunit S14 and prohibitin expressions were down-regulated as shown in
Figures 2 (2-DE gel) and 3 (semiquantitative RT-PCR and Western blot analyses). It has been
reported that prohibitin is normally expressed in different cellular compartments involved
in regulating cell proliferation, mitochondrial activities and protein processing (Mishra,
2010). Prohibitin can apparently directly interact with p53 in response to stress (Fusaro et al.,
2003; Joshi et al., 2007). We established that cell proliferation was significantly increased
after silencing BRE expression and this was accompanied by a reduction in p53 and
Comparative Proteomics:
An Approach to Elucidating the Function of a Novel Gene Called BRE
119
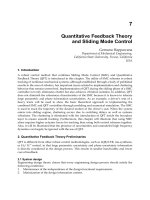
Fig. 2. Representative 2-DE gel of protein extracts from C2C12 cells that had been
transfected with CTL- or BRE-siRNAs. Four differentially expressed proteins were identified
(Swiss-Prot accession number provided). Silencing BRE expression up-regulated protein
spots Q9WUA6 and P16015, but P6778 and Q9Z2X2 were down-regulated. pI 4–7 (x-axis)
and MW in kDa (y-axis) (Tang et al., 2006).
Fig. 3. Semiquantitative RT-PCR (A) and Western blots (B) analyses confirming the
comparative proteomic results that silencing BRE, down-regulated prohibitin and 26S
proteasome regulatory subunit S14 expression, while Akt-3 expression was up-regulated. β-
actin and α-tubulin serve as internal controls (Tang et al., 2006).
Proteomics – Human Diseases and Protein Functions
120
prohibitin expression. We also identified Akt-3 that was affected by BRE silencing which
suggests BRE might be involved in the P13/AKT signaling pathway (Madhunapantula et al.,
2009). We observed that cell proliferation was suppressed when BRE was overexpressed in
the D122a4 cell line as shown in Figure 4. This was accompanied by an increase in p53 and
prohibitin expression as shown in Figure 5. It has been reported that in the nucleus BRE is
Fig. 4. MTT assay of D122, D122v3B and D122αa4 cell lines. The chart shows BRE
overexpression in D122αa4 inhibited cell proliferation. Values = means +SEM, P, ≤0.01, *
D122αa4 significantly different from D122 and D122v3B (Tang et al., 2006).
Fig. 5. Semiquantitative RT-PCR (A) and Western blot (B) showing that D122a4 cells
overexpressed prohibitin, p53 and mdm4. β-actin and α-tubulin serve as internal controls
(Tang et al., 2006) .
Comparative Proteomics:
An Approach to Elucidating the Function of a Novel Gene Called BRE
121
one of the components of BRCA1 A complex that is essential for tumor suppression (Harris
and Khanna, 2011). BRE peptide has an ubiquitin E2 variant domain which has been
determined to bind ubiquitin in co-immunoprecipitation experiments (Hu et al., 2011; Li et
al., 2004). Coincidently, a 26S proteasome regulatory subunit S14 was one of the proteins
found to be down-regulated by BRE over-expression. It is now known that the ubiquitin-
proteasome pathway plays an important role in regulating the proteolytic processes that
occur during signal transduction, transcriptional regulation and cell-cycle progression
(Clague and Urbé, 2010). In this context, we speculate that BRE participates in the ubiquitin-
proteasome pathway to regulate protein turnover within cells. In the 2-DE profiling of
D122α4 cells, where BRE was stably overexpressed, we identified five proteins that were up-
regulated. They were granulin precursor, TNF receptor associated factor 6 (TRAF6), mitogen
protein kinase 8, Mdm4 and baculoviral IAP repeat-containing protein 4 as shown in
Figures 6 (2 DE gel) and 7 (semiquantitative RT-PCR and Western blot analyses).
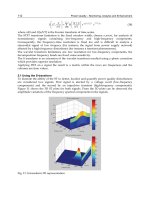
Fig. 6. Representative 2-DE gel of protein extracts from D122v3B and D122αa4 cell lines. Five
protein spots (O35618, P28798, Q07174, P70196 and Q60989) were up-regulated in D122αa4
cells (Swiss-Prot accession number provided) (Tang et al., 2006).
Proteomics – Human Diseases and Protein Functions
122
Fig. 7. Semiquantitative RT-PCR (A) and Western blot (B) showing that D122αa4 cells
overexpressed prohibitin, p53 and mdm4. β-actin and α-tubulin serve as internal controls
(Tang et al., 2006).
Interestingly, TRAF6 is a unique member of the TRAF family of adaptor protein. It is
associated with a diverse range of cellular responses to pathogens, growth factors or
intracellular stress (Chung et al., 2007). Recent finding also showed that TRAF6 was
involved in the RANK-TRAF6-NF-B pathways during osteoclastogenesis (Inoue et al.,
2007). Overexpression of BRE in human 293 embryonic kidney cells has been reported to
inhibit NF-B activation in response to TNFα (Gu et al., 1998). This finding suggests that
BRE indirectly cross-talk with TRAF6 and NF-β, where it may play a central role in
regulating cell proliferation, differentiation and survival. BRE may also mediate in post-
translational sumoylation, similar to the action of PML and MO25α proteins (Kretz-Remy
and Tanguay, 1999). Our results established a crucial function for BRE in regulating key
proteins of cellular stress-response and provided an explanation for the multifunctional
nature of BRE.
5.2.2 Comparative proteomic analysis reveals differentially expressed proteins
regulated by a potential tumor promoter, BRE, in human esophageal carcinoma cells
Esophageal cancer is one of the most common malignancies that cause high mortality.
Esophageal carcinogenesis is a complex and cascading process that involve the interaction
of many genes and proteins (Kuwano et al., 2005). In this study, we have used
comparative proteomic approaches to identify proteins that maybe involved in
esophageal carcinogenesis. Two dimensional electrophoresis (2-DE) and MALDI-TOF-MS
analyses of esophageal carcinoma, SHEEC and control cells SHEE revealed 10 proteins
that were up-regulated as shown in Figure 8 of the 2-DE. Additional 10 proteins were
down-regulated as shown in Figure 9. Interestingly, BRE, prohibitin, cyclin A and p53
Comparative Proteomics:
An Approach to Elucidating the Function of a Novel Gene Called BRE
123
Fig. 8. Representative 2-DE gel of nucleic proteins extracted from SHEE and SHEEC cells. Ten
silver-stained protein spots were found to be up-regulated in SHEEC cells (Chen et al., 2008).
Fig. 9. Representative 2-DE gel of nucleic proteins extracted from SHEE and SHEEC cells. Ten
silver-stained protein spots were found to be down-regulated in SHEEC cells (Chen et al., 2008).
Proteomics – Human Diseases and Protein Functions
124
Fig. 10. Semiquantitative RT-PCR (A) and Western Blot (B) analyses of SHEE and SHEEC
cells. The results confirmed the proteomic data that BRE, prohibitin and cyclin A were
highly expressed in SHEEC cells. The SHEEC cells also expressed relatively higher levels of
TNF-R1 but lower levels of p53, when compared with SHEE cells. β-actin and α-tubulin
serve as internal controls (Chen et al., 2008).
expression were up-regulated in the cancer cells and this was confirmed by both
semiquantitative RT-PCR and western blot analyses (Figure 10). Among these 20
differentially expressed proteins, BRE protein was identified as a potential tumor promoter.
Furthermore, we have also determined p53 expression was down-regulated; whereas TNF-
R1 expression was up-regulated in SHEEC cells (Figure 10). It has been reported that BRE
can interact with the intracellular juxtamembrane domain TNF-R1 and inhibit the TNF-α
induced activation of NF-B (Gu et al., 1998). Therefore, we propose that BRE plays an anti-
apoptotic role in SHEEC cells. To gain more insight into BRE’s function, we silenced BRE
expression in esophageal carcinoma cells using BRE-specific small interference RNA. It was
found that silencing BRE expression corresponds to down-regulated prohibitin expression
but up-regulated tumor-suppressor gene, p53 as shown in Figure 11. These findings
contradicted the results with previous data (Tang, et al., 2006) that may due to
multifunctional nature of BRE. Besides BRE, cyclin A and CDK2 expressions were
suppressed in the SHEEC cells. Cyclin A is an important regulator of the cell cycle that rises
in early S phase and falls in mid M phase (Parwaresch and Rudolph, 1996). Recent finding
showed the cyclin A might be a prognostic marker in early breast cancer (Ahlin, et al. 2007).
In summary, these results imply that BRE may be a survival factor and plays a proliferative
role in esophageal carcinoma.
Comparative Proteomics:
An Approach to Elucidating the Function of a Novel Gene Called BRE
125
Fig. 11. Semiquantitative RT-PCR analysis of SHEE and SHEEC cells transfected with CTL-
and BRE-siRNAs. The results showed that our BRE construct can silence BRE expression, as
well as suppressed prohibitin and cyclin A expressions. β-actin served as an internal control
(Chen et al., 2008).
5.2.3 Livers over-expressing BRE transgene are under heightened state of stress-
response, as revealed by comparative proteomics
BRE is normally expressed at very low levels in the liver (Chan, et al., 2008). It binds to TNF-
R1 and Fas, and modulates the actions of these cytokines (Li, et al., 2004; Chan et al., 2010).
In this study, we demonstrated that BRE expression was rapidly induced when the liver was
insulted with carbon tetrachloride (CCl
4
) or in human hepatocellular carcinoma (HCC) as
shown in Figure 12. We produced transgenic mice that specifically over-expressed BRE in
the liver to determine the effect of high levels of BRE in the liver. The livers of these
transgenic mice were determined to be histologically normal. Because of the lack of a
phenotype, we conducted comparative proteomics to determine whether there were any
differences at the protein level (Figure 13). The 2-DE revealed four up-regulated protein
spots and nine down-regulated protein spots as summarized in Table 2. It was established
that several stress responsive proteins were up-regulated in the BRE-transgenic liver
including: Alpha enolase (ENO 1), Heat shock-related 70 kDa protein 2 (HSPA2), Putative
heat shock 70 kDa protein 7 (HSPA7), Zinc-finger protein Ubid 4 (DPF2) and Tumor
suppressor candidate 4 G21 protein (TUSC4) as shown in Figure 14. Recently, it has been
reported that HSPA7 is a biomarker for early detection of HCC (Park, 2011). In addition, we
have silenced BRE expression in Chang liver cells and inversely demonstrated that it did not
affect cell proliferation rate as confirmed by BrdU Labelling assay (Table 3). We have
previously reported that BRE is not only expressed in the cytoplasm but also in the nuclei of
HCC cells. BRE also accumulates in the nuclei of esophagus cancer SHEEC cells (Chen, et
al., 2008). Since BRE is one of the components of BRCA1 A complex, it could be involved in
DNA repair, as well as responding to environmental stress. We propose that the livers in
our BRE transgenic mice were under a heighten state of stress response and this may explain
why the transgenic mice was more resistant to liver toxic drugs.
Proteomics – Human Diseases and Protein Functions
126
Fig. 12. In situ hybridization (A–D and G–I). BRE is normally expressed at very low levels in
normal mouse liver (A). CCl4 insult induced increased BRE expression in the affected
hepatocytes at 6 h (B) and 12h (C). Twenty-four hours after CCl4 insult, BRE expression
declined. This was probably the result of the affected hepatocytes starting to die off (D).
Immunohistological staining revealed that BRE expression was strongly induced in the
affected hepatocytes by CCl4 (E, F). BRE expression remained low in the unaffected cells.
We also examined BRE expression in HCC cells. BRE was expressed at low levels in non-
tumor human liver tissues (H). In HCC tissues, all the cells strongly expressed BRE (I). Sense
control (G). Arrows, hepatocytes overexpressing BRE. C, liver central veins (Tang et al.,
2009).
Comparative Proteomics:
An Approach to Elucidating the Function of a Novel Gene Called BRE
127
Fig. 13. A representative 2-DE gel of BRE transgenic liver. Protein spots 1–15 were identified
to be differentially expressed when compared with control gels. Protein spots 1–4 were
downregulated in the transgenic (trans) liver, while protein spots 5–15 were upregulated in
the wild type (wt) liver. These results were acquired from three independent liver samples
and 2-DE was correspondingly performed three times (Tang et al., 2009).
Proteomics – Human Diseases and Protein Functions
128
Fig. 14. Semi-quantitative RT-PCR revealed that the proteins identified were differentially
expressed in BRE transgenic livers were also correspondingly affected at the transcriptional
level. *p<0.05, **p<0.01, denote significant difference in the staining intensity of wt and BRE
transgenic PCR bands (Tang et al., 2009).
Table 2. Proteins that are differentially expressed in BRE transgenic liver (Tang et al., 2009).
Comparative Proteomics:
An Approach to Elucidating the Function of a Novel Gene Called BRE
129
Table 3. Effects of silencing BRE expression on Chang liver cell proliferation (Tang et al.,
2009).
6. Future perspective of proteomics
Conventional “gel-based” electrophoresis and improved mass spectrometry have
provided useful tools for revealing molecular changes in cells and tissues that otherwise
maybe missed by morphological observation alone (Vercauteren et al., 2007).
Nevertheless, the 2-DE protocol is still to be refined and improved so that 2-DE is more
reproducible and sensitive. Therefore, it has still some distance to go before it can be
adopted as a standard “diagnostic tool” in the 21
st
century (Colucci-D'Amato et al., 2011).
The “shotgun” methodology has been used as a high-throughput screen to identify
proteins that are differentially expressed in cells or tissues, as a result of some
experimental procedure or changes in environmental condition (Lill, 2003; Zhu et al.,
2010). Liu et al. (2011) recently described the SELDI-TOF-MS technology that could be
used to screen and detect differentially expressed proteins in the serum of patients with
cancer. Liquid chromatography interfaced plasma mass spectrometry has now been
developed for absolute quantitation of proteins (Esteban-Fernández et al., 2011).
Furthermore, latest development of computational tools for analyzing high-throughput
‘shotgun’ proteomic data also play a vital role in moving proteomic research forward
(Dowsey et al., 2010). All of these improvements will allow proteomics to be rapidly
developed as a practical, robust, accurate and inexpensive analytical tool for routine use
in the clinical setting. The proteomics will also allow many novel disease biomarkers to be
discovered and also lead to the discovery of new drugs.
7. References
[1] Ahlin C, Aaltonen K, Amini RM, Nevanlinna H, Fjällskog ML, Blomqvist C. (2007) Ki67
and cyclin A as prognostic factors in early breast cancer. What are the optimal cut-
off values? Histopathology. 51(4):491-8.
[2] Altland K, Becher P, Rossmann U, Bjellqvist B. (1988) Isoelectric focusing of basic
proteins: the problem of oxidation of cysteines. Electrophoresis. (9):474-85.
[3] Andersen JS, Svensson B, Roepstorff P. (1996) Electrospray ionization and matrix
assisted laser desorption/ionization mass spectrometry: powerful analytical tools
in recombinant protein chemistry. Nat Biotechnol. 14(4):449-57.
[4] Arnstein, HR (1965). Mechanism of protein biosynthesis. Br Med Bull. 21(3):217-22.
[5] Arrell DK, Neverova I, Van Eyk JE. (2001) Cardiovascular proteomics: evolution and
potential. Circ Res. 88(8):763-73.
Proteomics – Human Diseases and Protein Functions
130
[6] Bergquist J, Palmblad M, Wetterhall M, Håkansson P, Markides KE. (2002) Peptide
mapping of proteins in human body fluids using electrospray ionization Fourier
transform ion cyclotron resonance mass spectrometry. Mass Spectrom Rev. 21(1):2-
15.
[7] Birr C, Frank R. (1975) Control for uniformity of synthetic peptides: quantitative
evaluation of the Edman degradation of support-bound human insulin B 22-30
synthetized by the Merrifield method. FEBS Lett. 55(1):68-71.
[8] Bjellqvist B, Ek K, Righetti PG, Gianazza E, Görg A, Westermeier R, Postel W. (1982)
Isoelectric focusing in immobilized pH gradients: principle, methodology and
some applications. J Biochem Biophys Methods. 6(4):317-39.
[9] Blundell TL, Johnson MS. (1993) Catching a common fold. Protein Sci. 2(6):877-83.
[10] Ceglarek U, Kortz L, Leichtle A, Fiedler GM, Kratzsch J, Thiery J. (2009) Rapid
quantification of steroid patterns in human serum by on-line solid phase extraction
combined with liquid chromatography-triple quadrupole linear ion trap mass
spectrometry. Clin Chim Acta.401(1-2):114-8.
[11] Celis JE, Celis P, Ostergaard M, Basse B, Lauridsen JB, Ratz G, Rasmussen HH, Orntoft
TF, Hein B, Wolf H, Celis A.(1999) Proteomics and immunohistochemistry define
some of the steps involved in the squamous differentiation of the bladder
transitional epithelium: a novel strategy for identifying metaplastic lesions. Cancer
Res. 59(12):3003-9.
[12] Chalkley RJ, Baker PR, Huang L, Hansen KC, Allen NP, Rexach M, Burlingame
AL.(2005) Comprehensive analysis of a multidimensional liquid chromatography
mass spectrometry dataset acquired on a quadrupole selecting, quadrupole
collision cell, time-of-flight mass spectrometer: II. New developments in Protein
Prospector allow for reliable and comprehensive automatic analysis of large
datasets. Mol Cell Proteomics 4(8):1194-204.
[13] Chan BC, Ching AK, To KF, Leung JC, Chen S, Li Q, Lai PB, Tang NL, Shaw PC, Chan
JY, James AE, Lai KN, Lim PL, Lee KK, Chui YL. (2008) BRE is an antiapoptotic
protein in vivo and overexpressed in human hepatocellular carcinoma. Oncogene.
27(9):1208-17.
[14] Chan BC, Li Q, Chow SK, Ching AK, Liew CT, Lim PL, Lee KK, Chan JY, Chui
YL.(2005). BRE enhances in vivo growth of tumor cells. Biochem Biophys Res
Commun 326(2):268-73.
[15] Chan JY, Li L, Miao J, Cai DQ, Lee KK, Chui YL.(2010) Differential expression of a novel
gene BRE (TNFRSF1A modulator/BRCC45) in response to stress and biological
signals. Mol Biol Rep. 37(1):363-8.
[16] Chen HB, Pan K, Tang MK, Chui YL, Chen L, Su ZJ, Shen ZY, Li EM, Xie W, Lee KK.
(2008) Comparative proteomic analysis reveals differentially expressed proteins
regulated by a potential tumor promoter, BRE, in human esophageal carcinoma
cells. Biochem Cell Biol. 86(4):302-11.
[17] Chen R, Snyder M. (2010) Yeast proteomics and protein microarrays. J Proteomics.
73(11):2147-57.
[18] Ching, A.K., Li, P.S., Li, Q., Chan, B.S., Chan, J.Y., Lim, P.L., Pang, J.C., Chui, Y.L.
(2001). Expression of human BRE in multiple isoforms. Biochem. Biophys. Res.
Commun. 288, 535-545.
Comparative Proteomics:
An Approach to Elucidating the Function of a Novel Gene Called BRE
131
[19] Chowdhury SK, Katta V, Chait BT. (1990) An electrospray-ionization mass spectrometer
with new features. Rapid Commun Mass Spectrom. 4(3):81-7.
[20] Chung JY, Lu M, Yin Q, Lin SC, Wu H. (2007) Molecular basis for the unique specificity
of TRAF6. Adv Exp Med Biol. 597:122-30.
[21] Clague MJ, Urbé S. (2010) Ubiquitin: same molecule, different degradation pathways.
Cell. 143(5):682-5.
[22] Colucci-D'Amato L, Farina A, Vissers JP, Chambery A. (2011) Quantitative
neuroproteomics: classical and novel tools for studying neural differentiation and
function. Stem Cell Rev. 7(1):77-93.
[23] Conrotto P, Souchelnytskyi S. (2008) Proteomic approaches in biological and medical
sciences: principles and applications. Exp Oncol. 30(3):171-80.
[24] Dong Y, Hakimi MA, Chen X, Kumaraswamy E, Cooch NS, Godwin AK, Shiekhattar R.
(2003) Regulation of BRCC, a holoenzyme complex containing BRCA1 and BRCA2,
by a signalosome-like subunit and its role in DNA repair. Mol Cell. 12(5):1087-99.
[25] Dowsey AW, English JA, Lisacek F, Morris JS, Yang GZ, Dunn MJ. (2010) Image
analysis tools and emerging algorithms for expression proteomics. Proteomics.
10(23):4226-57.
[26] Edman, P. (1950) Method for Determination of the Amino Acid Sequence in Peptides.
Acta Chem Scand 10: 283-293.
[27] Edman, P. and Begg, G. (1967) A protein Sequenator. European J. Biochem. 1: 80-91.
[28] Esteban-Fernández D, Scheler C, Linscheid MW. (2011) Absolute protein quantification
by LC-ICP-MS using MeCAT peptide labeling. Anal Bioanal Chem. 401(2):657-66.
[29] Fenn JB, Mann M, Meng CK, Wong SF, Whitehouse CM. (1989) Electrospray ionization
for mass spectrometry of large biomolecules. Science. 246(4926):64-71.
[30] Fenn JB. (2002) Electrospray ionization mass spectrometry: How it all began. J Biomol
Tech. 13(3):101-18.
[31] Finnerty V, Johnson G. (1979) Post-Translational Modification as a Potential
Explanation of High Levels of Enzyme Polymorphism: Xanthine Dehydrogenase
and Aldehyde Oxidase in DROSOPHILA MELANOGASTER. Genetics. 91(4):695-
722.
[32] Fleischer, B. (1983) Mechanism of glycosylation in the Golgi apparatus. J Histochem
Cytochem. 31(8):1033-40.
[33] Fusaro G, Dasgupta P, Rastogi S, Joshi B, Chellappan S. (2003) Prohibitin induces the
transcriptional activity of p53 and is exported from the nucleus upon apoptotic
signaling. J Biol Chem. 278(48):47853-61.
[34] Galvão ER, Martins LM, Ibiapina JO, Andrade HM, Monte SJ. (2011) Breast cancer
proteomics: a review for clinicians. J Cancer Res Clin Oncol. 137(6):915-25.
[35] Gioia R, Leroy C, Drullion C, Lagarde V, Etienne G, Dulucq S, Lippert E, Roche S,
Mahon FX, Pasquet JM. (2011) Quantitative phosphoproteomics revealed interplay
between Syk and Lyn in the resistance to nilotinib in chronic myeloid leukemia
cells. Blood. 118(8):2211-21.
[36] Görg A, Drews
O, Lück C, Weiland F, Weiss W.(2009) 2-DE with IPGs. Electrophoresis.
30 Suppl 1:S122-32.
[37] Görg A, Weiss W, Dunn MJ. (2004) Current two-dimensional electrophoresis
technology for proteomics. Proteomics. 4(12):3665-85.
Proteomics – Human Diseases and Protein Functions
132
[38] Gu C, Castellino A, Chan JY, Chao MV. (1998) BRE: a modulator of TNF-alpha action.
FASEB J. 12(12):1101-8.
[39] Han MJ, Lee JW, Lee SY. (2011) Understanding and engineering of microbial cells based
on proteomics and its conjunction with other omics studies. Proteomics. 11(4):721-
43.
[40] Harris JL, Khanna KK. (2011) BRCA1 A‐complex fine tunes repair functions of BRCA1.
Aging (Albany NY). 3(5):461-3.
[41] Hillenkamp F, Karas M, Beavis RC, Chait BT. (1991) Matrix-assisted laser
desorption/ionization mass spectrometry of biopolymers. Anal Chem.
63(24):1193A-1203A.
[42] Hu X, Kim JA, Castillo A, Huang M, Liu J, Wang B. (2011) NBA1/MERIT40 and BRE
interaction is required for the integrity of two distinct deubiquitinating enzyme
BRCC36-containing complexes. J Biol Chem. 286(13):11734-45.
[43] Inoue J, Gohda J, Akiyama T, Semba K. (2007) NF-kappaB activation in development
and progression of cancer. Cancer Sci. 98(3):268-74.
[44] Joshi B, Rastogi S, Morris M, Carastro LM, DeCook C, Seto E, Chellappan SP. (2007)
Differential regulation of human YY1 and caspase 7 promoters by prohibitin
through E2F1 and p53 binding sites. Biochem J. 401(1):155-66.
[45] Kretz-Remy C, Tanguay RM. (1999) SUMO/sentrin: protein modifiers regulating
important cellular functions. Biochem Cell Biol. 77(4):299-309.
[46] Kuwano H, Kato H, Miyazaki T, Fukuchi M, Masuda N, Nakajima M, Fukai Y, Sohda
M, Kimura H, Faried A. (2005) Genetic alterations in esophageal cancer. Surg
Today. 35(1):7-18.
[47] Larbi, NB and Jefferies, C. (2009) 2D-DIGE: Comparative Proteomics of Cellular
Signalling Pathways. Methods Mol Biol. 517:105-32.
[48] Lau TY, O'Connor DP, Brennan DJ, Duffy MJ, Pennington SR, Gallagher WM.(2007)
Breast cancer proteomics: clinical perspectives. Expert Opin Biol Ther. 7(2):209-19.
[49] Lee KK, Leung AK, Tang MK, Cai DQ, Schneider C, Brancolini C, Chow PH (2001).
Functions of the growth arrest specific 1 gene in the development of the mouse
embryo. Dev Biol 234(1):188-203.
[50] Lengyel P. (1966) Problems in protein biosynthesis. J Gen Physiol. 49(6):305-30.
[51] Li Q, Ching AK, Chan BC, Chow SK, Lim PL, Ho TC, Ip WK, Wong CK, Lam CW, Lee
KK, Chan JY, Chui YL. (2004) A death receptor-associated anti-apoptotic protein,
BRE, inhibits mitochondrial apoptotic pathway. J Biol Chem. 279(50):52106-16.
[52] Li, L., Yoo, H., Becker, F.F., Ali-Osman, F. and Chan, J.Y. (1995). Identification of a
brain- and reproductive-organs-specific gene responsive to DNA damage and
retinoic acid. Biochem. Biophys. Res. Commun. 206, 764-774.
[53] Lill, J (2003) Proteomic Tools for Quantitation by Mass Spectrometry. Mass Spect Rev.
22: 182-194.
[54] Liu C, Pan C, Wang H, Yong L. (2011) Effect of surface-enhanced laser
desorption/ionization time-of-flight mass spectrometry on identifying biomarkers
of laryngeal carcinoma. Tumour Biol. 2011 Aug 9.
[55]
Lucas F, Barbe
r M, Wolstenholme WA, Geddes AJ, Graham GN, Morris HR. (1969)
Mass-spectrometric determination of the amino acid sequences in peptides isolated
from the protein silk fibroin of Bombyx mori. Biochem J. 114(4):695-702.
Comparative Proteomics:
An Approach to Elucidating the Function of a Novel Gene Called BRE
133
[56] Madhunapantula SV, Robertson GP. (2009) The PTEN-AKT3 signaling cascade as a
therapeutic target in melanoma. Pigment Cell Melanoma Res. 22(4):400-19.
[57] Mao LM, Guo ML, Jin DZ, Fibuch EE, Choe ES, Wang JQ. (2011) Post-translational
modification biology of glutamate receptors and drug addiction. Front Neuroanat.
5:19.
[58] Marko-Varga G, Berglund M, Malmström J, Lindberg H, Fehniger TE. (2003) Targeting
hepatocytes from liver tissue by laser capture microdissection and proteomics
expression profiling. Electrophoresis. 24(21):3800-5.
[59] McKerrow JH, Bhargava V, Hansell E, Huling S, Kuwahara T, Matley M, Coussens L,
Warren R. (2000) A functional proteomics screen of proteases in colorectal
carcinoma. Mol Med. 6(5):450-60.
[60] Miao J, Chan KW, Chen GG, Chun SY, Xia NS, Chan JY, Panesar NS. (2005) Blocking
BRE expression in Leydig cells inhibits steroidogenesis by down-regulating 3beta-
hydroxysteroid dehydrogenase. J Endocrinol. 185(3):507-17.
[61] Miao, J., Panesar, N.S., Chan, K.T., Lai, F.M., Xia, N., Wang, Y., Johnson, P.J. and Chan,
J.Y. (2001). Differential expression of a stress-modulating gene, BRE, in the adrenal
gland, in adrenal neoplasia, and in abnormal adrenal tissues. J. Histochem.
Cytochem. 49, 491-500.
[62] Mishra S, Ande SR, Nyomba BL. (2010) The role of prohibitin in cell signaling. FEBS J.
277(19):3937-46.
[63] Morris, HR, Williams, DH, Ambler RP. (1971) Determination of the Sequences of
Protein-Derived Peptides and Peptide Mixtures by Mass Spectrometry. Biochem. J.
125: 189-201.
[64] Niall HD, Keutmann HT, Copp DH, Potts JT Jr. (1969) Amino acid sequence of salmon
ultimobranchial calcitonin. Proc Natl Acad Sci U S A. 64(2):771-8.
[65] Novak A, Amit M, Ziv T, Segev H, Fishman B, Admon A, Itskovitz-Eldor J. (2011).
Proteomics Profiling of Human Embryonic Stem Cells in the Early Differentiation
Stage. Stem Cell Rev. 2011 Jul 6.
[66] O'Farrell PH.(1975) High resolution two-dimensional electrophoresis of proteins. J Biol
Chem. 250(10):4007-21.
[67] Ornstein DK, Rayford W, Fusaro VA, Conrads TP, Ross SJ, Hitt BA, Wiggins WW,
Veenstra TD, Liotta LA, Petricoin EF 3rd. (2004) Serum proteomic profiling can
discriminate prostate cancer from benign prostates in men with total prostate
specific antigen levels between 2.5 and 15.0 ng/ml. J Urol. 172(4 Pt 1):1302-5.
[68] Ornstein DK, Tyson DR. (2006) Proteomics for the identification of new prostate cancer
biomarkers. Urol Oncol. 24(3):231-6.
[69] Park YN. (2011) Update on precursor and early lesions of hepatocellular carcinomas.
Arch Pathol Lab Med. 135(6):704-15.
[70] Parwaresch R, Rudolph P. (1996) The Cell Cycle – Theory and Application to Cancer.
Onkologie 19:464-472.
[71] Perkins DN, Pappin DJ, Creasy DM, Cottrell JS. (1999) Probability-based protein
identification by searching sequence databases using mass spectrometry data.
Electrophoresis. 20(18):3551-67.
[72] Sauter ER, Zhu W, Fa
n XJ, Wassell RP, Chervoneva I, Du Bois GC. (2002) Proteomic
analysis of nipple aspirate fluid to detect biologic markers of breast cancer. Br J
Cancer. 86(9):1440-3.
Proteomics – Human Diseases and Protein Functions
134
[73] Schwartz JC, Jardine I. (1996) Quadrupole ion trap mass spectrometry. Methods
Enzymol. 270:552-86.
[74] Shen Z, Cen S, Shen J, et al. 2000. Study of immortalization and malignant
transformation of human embryonic esophageal epithelial cells induced by HPV18
E6E7. J Cancer Res Clin Oncol, 126(10):589-94.
[75] Sirot LK, Hardstone MC, Helinski ME, Ribeiro JM, Kimura M, Deewatthanawong P,
Wolfner MF, Harrington LC. (2011) Towards a semen proteome of the dengue
vector mosquito: protein identification and potential functions. PLoS Negl Trop
Dis. 5(3):e989.
[76] Tang, M.K., Wang, C.M., Shan, S.W., Chui, Y.L., Ching, A.K., Chow, P.H., Grotewold,
L., Chan, J.Y. and Lee, K.K. (2006). Comparative proteomic analysis reveals a
function of the novel death receptor-associated protein BRE in the regulation of
prohibitin and p53 expression and proliferation. Proteomics 6, 2376-2385.
[77] Tang, MK, Liu, G, Hou, Z., Chui, YL, Chan, JYH, Lee, KKH (2009) Livers
overexpressing BRE transgene are under heightened state of stress-response, as
revealed by comparative proteomics. Proteomics Clin. Appl. 3(12):1362-70.
[78] Tung CS, Wong KK, Mok SC. (2008) Biomarker discovery in ovarian cancer. Womens
Health (Lond Engl). 4:27-40.
[79] Vercauteren FG, Arckens L, Quirion R. (2007) Applications and current challenges of
proteomic approaches, focusing on two-dimensional electrophoresis. Amino Acids.
33(3):405-14.
[80] Voss T, Ahorn H, Haberl P, Döhner H, Wilgenbus K. (2001) Correlation of clinical data
with proteomics profiles in 24 patients with B-cell chronic lymphocytic leukemia.
Int J Cancer. 91(2):180-6.
[81] Weiss W, Görg A. (2009) High-resolution two-dimensional electrophoresis. Methods
Mol Biol. 564:13-32.
[82] Wilkins MR, Sanchez JC, Gooley AA, Appel RD, Humphery-Smith I, Hochstrasser DF,
Williams KL.(1996) Progress with proteome projects: why all proteins expressed by
a genome should be identified and how to do it. Biotechnol Genet Eng Rev. 13:19-
50.
[83] Zhang Z, Bast RC Jr, Yu Y, Li J, Sokoll LJ, Rai AJ, Rosenzweig JM, Cameron B, Wang
YY, Meng XY, Berchuck A, Van Haaften-Day C, Hacker NF, de Bruijn HW, van der
Zee AG, Jacobs IJ, Fung ET, Chan DW. (2004) Three biomarkers identified from
serum proteomic analysis for the detection of early stage ovarian cancer. Cancer
Res. 64(16):5882-90.
[84] Zhu, W, Smith, JW and Hung, CM (2010). Mass Spectrometry-Based Label-Free
Quantitative Proteomics. J. Biomed and Biotech 2010: 840518.
7
Proteomic Approaches to Unraveling
the RB/E2F Regulatory Pathway
Jone Mitxelena
1
, Nerea Osinalde
2
, Jesus M. Arizmendi
2
,
Asier Fullaondo
1
and Ana M. Zubiaga
1
1
Dept. Genetics, Physical Anthropology and Animal Physiology
University of the Basque Country, UPV/EHU, Bilbao
2
Dept. Biochemistry and Molecular Biology,
University of the Basque Country, UPV/EHU, Bilbao
Spain
1. Introduction
Correct entry into and progression through the cell cycle require an intact RB/E2F pathway,
and its deregulation is now considered a general hallmark of cancer (Nevins 2001). Pioneer
work in the early 90’s showed that E2F activity is controlled through the temporal
association of E2F factors with Retinoblastoma (RB) tumor suppressor proteins (pRB, p107
and p130), also called pocket proteins (Bandara & La Thangue 1991; Chellappan et al. 1991).
The additional finding that RB activity is regulated through phosphorylations by cyclin
dependent kinases (CDKs) provided the groundwork for the current model of cell cycle
control (Weinberg 1995). According to this model, non-phosphorylated RB binds to E2F in
G0/G1, leading to the repression of E2F target genes. Subsequent phosphorylation of RB by
CDKs in mid-to late G1 disrupts its association with E2F. As a result, free E2F triggers the
expression of target genes necessary for entry into and progression through the cell cycle
(Burkhart & Sage 2008). This pathway is thought to be disrupted in most human cancers,
either by activation of positively acting components such as G1 cyclins and CDKs, or the
inactivation of negatively acting components such as RB and cyclin kinase inhibitors
(Nevins 2001). The predicted consequence of deficient RB-mediated regulation is that E2F
activity is constantly unleashed from the inhibitory effects of RB (DeGregori & Johnson
2006; Dimova & Dyson 2005; Iaquinta & Lees 2007).
Mammalian E2F is a family of related factors (E2F1-8), originally discovered for their pivotal
role in transcriptional regulation of genes associated with DNA replication and G1/S
progression (Attwooll et al. 2004; Trimarchi & Lees 2002). More recently, microarray
expression profiling analyses and ChIP-chip analyses (chromatin immunoprecipitation
coupled to microarray technology) in cells overexpressing individual E2Fs have revealed
that the transactivation function of these factors exceeds beyond G1/S transition regulation.
In fact, E2Fs regulate a wide spectrum of genes with diverse biological functions, including
regulation of apoptosis, autophagy, mitosis, chromosome organization, macromolecule
metabolism, or differentiation (Ma et al. 2002; Muller et al. 2001; Polager et al. 2008; Ren et
al. 2002; Weinmann et al. 2002; Young et al. 2003). Thus, the role of E2F transcription factors
in cellular physiology is probably more complex than it was originally thought to be.
Proteomics – Human Diseases and Protein Functions
136
Traditionally, the mammalian E2F family has been divided into “activators” (E2F1-3) and
“repressors” (E2F4-8). However, recent in vivo data have questioned this oversimplified
classification. Indeed, accumulating evidence suggests that most E2Fs can function both as
activators as well as repressors, depending on the cellular context (Balciunaite et al. 2005;
Iglesias et al. 2004; Infante et al. 2008; Lang et al. 2001; Lee et al. 2011; Ma et al. 2002; Morris
et al. 2000; Muller et al. 2001; Polager et al. 2008; Young et al. 2003). Likewise, both
oncogenic and tumor suppressor properties have been assigned to these factors (DeGregori
& Johnson 2006; Johnson & DeGregori 2006). The mechanisms underlying this bimodal
impact of individual E2Fs, and their implication in human cancer development remain to be
elucidated. This is a particularly relevant point that needs to be addressed, since strategies
based on E2F biology are being devised for the development of anticancer therapies (Kaelin,
Jr. 2003). An additional level of complexity in the understanding of E2F function in vivo
derives from the considerable functional overlap existing among several E2F members
(Chen et al. 2009a; DeGregori & Johnson 2006). Nonetheless, the characterization of mouse
models lacking individual E2Fs has revealed that these factors play unique roles in
development, tissue homeostasis and tumor formation (Chen et al. 2009a; DeGregori &
Johnson 2006; Trimarchi & Lees 2002).
Functional specificity of individual E2F factors is thought to be established through the
regulation of distinct sets of target genes. In fact, there is growing evidence that this
specificity is achieved by interaction of E2Fs with other proteins or by post-translational
modifications (PTMs) on E2Fs or E2F-containing complexes. Much of this evidence has been
gathered through proteomic approaches such as yeast two-hybrid screening, two-
dimensional electrophoresis (2-DE) followed by mass spectrometry (MS) or shotgun
proteomics (Figure 1). In this review, the application of proteomics in the study of RB/E2F
regulatory pathway is summarized. Results derived from these experiments are expanding
our current understanding of the RB/E2F biology in several important ways. They are
piecing together the interactions within macromolecular complexes that regulate
transcription of E2F target genes. Furthermore, they are helping define the mechanisms
underlying RB/E2F–dependent control of cellular physiology and pathology.
2. Identification of proteins that interact with E2Fs
It has long been recognized that E2F activity is regulated through the association of E2F
factors with specific protein partners. In fact, E2F1, the founder member of the family, was
first identified as a sequence-specific DNA-binding activity that co-precipitated with RB
(Chittenden et al. 1991). Recent development of non-hypothesis driven proteomic
approaches has allowed a more extensive analysis of protein-protein interactions in the E2F
field. Several methods have been successfully applied in the identification of RB/E2F
interacting partners, in particular, yeast two-hybrid screenings and affinity purification
coupled to MS.
2.1 Genome-wide yeast two-hybrid interaction screening
The yeast two-hybrid method is one of the most widely used methods for mapping protein-
protein interactions. In this method, the “bait” protein is typically expressed in yeast as a
chimeric protein fused to the DNA-binding domain of a known transcription factor (usually
Gal4). All other “target” proteins that the bait protein is going to be screened against are
expressed within the cell fused to the activation domain of this same transcription factor.
Proteomic Approaches to Unraveling the RB/E2F Regulatory Pathway
137
Fig. 1. A schematic diagram showing proteomic approaches to analyzing regulatory
signaling pathways.
The interaction between the bait and target proteins brings into close proximity the DNA
binding and activation domains of the transcription factor, resulting in the activation of a
reporter gene (Fields & Song 1989). Given that the conditions applied in this methodology
are not physiological, some of the detected interactions may not represent true interactions.
Consequently, this experimental system is thought to yield a high false positive rate.
Consequently, interactions detected by this system need to be further validated in an
appropriate physiological system. Despite the mentioned drawbacks, it is also true that the
yeast two-hybrid interaction screening provides a method to scrutinize protein-protein
interactions within living cells, whereas other approaches measure protein interactions after
the complexes have been removed from the cellular environment.
Interaction proteomics has been helpful in exploring the intricate macromolecular
interactions established by RB and E2F for the regulation of gene expression. Work from
many laboratories has shown that RB mediates transcriptional repression through the
recruitment of a large number of co-repressors, resulting in an alteration of chromatin
conformation that hinders transcription. Most RB/E2F co-repressors, including histone
deacetylases (HDAC1-3), nucleosome remodeling proteins (BRG1), DNA methyl
transferases (DNMT1) or RBP1 have been identified through hypothesis-driven classical
biochemical approaches (Brehm et al. 1998; Luo et al. 1998; Magnaghi-Jaulin et al. 1998).
Interestingly, HBP1 and CtIP/CtBP co-repressors were discovered by yeast two-hybrid
screening analyses using the pocket protein p130 as the bait (Meloni et al. 1999a; Tevosian et
al. 1997). HBP1, a tumor suppressor member of the HMG family of transcription factors,
Proteomics – Human Diseases and Protein Functions
138
was found to function as a transcriptional repressor of N-MYC in association with RB in
terminally differentiated muscle cells. This finding implies a role of this complex in the
initiation and establishment of cell cycle arrest during differentiation (Tevosian et al. 1997).
However, E2F proteins were not found in this repressor complex. By contrast, the complex
formed by CtIP/CtBP and p130 also included E2F1, and provided an additional mechanism
for RB/E2F-mediated repression (Meloni et al. 1999b). In agreement with the original
findings, it has been recently shown that CtIP/CtBP plays a transcriptional co-repressor role
in ZBRK1 expression. ZBRK1 is a zinc finger-containing transcriptional repressor that can
modulate the expression of GADD45A to induce cell cycle arrest in response to DNA
damage (Liao et al. 2010). It has been proposed that the contribution of RB to DNA damage-
induced growth arrest may depend on the formation of this complex and loss of CtIP/CtBP–
mediated repression could affect the cellular sensitivity to DNA damage. Conversely,
CtIP/CtBP is able to activate the expression of a subset of E2F-target genes after its release
from RB-imposed repression, implying that it can also function as an activator in other
cellular contexts (Liu & Lee 2006).
Yeast two-hybrid screening has been particularly valuable to delve into the mechanistic
basis for the functional specificity of E2F factors, particularly the so-called E2F “activators”
(E2F1-3). This E2F subfamily exhibits a significant degree of functional redundancy among
its members. However, E2F1 appears to be a stronger inducer of apoptosis than E2F2 and
E2F3 (DeGregori et al. 1997; Hong et al. 2008; Kowalik et al. 1998; Lazzerini et al. 2005). The
predominant role of E2F1 over the other E2F members in triggering apoptosis is thought to
be conferred by unique protein partners that E2F1 associates with. The critical domain to
specifically induce apoptosis has been shown to lie in the marked box of E2F1 (Hallstrom &
Nevins 2003). Taking advantage of this knowledge, the E2F1 marked box has been used by
Hallstrom and Nevins as the bait to screen for protein partners that could mediate E2F1-
dependent apoptosis. JAB1 (c-JUN activating-binding protein) was identified as an E2F1-
specific binding protein that functions synergistically with E2F1 to induce apoptosis
coincident with an induction of p53 protein accumulation (Hallstrom & Nevins 2006).
Interestingly, JAB1 association appears to regulate exclusively the apoptotic role of E2F1, as
cell cycle entry is not affected by this E2F protein partner. In addition to JAB1, several more
E2F1-interacting proteins were detected in this screen (Table 1), although their functional
relevance in E2F1 function remains to be determined.
Remarkably, the E2F marked box has emerged as an important domain for mediating
protein interactions that could dictate specificity of promoter recognition. For example, E2F2
and E2F3, but not E2F1 or E2F4, have been shown to interact specifically with RYBP (Ring-1
and YY1-binding protein) through their marked box. RYBP recruits these E2Fs to target
promoters containing YY1 binding sites such as the CDC6 promoter. It has been proposed
that the formation of an E2F2/3-RYBP-YY1 complex would facilitate the timely activation of
CDC6 (Schlisio et al. 2002). An independent yeast two-hybrid screen with E2F3 as the bait
discovered TFE3 (an E-box binding factor) as a protein that specifically interacts with E2F3.
This association, which is dependent on the marked box of E2F3, facilitates transcriptional
activation of the p68 subunit gene of DNA Polα (Giangrande et al. 2003). Furthermore, this
screen also yielded several more proteins that bound specifically the marked box of E2F3
(Table 1). Some of these proteins, such as CBP, RYBP or MGA had previously been shown to
interact with E2Fs (Morris et al. 2000; Ogawa et al. 2002; Schlisio et al. 2002; Trouche et al.
1996), providing a strong validation of the screen. By contrast, E2F1, E2F2 and E2F4 are
unable to bind TFE3 or to activate transcription of p68. Based on the characterization of all