RECENT ADVANCES IN ROBUST CONTROL – NOVEL APPROACHES AND DESIGN METHODSE Part 6 potx
Bạn đang xem bản rút gọn của tài liệu. Xem và tải ngay bản đầy đủ của tài liệu tại đây (523.41 KB, 30 trang )
7
Quantitative Feedback Theory
and Sliding Mode Control
Gemunu Happawana
Department of Mechanical Engineering,
California State University, Fresno, California
USA
1. Introduction
A robust control method that combines Sliding Mode Control (SMC) and Quantitative
Feedback Theory (QFT) is introduced in this chapter. The utility of SMC schemes in robust
tracking of nonlinear mechanical systems, although established through a body of published
results in the area of robotics, has important issues related to implementation and chattering
behavior that remain unresolved. Implementation of QFT during the sliding phase of a SMC
controller not only eliminates chatter but also achieves vibration isolation. In addition, QFT
does not diminish the robustness characteristics of the SMC because it is known to tolerate
large parametric and phase information uncertainties. As an example, a driver’s seat of a
heavy truck will be used to show the basic theoretical approach in implementing the
combined SMC and QFT controllers through modeling and numerical simulation. The SMC
is used to track the trajectory of the desired motion of the driver’s seat. When the system
enters into sliding regime, chattering occurs due to switching delays as well as systems
vibrations. The chattering is eliminated with the introduction of QFT inside the boundary
layer to ensure smooth tracking. Furthermore, this chapter will illustrate that using SMC
alone requires higher actuator forces for tracking than using both control schemes together.
Also, it will be illustrated that the presence of uncertainties and unmodeled high frequency
dynamics can largely be ignored with the use of QFT.
2. Quantitative Feedback Theory Preliminaries
QFT is different from other robust control methodologies, such as LQR/LTR, mu-synthesis,
or H
2
/ H
∞
control, in that large parametric uncertainty and phase uncertainty information
is directly considered in the design process. This results in smaller bandwidths and lower
cost of feedback.
2.1 System design
Engineering design theory claims that every engineering design process should satisfy the
following conditions:
1. Maintenance of the independence of the design functional requirements.
2. Minimization of the design information content.
Recent Advances in Robust Control – Novel Approaches and Design Methods
140
For control system design problems, Condition 1 translates into approximate decoupling in
multivariable systems, while Condition 2 translates into minimization of the controller high
frequency generalized gain-bandwidth product (Nwokah et al., 1997).
The information content of the design process is embedded in G, the forward loop controller
to be designed, and often has to do with complexity, dimensionality, and cost. Using the
system design approach, one can pose the following general design optimization problem.
Let G be the set of all G for which a design problem has a solution. The optimization
problem then is:
M
inimize
G ∈G
{
In
f
ormation
}
contento
f
G
subject to:
i. satisfaction of the functional requirements
ii. independence of the functional requirements
iii. quality adequacy of the designed function.
In the context of single input, single output (SISO) linear control systems, G is given by:
c
I
=
0
log ( ) ,
G
Gi d
ω
ω
ω
∫
(1)
where
G
ω
is the gain crossover frequency or effective bandwidth. If P is a plant family given
by
[
]
2
(,)1 , , , (),Ps H W
λλ ω
∞
=+Δ∈ΛΔ∈Δ<P (2)
then the major functional requirement can be reduced to:
(
)
12
,,( ) ()(, ) ()(, ) 1,Gi W S i W T i
ηωλ ω ω λ ω ω λω
=+≤
0, ,
ωλ
∀≥ ∀∈Λ where
1
()W
ω
and
2
()W
ω
are appropriate weighting functions, and S
and T are respectively the sensitivity and complementary sensitivity functions. Write
() ( )
max
,( ) ,,( )Gi Gi
η
ωω ηλωω
λ
=
∈Λ
.
Then the system design approach applied to a SISO feedback problem reduces to the
following problem:
*
c
I
=
0
min
log ( )
G
Gi d
G
ω
ω
ω
∈
∫
G
, (3)
subject to:
i.
(
)
,( ) 1, 0Gi
ηω ω ω
≤
∀≥
,
ii.
quality adequacy of
1
PG
T
PG
=
+
.
Theorem: Suppose
*G ∈ G . Then:
Quantitative Feedback Theory and Sliding Mode Control
141
*
c
I =
*
00
min
log log *
GG
Gd G d
G
ωω
ω
ω
=
∈
∫∫
G
if and only if
(
)
,*() 1, 0Gi
ηω ω ω
=
∀≥
.
The above theorem says that the constraint satisfaction with equality is equivalent to
optimality. Since the constraint must be satisfied with inequality
0
ω
∀
≥ ; it follows that a
rational
*G must have infinite order. Thus the optimal *G is unrealizable and because of
order, would lead to spectral singularities for large parameter variations; and hence would
be quality-inadequate.
Corollary: Every quality-adequate design is suboptimal.
Both
12
,WW satisfy the compatibility condition min
{
}
[
]
12
,1, 0,WW
ω
<
∀∈ ∞. Now
define
()
()
max
,( ) ,,( )
Gi Gi
η
ωω ηωλω
λ
=
∈Λ
⇔
(
)
[
]
,( ) 1, 0,Gi
ηω ω ω
≤
∀∈ ∞. (4)
Here
11
()0WL
ω
≥∈ or in some cases can be unbounded as ω→0, while
22
()WL
ω
∈ , and
satisfies the conditions:
i.
22
() , 0,
im
WW
ω
ω
=∞ ≥
→∞
ii.
2
2
log ( )
.
1
W
d
ω
ω
ω
+∞
−∞
<
∞
+
∫
(5)
Our design problem now reduces to:
0
min
log ( )
G
Gi d
G
ω
ω
ω
∈
∫
G
,
subject to:
(
)
[
]
,( ) 1, 0, .Gi
ηω ω ω
≤∀∈∞
The above problem does not have an analytic solution. For a numerical solution we define
the nominal loop transmission function
00
() ()Li PGi
ω
ω
=
,
where
0
P ∈P
is a nominal plant. Consider the sub-level set Γ : M → C given by
(
)
(
)
{
}
0
,( ) : ,( ) 1 ,Gi PG Gi
ωω ηωω
Γ= ≤⊂C (6)
and the map
(
)
(
)
12
,,,,: ,(),fWWqM wGi
ωφ ω
→Γ
which carries
M into
(
)
,( )Gi
ω
ω
Γ .
Recent Advances in Robust Control – Novel Approaches and Design Methods
142
Also consider the level curve of (
(
)
(
)
,( )Gi
ωω
Γ ) ∂Γ : M → C \ {∞} given by,
(
)
(
)
{
}
{
}
0
,( ) : ,( ) 1Gi PG Gi
∂ω ω ηω ω
Γ
==⊂∞C\ .
The map
(
)
:,(),fGi
∂ω ω
→Γ ⊂MC
generates bounds on
C for which f is satisfied. The function f is crucial for design purposes
and will be defined shortly.
Write
(,) (,) (,),
ma
Ps P sP s
λ
λλ
=
where
(,)
m
Ps
λ
is minimum phase and (,)
a
Ps
λ
is all-pass. Let
0
()
m
Ps be the minimum
phase nominal plant model and
0
()
a
Ps be the all-pass nominal plant model. Let
000
() () ().
ma
Ps P s P s
=
⋅
Define:
000
() () ()
ma
Ls L s P s=⋅
00
() (). ()
ma
PsGsPs=
()
00
0201
0
() ()
,,( ) 1 ( ) () ( ) ()
(, ) ( ) (, )
mm
a
Pi Pi
Gi L i W L i W
PiPi Pi
ω
ω
ηωλ ω ω ω ω ω
λ
ωω λω
≤⇔ + − ≥ (7)
[
]
,0,
λω
∀
∈Λ ∀ ∈ ∞
By defining:
(,)
0
0
()
(,) ,
(, ) ( )
i
a
Pi
pe
PiPi
θλω
ω
λω
λω ω
= and
()
0
() () ,
i
m
Li q e
φω
ωω
=
the above inequality, (dropping the argument ω), reduces to:
(
)
()
()
22
12 2 12
22
1
(,, , ,) 1 2()cos(() )
1()0,,.
f
WWq W q p WWq
Wp
ωφ λ θλ φ
λλω
=− + −−
+− ≥∀∈Λ∀
(8)
At each ω, one solves the above parabolic inequality as a quadratic equation for a grid of
various
λ
∈Λ
. By examining the solutions over
[
]
2,0,
φπ
∈− one determines a boundary
(
)
{
}
0
(,) : ,( ) 1 ,Cp P G G i
∂ωφ ηωω
==⊂C
so that
(
)
,( ) (,).Gi Cp
∂
ωω ∂ωφ
Γ=
Quantitative Feedback Theory and Sliding Mode Control
143
Let the interior of this boundary be ( , )
o
Cp
ωφ
⊂ C. Then for
2
1W
≤
, it can be shown that
(Bondarev et al., 1985; Tabarrok & Tong, 1993; Esmailzadeh et al., 1990):
() ()
{}
0
,( ) (,) : ,( ) 1,
o
Gi Cp PG Gi
ωω ωφ ηωω
Γ= = ≤C\ (9)
while for
2
1W >
()
,( ) (,) (,) (,)
o
G i Cp C p Cp
ω
ω ∂ ωφ ωφ ωφ
Γ= =∪ .
In this way both the level curves
(
)
,( )Gi
∂
ωω
Γ as well as the sub level sets
(
)
,( )Gi
ω
ω
Γ can
be computed
[
]
0, .
ω
∀∈ ∞ Let N represent the Nichols’ plane:
(
)
{
}
:2 0, r
φπφ
=
−≤≤ −∞<<∞N,r
If ,
i
s
q
e
φ
= then the map
:
m
Ls→ N
sends s to N by the formula:
20 log( ) 20 log .
i
m
Ls r i
q
e
q
i
φ
φ
φ
=+= = +
(10)
Consequently,
(
)
:,() (,,20log)
m
LGiB
pq
∂ω ω ∂ ωφ
Γ→
converts the level curves to boundaries on the Nichols’ plane called design bounds. These
design bounds are identical to the traditional QFT design bounds except that unlike the QFT
bounds,
(
)
,( )Gi
∂
ωω
Γ can be used to generate
[
]
0,Bp
∂ω
∀
∈∞ whereas in traditional QFT,
this is possible only up to a certain
h
ωω
=
<∞
. This clearly shows that every admissible
finite order rational approximation is necessarily sub-optimal. This is the essence of all QFT
based design methods.
According to the optimization theorem, if a solution to the problem exists, then there is an
optimal minimum phase loop transmission function:
*
*
00
() () ()
mm
Li Pi Gi
ω
ωω
=⋅which
satisfies
(
)
[]
*
,() 1, 0,Gi
ηω ω ω
=
∀∈ ∞ (11)
such
*
*
0
|| ()
m
Lq
ω
= , gives 20 log
*
()q
ω
which lies on ,Bp
∂
[
]
0, .
ω
∀
∈∞
If
*
()q
ω
is found,
then (Robinson, 1962) if
11
()WL
ω
∈
and
1
22
()WL
ω
−
∈ ; it follows that
*
*
02
2
1()
1
() exp lo
g
.
1
m
is q
Ls d H
si
αα
α
πα
α
∞
−∞
⎡⎤
−
=∈
⎢⎥
−
+
⎢⎥
⎣
⎦
∫
(12)
Clearly
*
0
()
m
Ls is non-rational and every admissible finite order rational approximation of it
is necessarily sub-optimal; and is the essence of all QFT based design methods.
However, this sub-optimality enables the designer to address structural stability issues by
proper choice of the poles and zeros of any admissible approximation G(s). Without control
of the locations of the poles and zeros of G(s), singularities could result in the closed loop
Recent Advances in Robust Control – Novel Approaches and Design Methods
144
characteristic polynomial. Sub-optimality also enables us to back off from the non-realizable
unique optimal solution to a class of admissible solutions which because of the compactness
and connectedness of
Λ
(which is a differentiable manifold), induce genericity of the
resultant solutions. After this, one usually optimizes the resulting controller so as to obtain
quality adequacy (Thompson, 1998).
2.2 Design algorithm: Systematic loop-shaping
The design theory developed in section 2.1, now leads directly to the following systematic
design algorithm:
1. Choose a sufficient number of discrete frequency points:
12
,.
N
ω
ωω
<
∞…
2.
Generate the level curves (,())
i
Gi
∂
ωω
Γ
and translate them to the corresponding
bounds ( , ).
pi
∂
βωφ
3.
With fixed controller order ,
G
n use the QFT design methodology to fit a loop
transmission function
0
(),
m
Li
ω
to lie just on the correct side of each boundary
(,)
pi
∂
βωφ
at its frequency ,
i
ω
for 20
π
φ
−
≤≤ (start with 12).
G
nor
=
4.
If step 3 is feasible, continue, otherwise go to 7.
5.
Determine the information content (of G(s)) ,
c
I and apply some nonlinear local
optimization algorithm to minimize
c
I until further reduction is not feasible without
violating the bounds ( , ).
pi
∂
βωφ
This is an iterative process.
6.
Determine
.
r
C
If
1,
r
C
≤
go to 8, otherwise continue.
7.
Increase
G
n by 1 (i.e., set 1)
GG
nn
=
+ and return to 3.
8.
End.
At the end of the algorithm, we obtain a feasible minimal order, minimal information
content, and quality-adequate controller.
Design Example
Consider:
[]
[]
(1 )
(,)1 (1 ), ,, .
(1 )
T
kbs
Ps kbd
sds
λλ
−
+
Δ= +Δ = ∈Λ
+
k
∈ [1, 3] , b ∈ [0.05, 0.1] , d ∈ [0.3, 1]
0
3(1 0.05 )
()
(1 0.35)
s
Ps
s
−
=
+
2
.WΔ<
1
1.8
()
2.80
s
Ws
s
+
=
and
32
2
32
2(0.0074 0.333 1.551 1) (.00001 1)
()
3(0.0049 0.246 1.157 1)
sss s
Ws
sss
+++ +
=
+++
1
()Ws RH
∞
∉ but
12
2
() .Ws RH∈ Since we are dealing with loop-shaping, that
1
,WRH
∞
∉
does not matter (Nordgren et al., 1995).
Quantitative Feedback Theory and Sliding Mode Control
145
Using the scheme just described, the first feasible controller G(s) was found as:
83.94 ( 0.66) ( 1.74) ( 4.20)
()
( 0.79) ( 2.3) ( 8.57) ( 40)
sss
Gs
ssss
+++
=
++++
.
This controller produced:
206,
c
I
=
and 39.8.
r
C
=
Although
0
(,)Xs
λ
is now structurally
stable,
r
C is still large and could generate large spectral sensitivity due to its large modal
matrix condition number
().V
κ
Because reduction of the information content improves quality adequacy, Thompson
(Thompson, 1998) employed the nonlinear programming optimization routine to locally
optimize the parameters of G(s) so as to further reduce its information content, and obtained
the optimized controller:
34.31 ( 0.5764) ( 2.088) ( 5.04)
() .
( 0.632) ( 1.84) ( 6.856) ( 40)
sss
Gs
ssss
+++
=
++++
This optimized controller now produced:
0,
c
I
=
and 0.925.
r
C
=
Note that the change in pole locations in both cases is highly insignificant. However,
because of the large coefficients associated with the un-optimized polynomial it is not yet
quality-adequate, and has
39.8.
r
C = The optimized polynomial on the other hand has the
pleasantly small
0.925,
r
C
=
thus resulting in a quality adequate design. For solving the
()
α
λ
singularity problem, structural stability of
0
(,)Xs
λ
is enough. However, to solve the
other spectral sensitivity problems,
1
r
C
≤
is required. We have so far failed to obtain a
quality-adequate design from any of the modern optimal methods
12
(, , ,).HH
μ
∞
Quality adequacy is demanded of most engineering designs. For linear control system
designs, this translates to quality- adequate closed loop characteristic polynomials under
small plant and/or controller perturbations (both parametric and non parametric). Under
these conditions, all optimization based designs produce quality inadequate closed loop
polynomials. By backing off from these unique non-generic optimal solutions, one can
produce a family of quality-adequate solutions, which are in tune with modern engineering
design methodologies. These are the solutions which practical engineers desire and can
confidently implement. The major attraction of the optimization-based design methods is
that they are both mathematically elegant and tractable, but no engineering designer ever
claims that real world design problems are mathematically beautiful. We suggest that, like
in all other design areas, quality adequacy should be added as an extra condition on all
feedback design problems. Note that if we follow axiomatic design theory, every MIMO
problem should be broken up into a series of SISO sub-problems. This is why we have not
considered the MIMO problem herein.
3. Sliding mode control preliminaries
In sliding mode control, a time varying surface of S(t) is defined with the use of a desired
vector, X
d
, and the name is given as the sliding surface. If the state vector X can remain on
the surface S(t) for all time, t>0, tracking can be achieved. In other words, problem of
tracking the state vector, X
≡
X
d
(n- dimensional desired vector) is solved. Scalar quantity, s,
Recent Advances in Robust Control – Novel Approaches and Design Methods
146
is the distance to the sliding surface and this becomes zero at the time of tracking. This
replaces the vector X
d
effectively by a first order stabilization problem in s. The scalar s
represents a realistic measure of tracking performance since bounds on s and the tracking
error vector are directly connected. In designing the controller, a feedback control law U can
be chosen appropriately to satisfy sliding conditions. The control law across the sliding
surface can be made discontinuous in order to facilitate for the presence of modeling
imprecision and of disturbances. Then the discontinuous control law U is smoothed
accordingly using QFT to achieve an optimal trade-off between control bandwidth and
tracking precision.
Consider the second order single-input dynamic system (Jean-Jacques & Weiping, 1991)
() ()xfXbXU
=
+
, (13)
where
X – State vector, [
x
x
]
T
x – Output of interest
f - Nonlinear time varying or state dependent function
U –
Control input torque
b –
Control gain
The control gain, b, can be time varying or state-dependent but is not completely known. In
other words, it is sufficient to know the bounding values of
b,
min max
0 bbb<≤≤
. (14)
The estimated value of the control gain, b
es
, can be found as (Jean-Jacques & Weiping, 1991)
1/2
es min max
()bbb=
Bounds of the gain b can be written in the form:
1
es
b
b
β
β
−
≤
≤
(15)
Where
1/2
max
min
=
b
b
β
⎡
⎤
⎢
⎥
⎣
⎦
The nonlinear function f can be estimated (f
es
) and the estimation error on f is to be bounded
by some function of the original states of f.
es
ff
F
−
≤ (16)
In order to have the system track on to a desired trajectory x(t)
≡
x
d
(t), a time-varying
surface, S(t) in the state-space R
2
by the scalar equation s(x;t) = s = 0 is defined as
_.
d
sxxx
dt
λ
λ
⎛⎞
=+ =+
⎜⎟
⎝⎠
(17)
Quantitative Feedback Theory and Sliding Mode Control
147
where
[
d
XXX x=− =
T
x
⎤
⎦
and
λ
= positive constant (first order filter bandwidth)
When the state vector reaches the sliding surface, S(t), the distance to the sliding surface, s,
becomes zero. This represents the dynamics while in sliding mode, such that
0s
=
(18)
When the Eq. (9) is satisfied, the equivalent control input
, U
es
, can be obtained as follows:
es
bb→
es
b
es
UU→
,es
ff
→
This leads to
es
U = -
es
f
+
d
x
- x
λ
, (19)
and
U is given by
U =
(
1
es
es
U
b
⎛⎞
⎜⎟
⎝⎠
-
)
()s
g
n( )kx s
where
k(x) is the control discontinuity.
The control discontinuity, k(x) is needed to satisfy sliding conditions with the introduction
of an estimated equivalent control. However, this control discontinuity is highly dependent
on the parametric uncertainty of the system. In order to satisfy sliding conditions and for the
system trajectories to remain on the sliding surface, the following must be satisfied:
2
1
2
d
s
dt
= ss
≤
- s
η
(20)
where η is a strictly positive constant.
The control discontinuity can be found from the above inequality:
11 1
11 1
11 1
()(1)()()sgn()
()(1)() ()
() ( 1)( )
es es es d es
es es es d es
es es es d es
sfbbf bb x x bbkx s s
s f bb f bb x x s bb k x s
s
kx bb f f bb x x bb
s
λ
η
λη
λη
−− −
−− −
−− −
⎡⎤
−+−−+− ≤−
⎣⎦
⎡⎤
−+−−++≤
⎣⎦
⎡⎤
≥−+−−++
⎣⎦
For the best tracking performance, k(x) must satisfy the inequality
11 1
() ( 1)( )
es es es d es
kx bb f f bb x x bb
λ
η
−− −
≥−+−−++
Recent Advances in Robust Control – Novel Approaches and Design Methods
148
As seen from the above inequality, the value for k(x) can be simplified further by
rearranging f as below:
f
=
es
f
+
(
f
-
)
es
f
and
es
ff
F
−
≤
11
() ( ) ( 1)( )
es es es es d
kx b b f f b b f x x
λ
−−
≥−+−−+
1
es
bb
η
−
+
()
es
kx b≥
11 1
() 1)(
es es es d es
bff bb f x x bb
λ
η
−− −
−+ − −+ +
() ( ) ( 1)(
es d
kx F
f
xx
βηβ λ
≥++− −+
() ( ) ( 1)
es
kx F U
βηβ
≥++−
(21)
By choosing k(x) to be large enough, sliding conditions can be guaranteed. This control
discontinuity across the surface s = 0 increases with the increase in uncertainty of the system
parameters. It is important to mention that the functions for f
es
and F may be thought of as
any measured variables external to the system and they may depend explicitly on time.
3.1 Rearrangement of the sliding surface
The sliding condition 0s
=
does not necessarily provide smooth tracking performance across
the sliding surface. In order to guarantee smooth tracking performance and to design an
improved controller, in spite of the control discontinuity, sliding condition can be redefined,
i.e. ss
α
=−
(Taha et al., 2003), so that tracking of x → x
d
would achieve an exponential
convergence. Here the parameter
α
is a positive constant. The value for
α
is determined by
considering the tracking smoothness of the unstable system. This condition modifies U
es
as
follows:
es es d
U
f
xxs
λ
α
=
−+− −
and k(x) must satisfy the condition
11
() ( 1)( )
es es es d
kx b b
ff
bb x x
λ
−−
≥−+−−+
1
es
bb s
η
α
−
+−
Further k(x) can be simplified as
() ( ) ( 1) ( 2)
es
kx F U
βηβ β
≥ ++− +−
s
α
(22)
Even though the tracking condition is improved, chattering of the system on the sliding
surface remains as an inherent problem in SMC. This can be removed by using QFT to
follow.
3.2 QFT controller design
In the previous sections of sliding mode preliminaries, designed control laws, which satisfy
sliding conditions, lead to perfect tracking even with some model uncertainties. However,
Quantitative Feedback Theory and Sliding Mode Control
149
after reaching the boundary layer, chattering of the controller is observed because of the
discontinuity across the sliding surface. In practice, this situation can extremely complicate
designing hardware for the controller as well as affect desirable performance because of the
time lag of the hardware functionality. Also, chattering excites undesirable high frequency
dynamics of the system. By using a QFT controller, the switching control laws can be
modified to eliminate chattering in the system since QFT controller works as a robust low
pass filter. In QFT, attraction by the boundary layer can be maintained for all t >0 by varying
the boundary layer thickness,
φ
, as follows:
2
1
()
2
d
sss
dt
φφη
≥→ ≤ −
(23)
It is evident from Eq. (23) that the boundary layer attraction condition is highly guaranteed
in the case of boundary layer contraction ( 0
φ
<
) than for boundary layer expansion ( 0
φ
>
)
(Jean-Jacques, 1991). Equation (23) can be used to modify the control discontinuity gain, k(x),
to smoothen the performance by putting
()sat(/)kx s
φ
instead of ()s
g
n( ).kx s The
relationship between
()and ()kx kx for the boundary layer attraction condition can be
presented for both the cases as follows:
φ
>
0()()kx kx
φ
→=−
2
/
β
(24)
φ
< 0()()kx kx
φ
→=−
2
β
(25)
Then the control law
, U, and s
become
()
1
11
1
()sat(/)
(()sat(/) ) (, )
Where ( , ) ( ) (1 )( )
es
es
es d
desesesd
UUkxs
b
sbbkx s s gxx
gxx f bb f bb x x
φ
φα
λ
−
−−
⎛⎞
=−
⎜⎟
⎝⎠
=− + +Δ
Δ=− +−−+
Since
()kx and
gΔ
are continuous in x, the system trajectories inside the boundary layer can
be expressed in terms of the variable s and the desired trajectory x
d
by the following relation:
Inside the boundary layer, i.e.,
sat( / ) /sss
φ
φφ
≤→ =
and
d
xx→ .
Hence
2
(( )(/)
dd
skxs
β
φ
=
−+
)()
d
sgx
α
+
Δ
. (26)
1/2
max
min
()
Where
()
es d
d
es d
bx
bx
β
⎡
⎤
=
⎢
⎥
⎣
⎦
.
The dynamics inside the boundary layer can be written by combining Eq. (24) and Eq. (25)
as follows:
Recent Advances in Robust Control – Novel Approaches and Design Methods
150
2
0()()/
dd d
kx kx
φ
φβ
>→ = −
(27)
2
0()()/
dd d
kx kx
φ
φβ
<→ = −
(28)
By taking the Laplace transform of Eq. (26), It can be shown that the variable s is given by
the output of a first-order filter, whose dynamics entirely depends on the desired state x
d
(Fig.1).
φ
selection s selection
Fig. 1. Structure of closed-loop error dynamics
Where P is the Laplace variable. ()
d
gx
Δ
are the inputs to the first order filter, but they are
highly uncertain.
This shows that chattering in the boundary layer due to perturbations or uncertainty of
()
d
gxΔ can be removed satisfactorily by first order filtering as shown in Fig.1 as long as
high-frequency unmodeled dynamics are not excited. The boundary layer thickness,
φ
, can
be selected as the bandwidth of the first order filter having input perturbations which leads
to tuning
φ
with
λ
:
2
()(/ )
dd
kx
λ
βαφ
=−
(29)
Combining Eq. (27) and Eq. (29) yields
2
() (/ )
dd
kx
φ
λβ α
>−and
22
()()
ddd
kx
φλαβφβ
+− =
(30)
Also, by combining Eq. (28) and Eq. (29) results in
2
() (/ )
dd
kx
φ
λβ α
<
− and
22 2
(/ )(/ ) ( )/
dd dd
kx
φ
φβ λβ α β
⎡⎤
+−=
⎣⎦
(31)
Equations (24) and (30) yield
22
0()()(/)[()(/ )]
dd d
kx kx kx
φ
ββ φλβα
>→ = − − −
(32)
and combining Eq. (22) with Eq. (28) gives
22
0()()(/)[()(/ )]
dd d
kx kx kx
φ
ββ φλβ α
<→ = − − −
(33)
In addition, initial value of the boundary layer thickness,
(0)
φ
, is given by substituting x
d
at
t=0 in Eq. (29).
2
((0))
(0)
(/ )
d
d
kx
φ
λ
βα
=
−
2
1
P(()/ )
dd
kx
β
φα
+
+
1
P
λ
+
()
d
g
x
Δ
x
s
Quantitative Feedback Theory and Sliding Mode Control
151
The results discussed above can be used for applications to track and stabilize highly
nonlinear systems. Sliding mode control along with QFT provides better system controllers
and leads to selection of hardware easier than using SMC alone. The application of this
theory to a driver seat of a heavy vehicle and its simulation are given in the following
sections.
4. Numerical example
In this section, the sliding mode control theory is applied to track the motion behavior of a
driver’s seat of a heavy vehicle along a trajectory that can reduce driver fatigue and
drowsiness. The trajectory can be varied accordingly with respect to the driver
requirements. This control methodology can overcome most of the road disturbances and
provide predetermined seat motion pattern to avoid driver fatigue. However, due to
parametric uncertainties and modeling inaccuracies chattering can be observed which
causes a major problem in applying SMC alone. In general, the chattering enhances the
driver fatigue and also leads to premature failure of controllers. SMC with QFT developed
in this chapter not only eliminates the chattering satisfactorily but also reduces the control
effort necessary to maintain the desired motion of the seat.
Relationship between driver fatigue and seat vibration has been discussed in many
publications based on anecdotal evidence (Wilson & Horner, 1979; Randall, 1992). It is
widely believed and proved in field tests that lower vertical acceleration levels will increase
comfort level of the driver (U. & R. Landstorm, 1985; Altunel, 1996; Altunel & deHoop,
1998). Heavy vehicle truck drivers who usually experience vibration levels around 3 Hz,
while driving, may undergo fatigue and drowsiness (Mabbott et al., 2001). Fatigue and
drowsiness, while driving, may result in loss of concentration leading to road accidents.
Human body metabolism and chemistry can be affected by intermittent and random
vibration exposure resulting in fatigue (Kamenskii, 2001). Typically, vibration exposure
levels of heavy vehicle drivers are in the range 0.4 m/s
2
- 2.0 m/s
2
with a mean value of 0.7
m/s
2
in the vertical axis (U. & R. Landstorm, 1985; Altunel, 1996; Altunel & deHoop, 1998;
Mabbott et al., 2001).
A suspension system determines the ride comfort of the vehicle and therefore its
characteristics may be properly evaluated to design a proper driver seat under various
operating conditions. It also improves vehicle control, safety and stability without changing
the ride quality, road holding, load carrying, and passenger comfort while providing
directional control during handling maneuvers. A properly designed driver seat can reduce
driver fatigue, while maintaining same vibration levels, against different external
disturbances to provide improved performance in riding.
Over the past decades, the application of sliding mode control has been focused in many
disciplines such as underwater vehicles, automotive applications and robot manipulators
(Taha et al., 2003; Roberge, 1960; Dorf, 1967; Ogata, 1970; Higdon, 1963; Truxal, 1965;
Lundberg, 2003; Phillips, 1994; Siebert, 1986). The combination of sliding controllers with
state observers was also developed and discussed for both the linear and nonlinear cases
(Hedrick & Gopalswamy, 1989; Bondarev et al., 1985). Nonlinear systems are difficult to
model as linear systems since there are certain parametric uncertainties and modeling
inaccuracies that can eventually resonate the system (Jean-Jacques, 1991). The sliding mode
control can be used for nonlinear stabilization problems in designing controllers. Sliding
mode control can provide high performance systems that are robust to parameter
Recent Advances in Robust Control – Novel Approaches and Design Methods
152
uncertainties and disturbances. Design of such systems includes two steps: (i) choosing a set
of switching surfaces that represent some sort of a desired motion, and (ii) designing a
discontinuous control law that ensures convergence to the switching surfaces (Dorf, 1967;
Ogata, 1970). The discontinuous control law guarantees the attraction features of the
switching surfaces in the phase space. Sliding mode occurs when the system trajectories are
confined to the switching surfaces and cannot leave them for the remainder of the motion.
Although this control approach is relatively well understood and extensively studied,
important issues related to implementation and chattering behavior remain unresolved.
Implementing QFT during the sliding phase of a SMC controller not only eliminates chatter
but also achieves vibration isolation. In addition, QFT does not diminish the robustness
characteristics of the SMC because it is known to tolerate large parametric and phase
information uncertainties.
Figure 2 shows a schematic of a driver seat of a heavy truck. The model consists of an
actuator, spring, damper and a motor sitting on the sprung mass. The actuator provides
actuation force by means of a hydraulic actuator to keep the seat motion within a comfort
level for any road disturbance, while the motor maintains desired inclination angle of the
driver seat with respect to the roll angle of the sprung mass. The driver seat mechanism is
connected to the sprung mass by using a pivoted joint; it provides the flexibility to change
the roll angle. The system is equipped with sensors to measure the sprung mass vertical
acceleration and roll angle. Hydraulic pressure drop and spool valve displacement are also
used as feedback signals.
Fig. 2. The hydraulic power feed of the driver seat on the sprung mass
Nomenclature
A - Cross sectional area of the hydraulic actuator piston
F
af
- Actuator force
F
h
- Combined nonlinear spring and damper force of the driver seat
k
h
- Stiffness of the spring between the seat and the sprung mass
Sprung Mass, m
s
Motor
Actuator
x
h
, θ
s
x
s
, θ
s
Mass of the
driver & Seat
Spring
m
h
Quantitative Feedback Theory and Sliding Mode Control
153
m
h
- Mass of the driver and the seat
m
s
- Sprung mass
x
h
- Vertical position coordinate of the driver seat
x
s
- Vertical position coordinate of the sprung mass
θ
s
- Angular displacement of the driver seat (same as sprung mass)
4.1 Equations of motion
Based on the mathematical model developed above, the equation of motion in the vertical
direction for the driver and the seat can be written as follows:
(1/ ) (1/ )
hhhha
f
xmFmF
=
−+
, (34)
where
32
12 1 2
s
g
n( )
hhhhh hh hh h
FkdkdCdCd d=++ +
k
h1
- linear stiffness
k
h2
- cubic stiffness
C
h1
- linear viscous damping
C
h2
- fluidic (amplitude dependent) damping
sgn - signum function
a
f
L
FAP
=
1
()sin
hhs i s
dxxa
θ
=−−
Complete derivation of Eq. (34) is shown below for a five-degree-of-freedom roll and
bounce motion configuration of the heavy truck driver-seat system subject to a sudden
impact. In four-way valve-piston hydraulic actuator system, the rate of change of pressure
drop across the hydraulic actuator piston,
P
L
, is given by (Fialho, 2002)
1
()
4
L
lp L h s
e
VP
QCP Ax x
β
=− − −
(35)
V
t
- Total actuator volume
b
e
- Effective bulk modulus of the fluid
Q - Load flow
C
tp
- Total piston leakage coefficient
A - Piston area
The load flow of the actuator is given by
(Fialho, 2002):
[]
1
s
g
ns
g
n( ) (1 / ) s
g
n( )
svd svL
QPxPCx PxP
ν
ωρ
=− −
(36)
P
s
– Hydraulic supply pressure
ω - Spool valve area gradient
X
ν
− Displacement of the spool valve
Recent Advances in Robust Control – Novel Approaches and Design Methods
154
ρ - Hydraulic fluid density
C
d
– Discharge coefficient
Voltage or current can be fed to the servo-valve to control the spool valve displacement of
the actuator for generating the force. Moreover, a stiction model for hydraulic spool can be
included to reduce the chattering further, but it is not discussed here.
Fig. 3. Five-degree-of-freedom roll and bounce motion configuration of the heavy duty truck
driver-seat system.
Nonlinear force equations
Nonlinear tire forces, suspension forces, and driver seat forces can be obtained by
substituting appropriate coefficients to the following nonlinear equation that covers wide
range of operating conditions for representing dynamical behavior of the system.
32
12 1 2
s
g
n( )Fkdkd Cd Cd d=+ + +
where
F - Force
k
1
- linear stiffness coefficient
k
2
- cubic stiffness coefficient
C
1
- linear viscous damping coefficient
C
2
- amplitude dependent damping coefficient
d - deflection
For the suspension:
32
12 1 2
s
g
n( )
si si si si si si si si si si
FkdkdCdCd d=++ +
For the tires:
32
12 1 2
s
g
n( )
ti ti ti ti ti ti ti ti ti ti
FkdkdCdCd d=++ +
x
h
x
u
x
s
F
t1
F
t2
F
t3 F
t4
S
i
F
s1
F
s2
F
h
T
i
A
i
Tires & axle
Suspension
a
1i
Seat
ө
s
ө
s
ө
u
Quantitative Feedback Theory and Sliding Mode Control
155
For the seat:
32
12 1 2
s
g
n( )
hhhhh hh hh h
FkdkdCdCd d=++ +
Deflection of the suspension springs and dampers
Based on the mathematical model developed, deflection of the suspension system on the
axle is found for both sides as follows:
1
s2
Deflection of side1, ( ) (sin sin )
Deflection of side2, ( ) (sin sin )
ssuis u
su i s u
dxxS
dxxS
θ
θ
θ
θ
=
−+ −
=−− −
Deflection of the seat springs and dampers
By considering the free body diagram in Fig. 3, deflection of the seat is obtained as follows
(Rajapakse & Happawana, 2004):
1
()sin
hhs i s
dxxa
θ
=
−−
Tire deflections
The tires are modeled by using springs and dampers. Deflections of the tires to a road
disturbance are given by the following equations.
1
2
3
4
Deflectionoftire1, ( )sin
Deflectionoftire2, sin
Deflectionoftire3, sin
Deflectionof tire4, ( )sin
tuii u
tuiu
tui u
tuii u
dxTA
dxT
dxT
dxTA
θ
θ
θ
θ
=
++
=+
=−
=−+
Equations of motion for the combined sprung mass, unsprung mass and driver seat
Based on the mathematical model developed above, the equations of motion for each of the
sprung mass, unsprung mass, and the seat are written by utilizing the free-body diagram of
the system in Fig. 3 as follows:
Vertical and roll motion for the i
th
axle (unsprung mass)
12 1234
()( )
uu s s t t t t
mx F F F F F F=+−+++
(37)
12 32 41
()cos()cos()()cos
uu i s s u i t t u i i t t u
JSFF TFF TAFF
θ
θθ θ
=− +− ++ −
(38)
Vertical and roll motion for the sprung mass
12
()
ss s s h
mx F F F
=
−+ +
(39)
21 1
()cos cos
ss i s s s ih s
JSFF aF
θ
θθ
=− +
(40)
Vertical motion for the seat
hh h
mx F
=
−
(41)
Equations (37)-(41) have to be solved simultaneously, since there are many parameters and
nonlinearities. Nonlinear effects can better be understood by varying the parameters and
Recent Advances in Robust Control – Novel Approaches and Design Methods
156
examining relevant dynamical behavior, since changes in parameters change the dynamics
of the system. Furthermore, Eqs. (37)-(41) can be represented in the phase plane while
varying the parameters of the truck, since each and every trajectory in the phase portrait
characterizes the state of the truck. Equations above can be converted to the state space form
and the solutions can be obtained using MATLAB. Phase portraits are used to observe the
nonlinear effects with the change of the parameters. Change of initial conditions clearly
changes the phase portraits and the important effects on the dynamical behavior of the truck
can be understood.
4.2 Applications and simulations (MATLAB)
Equation (34) can be represented as,
h
xfbU
=
+
(42)
where
(1/ )
hh
fmF=−
1/
h
bm
=
a
f
UF
=
The expression f is a time varying function of
s
x and the state vector
h
x . The time varying
function,
s
x
, can be estimated from the information of the sensor attached to the sprung
mass and its limits of variation must be known. The expression, f, and the control gain, b are
not required to be known exactly, but their bounds should be known in applying SMC and
QFT. In order to perform the simulation,
s
x
is assumed to vary between -0.3m to 0.3m and it
can be approximated by the time varying function
, sin( )At
ω
, where
ω
is the disturbance
angular frequency of the road by which the unsprung mass is oscillated. The bounds of the
parameters are given as follows:
min maxhhh
mmm
≤
≤
min maxsss
xxx
≤
≤
min max
bbb
≤
≤
Estimated values of
m
h
and x
s
:
1/2
min max
()
hes h h
mmm=
1/2
min max
()
ses s s
xxx=
Above bounds and the estimated values were obtained for some heavy trucks by utilizing
field test information (Tabarrok & Tong, 1993, 1992; Esmailzadeh et al., 1990; Aksionov,
2001; Gillespie, 1992; Wong, 1978; Rajapakse & Happawana, 2004; Fialho, 2002). They are as
follows:
Quantitative Feedback Theory and Sliding Mode Control
157
min
50
h
mkg= ,
max
100
h
mkg
=
,
min
0.3
s
xm
=
− ,
max
0.3
s
xm
=
, 2(0.1 10) /rad s
ω
π
=
− , A=0.3
The estimated nonlinear function, f, and bounded estimation error, F, are given by:
(/ )( )
es h hes h ses
fkmxx=− −
max
es
Fff
=
−
0.014
es
b
=
β=1.414
1/2
min max
()
ses s s
xxx=
The sprung mass is oscillated by road disturbances and its changing pattern is given by the
vertical angular frequency,
2(0.1 9.9sin(2 ))t
ωπ π
=+ . This function for
ω
is used in the
simulation in order to vary the sprung mass frequency from 0.1 to 10 Hz. Thus
ω
can be
measured by using the sensors in real time and be fed to the controller to estimate the
control force necessary to maintain the desired frequency limits of the driver seat. Expected
trajectory for
h
x is given by the function, sin
hd d
xB t
ω
=
, where
d
ω
is the desired angular
frequency of the driver to have comfortable driving conditions to avoid driver fatigue in the
long run. B and
d
ω
are assumed to be .05 m and 2 * 0.5
π
rad/s during the simulation which
yields 0.5 Hz continuous vibration for the driver seat over the time. The mass of the driver
and seat is considered as 70 kg throughout the simulation. This value changes from driver to
driver and can be obtained by an attached load cell attached to the driver seat to calculate
the control force. It is important to mention that this control scheme provides sufficient
room to change the vehicle parameters of the system according to the driver requirements to
achieve ride comfort.
4.3 Using sliding mode only
In this section tracking is achieved by using SMC alone and the simulation results are
obtained as follows.
Consider
(1)
h
xx= and (2)
h
xx
=
. Eq. (25) is represented in the state space form as follows:
(1) (2)xx
=
(2) ( / )( (1) )
hh es
xkmxxbU
=
−−+
Combining Eq. (17), Eq. (19) and Eq. (42), the estimated control law becomes,
( (2) )
es es hd hd
Ufx xx
λ
=
−+ − −
Figures 4 to 7 show system trajectories, tracking error and control torque for the initial
condition:
[,]=[0.1m , 1m/s.]
hh
xx
using the control law. Figure 4 provides the tracked
vertical displacement of the driver seat vs. time and perfect tracking behavior can be
observed. Figure 5 exhibits the tracking error and it is enlarged in Fig. 6 to show it’s
chattering behavior after the tracking is achieved. Chattering is undesirable for the
Recent Advances in Robust Control – Novel Approaches and Design Methods
158
controller that makes impossible in selecting hardware and leads to premature failure of
hardware.
The values for
and
λ
η
in Eq. (17) and Eq. (20) are chosen as 20 and 0.1 (Jean-Jacques, 1991) to
obtain the plots and to achieve satisfactory tracking performance. The sampling rate of 1
kHz is selected in the simulation. 0s
=
condition and the signum function are used. The
plot of control force vs. time is given in Fig. 7. It is very important to mention that, the
tracking is guaranteed only with excessive control forces. Mass of the driver and driver seat,
limits of its operation, control bandwidth, initial conditions, sprung mass vibrations,
chattering and system uncertainties are various factors that cause to generate huge control
forces. It should be mentioned that this selected example is governed only by the linear
equations with sine disturbance function, which cause for the controller to generate periodic
sinusoidal signals. In general, the road disturbance is sporadic and the smooth control
action can never be expected. This will lead to chattering and QFT is needed to filter them
out. Moreover, applying SMC with QFT can reduce excessive control forces and will ease
the selection of hardware.
In subsequent results, the spring constant of the tires were 1200kN/m & 98kN/m
3
and the
damping coefficients were 300kNs/m & 75kNs/m
2
. Some of the trucks’ numerical
parameters (Taha et al., 2003; Ogata, 1970; Tabarrok & Tong, 1992, 1993; Esmailzadeh et al.,
1990; Aksionov, 2001; Gillespie, 1992; Wong, 1978) are used in obtaining plots and they are
as follows: m
h
= 100kg, m
s
= 3300kg, m
u
= 1000kg, k
s11
= k
s21
= 200 kN/m & k
s12
=k
s22
= 18
kN/m
3
, k
h1
= 1 kN/m & k
h2
= 0.03 kN/m
3
,C
s11
= C
s21
= 50 kNs/m & C
s12
= C
s22
= 5 kNs/m
2
,
C
h1
= 0.4 kNs/m & C
h2
= 0.04 kNs/m , J
s
= 3000 kgm
2
, J
u
= 900 kgm
2
, A
i
= 0.3 m, S
i
= 0.9 m,
and a
1i
= 0.8 m.
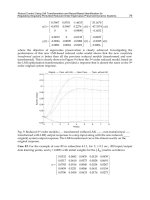
Fig. 4. Vertical displacement of driver seat vs. time using SMC only
Quantitative Feedback Theory and Sliding Mode Control
159
Fig. 5. Tracking error vs. time using SMC only
Fig. 6. Zoomed in tracking error vs. time using SMC only
Fig. 7. Control force vs. time using SMC only
Recent Advances in Robust Control – Novel Approaches and Design Methods
160
4.4 Use of QFT on the sliding surface
Figure 8 shows the required control force using SMC only. In order to lower the excessive
control force and to further smoothen the control behavior with a view of reducing
chattering, QFT is introduced inside the boundary layer. The following graphs are plotted
for the initial boundary layer thickness of 0.1 meters.
Fig. 8. Vertical displacement of driver seat vs. time using SMC & QFT
Fig. 9. Tracking error vs. time using SMC & QFT
Quantitative Feedback Theory and Sliding Mode Control
161
Fig. 10. Zoomed in tracking error
vs. time using SMC & QFT
Fig. 11. Control force vs. time using SMC & QFT
Fig. 12. Zoomed in control force
vs. time using SMC & QFT
Recent Advances in Robust Control – Novel Approaches and Design Methods
162
Fig. 13. s-trajectory with time-varying boundary layer vs. time using SMC & QFT
Figure 8 again shows that the system is tracked to the trajectory of interest and it follows the
desired trajectory of the seat motion over the time. Figure 9 provides zoomed in tracking
error of Fig. 8 which is very small and perfect tracking condition is achieved. The control
force needed to track the system is given in Fig. 11. Figure
12 provides control forces for
both cases, i.e., SMC with QFT and SMC alone. SMC with QFT yields lower control force
and this can be precisely generated by using a hydraulic actuator. Increase of the parameter
λ
will decrease the tracking error with an increase of initial control effort.
Varying thickness of the boundary layer allows the better use of the available bandwidth,
which causes to reduce the control effort for tracking the system. Parameter uncertainties
can effectively be addressed and the control force can be smoothened with the use of the
SMC and QFT. A successful application of QFT methodology requires selecting suitable
function for F, since the change in boundary layer thickness is dependent on the bounds of
F. Increase of the bounds of F will increase the boundary layer thickness that leads to
overestimate the change in boundary layer thickness and the control effort. Evolution of
dynamic model uncertainty with time is given by the change of boundary layer thickness.
Right selection of the parameters and their bounds always result in lower tracking errors
and control forces, which will ease choosing hardware for most applications.
5. Conclusion
This chapter provided information in designing a road adaptive driver’s seat of a heavy
truck via a combination of SMC and QFT. Based on the assumptions, the simulation results
show that the adaptive driver seat controller has high potential to provide superior driver
comfort over a wide range of road disturbances. However, parameter uncertainties, the
presence of unmodeled dynamics such as structural resonant modes, neglected time-delays,
and finite sampling rate can largely change the dynamics of such systems. SMC provides
effective methodology to design and test the controllers in the performance trade-offs. Thus
tracking is guaranteed within the operating limits of the system. Combined use of SMC and
QFT facilitates the controller to behave smoothly and with minimum chattering that is an
inherent obstacle of using SMC alone. Chattering reduction by the use of QFT supports
Quantitative Feedback Theory and Sliding Mode Control
163
selection of hardware and also reduces excessive control action. In this chapter simulation
study is done for a linear system with sinusoidal disturbance inputs. It is seen that very high
control effort is needed due to fast switching behavior in the case of using SMC alone.
Because QFT smoothens the switching nature, the control effort can be reduced. Most of the
controllers fail when excessive chattering is present and SMC with QFT can be used
effectively to smoothen the control action. In this example, since the control gain is fixed, it
is independent of the states. This eases control manipulation. The developed theory can be
used effectively in most control problems to reduce chattering and to lower the control
effort. It should be mentioned here that the acceleration feedback is not always needed for
position control since it depends mainly on the control methodology and the system
employed. In order to implement the control law, the road disturbance frequency,
ω
, should
be measured at a rate higher or equal to 1000Hz (comply with the simulation requirements)
to update the system; higher frequencies are better. The bandwidth of the actuator depends
upon several factors; i.e. how quickly the actuator can generate the force needed, road
profile, response time, and signal delay, etc.
6. References
Aksionov, P.V. (2001). Law and criterion for evaluation of optimum power distribution to
vehicle wheels, Int. J. Vehicle Design, Vol. 25, No. 3, pp. 198-202.
Altunel, A. O. (1996). The effect of low-tire pressure on the performance of forest products
transportation vehicles, Master’s thesis, Louisiana State University, School of
Forestry, Wildlife and Fisheries.
Altunel, A. O. and De Hoop C. F. (1998). The Effect of Lowered Tire Pressure on a Log Truck
Driver Seat, Louisiana State University Agriculture Center, Vol. 9, No. 2, Baton
Rouge, USA.
Bondarev, A. G. Bondarev, S. A., Kostylyova, N. Y. and Utkin, V. I. (1985). Sliding Modes in
Systems with Asymptotic State Observers, Automatic. Remote Control, Vol. 6.
Dorf, R. C. (1967). Modern Control Systems, Addison-Wesley, Reading, Massachusetts, pp.
276 – 279.
Esmailzadeh, E., Tong, L. and Tabarrok, B. (1990). Road Vehicle Dynamics of Log Hauling
Combination Trucks, SAE Technical Paper Series 912670, pp. 453-466.
Fialho, I. and Balas, G. J. (2002). Road Adaptive Active Suspension Design Using Linear
Parameter-Varying Gain-Scheduling, IEEE transaction on Control Systems Technology,
Vol. 10, No.1, pp. 43-54.
Gillespie, T. D. (1992). Fundamentals of Vehicle Dynamics, SAE, Inc. Warrendale, PA.
Hedrick, J. K. and Gopalswamy, S. (1989). Nonlinear Flight Control Design via Sliding
Method, Dept. of Mechanical Engineering, Univ. of California, Berkeley.
Higdon, D. T. and Cannon, R. H. (1963). ASME J. of the Control of Unstable Multiple-
Output Mechanical Systems, ASME Publication, 63-WA-148, New York.
Jean-Jacques, E. S. and Weiping, L. (1991). Applied Nonlinear Control, Prentice-Hall, Inc.,
Englewood Cliffs, New Jersey 07632.
Kamenskii, Y. and Nosova, I. M. (1989). Effect of whole body vibration on certain indicators
of neuro-endocrine processes, Noise and Vibration Bulletin, pp. 205-206.
Landstrom, U. and Landstrom, R. (1985). Changes in wakefulness during exposure to whole
body vibration, Electroencephal, Clinical, Neurophysiology, Vol. 61, pp. 411-115.