Scientific, Health and Social Aspects of the Food Industry Part 16 ppt
Bạn đang xem bản rút gọn của tài liệu. Xem và tải ngay bản đầy đủ của tài liệu tại đây (568.07 KB, 30 trang )
22
Employment of the Quality Function
Deployment (QFD) Method in the
Development of Food Products
Caroline Liboreiro Paiva and Ana Luisa Daibert Pinto
University Federal of Minas Gerais
Brazil
1. Introduction
Currently, in a more intensive way, companies have been forced to adapt to the new
competitive market. The technological industry changes’ occurring since the 80’s brought
implications for the international competition, specially the demarcation of new areas of
global competition. That happens due to the acceleration of technological changes added by
the shortening of the life cycle of products and processes, besides the increasing of the
products differentiation. In fact, what is observed is that these factors have not only led
companies to restructure their production systems and their types of management, but
above all, to guarantee the capacity to deliver to a market, products even more
sophisticated. The ability to realize alternatives to compete in the market, to develop
strategies and to invest in appropriate training that is what has ensured the survival and
profitability of organizations in this new structure.
In terms of food industry competition, what is observed is that the integrity of the product
has become the main focus. This means that product excellence, in the food industry, goes
beyond simply offering goods with basic attributes. These attributes have only become a
precondition for the company to keep playing the competitive game. In fact, nowadays, the
products must not only satisfy, but above all, surprise their customers. What is realized is
that these consumers have accumulated experience with several products and become
sensitive to small differences in many ways. This means that innovations in products and
processes increase the excellence standard of product, making the process of development
an essential factor for the competition of enterprises.
Certainly, the best projects require staff competence, efficiency in the work, on the exchange
of information between functions and on the understanding of the market needs into
technical language. They also require efficiency in problem solving and in the use of its
resources. In this sense the Quality Function Deployment (QFD) method has proven to be
efficient in order to translate in a more effectively way the needs and expectations of
consumers, to promote greater interaction between the teams involved in the project, to
accelerate the solution of problems and to reduce the development time.
The QFD was invented in the late 1960’s in Japan. Within the context of TQC (Total Quality
Control), the Japanese model of quality management system was responsible to cause a
revolution in the production system of that country. All that was possible, due to the
Scientific, Health and Social Aspects of the Food Industry
440
emphasis on the product quality considering the point of view of the customer. QFD is the
unfolding, step by step, of functions or operations that make up the product quality. The
methodology seeks to solve the problems inherent to the product’s development process in
their early stages, in a way that the critical points that determine the quality of the product
and the manufacturing process are established in the phase of their design and controlled
during the development stages. The methodology also ensures the achievement of quality
because it works with a focus on consumer needs. More specifically, it translates the
consumer's requirements into technical language and then ensures their satisfaction along
the process of product’s development.
The quality matrix is the tool used to organize the consumer’s needs into technical
information. The matrix goal is to define the pattern, quantitative or qualitative, of each
attribute of quality of the final product. The other matrices are due to the quality matrix and
aim to detail the project so that all the factors that contribute to the achievement of the final
product are designed, as characteristics of the intermediates products, parameters of the
manufacturing process, raw materials and inputs.
In addition, the QFD method assists the management of product development process
because it coordinates the flow of information and organizes activities in terms of functions.
It promotes the functional integration and rapid resolution of problems.
With all that, the purpose of this chapter is to describe the potential use of the QFD method
into product development in food companies. The study initially intends to contextualize
the management of product development in the food industry and show the QFD method as
a tool capable of directing, in a practice way, how to plan and conduct the activities of the
process of product development. So the steps for the application of QFD in the development
of a food product will be detailed. In addition, support tools within the marketing research
and sensory analysis will be suggested.
2. Product differentiation: A strategy adopted by the food industry
The food industry never has launched so many new products as it has in recent years. Due
to factors such as technological development, increasing of competitiveness in the sector due
to the growth of the competition such in and out of the countries, and greater consumer
demand which incorporated new values to its preferences, the shelves of supermarkets
receive daily new products (Athayde, 1999).
The focus on markets niche is one of the strongest trends today in the food sector. There is a
search for products that provide pleasure to be consumed, such as the sophisticated
products with high added value, or looking for fun products aimed at children. Likewise,
products that refer to a particular region of the world, or of exotic flavors are searched by
another portion of the market of processed foods.
Allied to all that, a strong feature of the new releases is the convenience in food
consumption. This requirement is related to changes on consumers’ lifestyle. The growing
participation of women in the labor market, added by the increasing mobility of consumers,
reduced the demand for ingredients to prepare meals at home and increased the offer of
practical foods that can be consumed at any time, and of ready to go foods or pre-prepared.
Industry has also been required to apply new technologies in the development of food and
beverages, specially the search for new ingredients. The changes in consumption habits it is
driven by the concern for the health, aesthetics and environment. It demands food products
of low-calorie, healthier and natural and environmentally friendly. A strong trend is the
Employment of the Quality Function
Deployment (QFD) Method in the Development of Food Products
441
launch of products, which besides the presence of the sensory and nutritional quality, also
present health benefits, so-called functional foods.
It is also important to emphasize the growing importance of equipment suppliers.
Companies specializing in process engineering, who believe the research as a basis for
technological innovation, have an important role in the development of food products
(Earle, 1997). New technologies are able to provide new concepts of product, new
alternatives for use, and being difficult to be imitated by competitors.
Finally, in addition to the significant number of new products available on the market in
recent years, it is worth noting the great contribution of the sector of packaging for the food
market, making it possible that these strategies of differentiation, segmentation and
consumer convenience can be realized.
3. Stages of product development process
The process of product development, outlined in a model, consists of a sequence of activities
ordered in time or a set of tasks that aim to facilitate the management of the process as a
whole.
There isn’t a standard development model that fits all circumstances and conditions
experienced in a company. However, if the company adapts your way of management to a
model more suited to its environment, probably the company will get better performance in
their innovation processes. Anyway, the consensus is that development must be conducted
so that the product reaches the market as quickly as possible, providing to the product the
quality expected by customers and having costs optimized.
Students of product development management have different ways of representing the
necessary steps to this process. Picture 1 seeks to represent the basic steps; steps that will
assist the planning, the development of the product itself and the release of the same. Of
course the product will have a greater chance of market success with this process if there is
efficient management. For Clark & Wheelwright (1993), this means that the company should
have skills to quickly identify opportunities, which often leads them to introduce new
products ahead of their competitors. The best projects require also the team's competence,
work efficiency, the exchange of information between functions and translation of the
markets needs in technical language. They also required efficiency in problem solving and
in the use of resources.
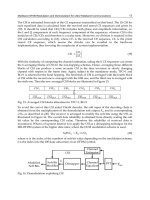
In Picture 1, the process of product development is represented by stage-gates. The stages are
the various stages of development and the gates, decision points that precede each stage,
opening or closing the door to continue the project (Cooper, 2001). These gates serve as
critical steps for assessing the projects. The results of these evaluations are reflected in the
decision to continue the project, drop it, stop it or resume it on another occasion.
Before joining the project into the development phase, the organization must seek the means
that will ensure that the product will reach customers needs. Several market research –
research of needs and desires of the consumers, competitive analysis and concept testing -
will help to define more precisely the concept of the product. The first step in this direction
is to translate the information inside and outside of the company in technical language, until
you define the product’s concept. For this, extract the data through market research, group
discussions, customer complaints and tacit knowledge of employees. The various functions
involved in the process are then in charge of mapping information and developing the
work.
Scientific, Health and Social Aspects of the Food Industry
442
Fig. 1. Stages of the process of product development
In the stage of identifying opportunities, the company must seek ways to generate ideas for
the new products. This can be achieved by internal efforts, through research in the
departments of R&D, through contests to stimulate ideas for new products, or through the
Customer Services, in meetings, using brainstorming techniques, or by stimulating a business
culture that valorize the opinions and ideas of employees. On the other hand, the ideas for
new products can come from external sources such as quantitative or qualitative research
with target consumers. Other sources of ideas can come from university research
publications or specialized organs, experience and knowledge of sales staff, contact with
suppliers and also reverse lookup on products of competitors.
Employment of the Quality Function
Deployment (QFD) Method in the Development of Food Products
443
In this step it should be also made a prior assessment of the market for each idea,
considering its size, segments and potential. It should also be evaluated the feasibility of
manufacturing the product, the ability to be accepted by the market as well as their
vulnerability towards competitors products or substitutes.
The ideas should then go through a team that will evaluate and select the ideas by checking
out promising, profitable or those that must be rejected. Every idea that is nominated as
possible to be developed will then go to the stage of definition and testing of its concept. The
concept of a product can be defined as the expected benefits to meet the needs and
expectations of consumers. The concept definition phase must determine the target
audience, what are the main benefits that the product will present and a more appropriate
occasion to consume it.
After the definition of the product’s conception is convenient to test it. The test of the
concept is a marketing research technique used to assess the market potential of the concept.
Provides estimates of intent to purchase and sales volume. Define "who" would use the
product, in which "circumstances" and how "often".
Finally, we must make the financial analysis of the project. The size of the market, the
expected market share, the price analysis, along with technical cost estimates of equipment
and for product launch are the inputs needed to make such an analysis. Once the project is
defined, the only thing needed is that top management approves it, so the development of
the product can be started.
Only then the product will go into the product development stage itself. However, it is
necessary to first make the process and product planning. Regarding the product is
necessary to define the product requirements, such as: the ingredients that will be needed,
the most suitable additives, the quantity/volume that will be marketed. It is still important
to define the requirements of legislation, such as: what will be the standard of identity and
quality of the product, if the planned additives are allowed by the competent organizations
and what the limit of application, and also the labeling requirements.
In relation to the manufacture of the product, it is necessary to first specify the parameters of
the process, which involves the study of manufactured technology and the parameters of
quality and of process that need to be controlled in the manufacturing line.
The development process then proceeds to the phase of preparation of the prototypes,
usually in an industrial kitchen for the definition of the formulation and of the sensory
products parameters. Soon after it should be performed sensory tests in one or more
prototypes, if possible with a sample of the target market, in order to verify the acceptance
of the product.
Thus, the development of the product passes to the manufacturing phase of the pilot which
consists in the manufacture of the product on a small industry scale, in order to define the
quality parameters of intermediate products and process parameters that will be
monitorized. Likewise, tests should be made of pilot products: sensory tests, again if
possible with a sample of the target market, in order to verify if the product remains viable.
Only then the company will plan the production on an industrial scale.
Soon afterwards the company can produce on an industrial scale, to launch the new
product. In the launch phase is necessary to determine: a release date, geographical location
and potential consumers in the target market. It is necessary to establish an advertising plan,
that would include promotional and dissemination strategies.
Scientific, Health and Social Aspects of the Food Industry
444
Finally, the last step is to evaluate the project developed. The company has an opportunity
to implement its system of product development through learning gained during the
implementation of each individual project. The project audit aims to verify the strong and
weak points and to define strategies for improving the performance of future projects. It is
believed that only a deep understanding of the causes of problems and circumstances in
which they occur, will allow the company to improve the performance of development
activities, by improving the procedures, processes, management skills, methods, making the
company able to develop a faster process, more efficient in the use of resources and in the
development of products of higher quality.
4. The QFD Method
The QFD Method, Quality Function Deployment, originated in Japan in the late 60's, as a
result of the study of the professors Akao and Mizuno (Mizuno, 1969). On this occasion, the
movement for the Total Quality in that country had already achieved very significant
results. The ideas of quality emerged after World War II starting with the Statistical Process
Control (SPC) and evolved in the late 60's, to a much broader approach, in which it was
already understood at the system level, and not only in technical terms or isolated functions,
but also in management terms, and thus practiced throughout the whole organization. To
get an idea, in 1968, the Quality Control (QC) in Japan had already reached the point where
virtually all firms made usage of the QC in some way (Mizuno, 1969).
However, there was a gap in establishing the quality into a level of development of
products. There were questions about what points should be considered in the design phase
of projects that could operationalize the quality planning of both products and processes.
There were also difficulties in ensuring that the planned quality was actually executed in the
phase of serial production (Mizuno, 1969).
Then arises from these needs, the initial concepts of Quality Deployment, and in 1972, after
conducting some researches, the ideas become practically implemented. In 1978, it was
published the book "Quality Function Deployment" which gave a new impetus to the
dissemination of QFD, causing it to be quickly implemented in several companies in the
country.
Currently, QFD inspires a strong interest in the world, generating ever-new applications,
practitioners and researchers each year. This method is in use in several countries in the
world such as South Africa, Germany, Australia, Brazil, China, Spain, United States, Italy,
India, Japan, Mexico, United Kingdom, Sweden and others, not only in product
development, but also in developing manufacturing processes, software, services, etc. (Akao
& Mazur, 2003; Chan & Wu, 2002).
In the U.S., QFD has become known in 1983 after conducting a seminar on the subject in
Chicago. It was initially introduced in the 3M Corporation. Currently, the use of QFD in the
U.S. is in almost all industry sectors, particularly in the automotive, electronics, software
and services industry. It is also used by the space industry.
In 1996 a survey was conducted through a collaboration of Tamagawa University and the
University of Michigan on the applications of QFD in the U.S. and Japan. It was selected 400
companies from each country. 146 Japanese companies (37%) and 147 American (37.6%)
responded to the survey. According to the results, 31.5% of Japanese companies and 68.5%
of Americans use the QFD (Akao & Mazur, 2003).
Employment of the Quality Function
Deployment (QFD) Method in the Development of Food Products
445
In Europe, QFD is also well known and many application cases have been reported. In other
parts of the world, one can mention the innovative applications of QFD in Australia in the
area of strategic planning and development of new business or improving existing business
(Melo Filho & Cheng, 2007).
In emerging countries such as Brazil, QFD was introduced in 1989 and the concern now is
how to make the method more effective, better understood and applied (Akao & Ohfuji,
1989). In China, the Quality Bureau from the State Bureau of Technical Supervision, a
national agency of The People's Republic of China, has invited Professor Akao to give QFD
seminars in Peking and Shanghai since 1994. India has shown a strong interest in the
application of QFD, specially in software industry and in manufacturing industries such as
trucks, automobiles, and farm tractors (Akao & Mazur, 2003).
The true in general is that the QFD method has ensured the achievement of project quality
because it relays in one point that is the most cited by scholars of the subject as essential to
the success of the product: a focus on customer needs. In addition, assists in managing the
development process because it coordinates the flow of information and organizes activities
in a function level. Thus promoting cross-functional integration and quick problem solving.
4.1 Method’s approach
The QFD method, as it was originally designed by the professors Akao and Mizuno,
includes the deployment of information, called the Quality Deployment (QD) and displays
of work, addressed as Quality Function Deployment narrowly defined or restricted (QFDr).
In the first approach, QFD works detailing the necessary information to the innovation
process. For that, are used tables, matrices, and the conceptual model, called the basic units
of the QD. On the tables the data are organized, which in turn will be linked into the
matrices. The interaction between the matrices is shown in the conceptual model (Akao,
1996).
The beginning of the process of extracting information in the QFD always starts from a
table, so it is considered as the elementary unit of the method. It has the main purpose of
deploying the information, always starting from a more general level to a more concrete.
Using data from market research or internal information of the company, the work team
uses the tables to detail the information, which are then arranged so that they are grouped
according to their level of abstraction. Thus, the characteristics, requirements or functions
that aren’t so explicit, they become more clear for the working group.
The use of matrices in QFD aims to translate succinctly the relationship between two tables.
It is a way of storing information and at the same time, to visualize the degree of interaction
between each element of a table in relation to all the other elements of the other.
The conceptual model is the structure within the QFD that allows the visualization of the
path taken to deploy the information until they get the technical standard processes.
According to the sequence of matrices, it is able to verify a relation of cause and effect
between the characteristics of the final product, its components, their functions, costs, raw
materials and intermediate processes for their manufacture. Thus, it has been stored in a
visible and detailed way, all product design and process.
The second approach of the method refers to the deployment of the work (QFDr). The
technical and management procedures are established to ensure that all functions involved
in the activities have their tasks previously established. The QFDr aims to specify who will
do the job and how it will be done. Thus, from this deployment of the work it can be
Scientific, Health and Social Aspects of the Food Industry
446
generated a set of documents, such flowchart of product development and a plan to manage
the product development activities. The first determines the functional areas involved in
each stage of development and the procedures for carrying out the work. The second
specifies the schedule for each activity within the project.
4.2 Elaboration of the quality matrix of the final product
The Quality Matrix of the finished product is the first matrix that should be developed
within the QFD method. In it are contained all information relating to the finished product.
This topic displays an example of developing step-by-step from the quality matrix of a
functional ready to bake dough for pies (Pinto & Paiva, 2010). While the development of
other matrices of raw materials, intermediate products and processes are not treated in this
chapter, the understanding of this first matrix will benefit the reader to understand how the
matrices are made in the context of QFD.
4.2.1 Listing of primitive data
The primitive data are informations written in colloquial language, which can be collected
through interviews or questionnaires with consumers, through discussion with focus
groups or can be extracted from consumer complaints. They may also be got from opinions
of company employees and in the news world. When the consumer does not directly
express their needs, the imagination of scenes, or occasions of consumption, facilitates the
description of the item required.
To meet the needs of the target market related to the dough for pies, there was a market
research through semi-structured interviews with a sample of thirty possible consumers of
the product. In the interview it was assessed the characteristics that the interviewers hoped
to find in the ready dough for pies through the deployment of the scene in the manner,
place and circumstances under which they would like to consume the product.
With the primitive information obtained, it was listed the greatest possible number of
consumer desires. An example of this conversion is when an interviewee said that "the
dough for pie should be used for both pies – sweet and salty," and the translation of
primitive data for a required item was that “the dough for pie has to have a neutral flavor."
4.2.2 Establishment of the required qualities
At this stage you just have to format the primitive language, obtained from the market or
from the deployment of scenes, observing certain rules. It is important that the terms of the
customer requirements are simple, summarized in a single sentence, without explanation
and did not have double meaning, making sure that the desired quality is clear. Whenever
possible, you should be careful to avoid expressions in the form of denial, employing for
this, affirmatives expressions.
Then the customer requirement qualities must be arranged in a table, the table of required
qualities. This table is assembled from right to left. From the more concreted level to the
more abstract. Generally, for food products, the markets requirements are grouped in terms
of looks or appearance, flavor, texture, ease of preparation.
For the elaboration of the table it should be observe the following script: sentences with the
same content should be eliminated to avoid repetition. The sentences should be arranged so
that they can be viewed in only one frame (tertiary level, Table 1). It must then be joined in
Employment of the Quality Function
Deployment (QFD) Method in the Development of Food Products
447
groups of four or five sentences with similar content and add expressions of customer
requirements that represents the groups formed (secondary level, Table 1). With the phrases of
similar content from the previous procedure must be formed other groups and add
expressions of customer requirements to represent the groups formed (primary level, Table 1).
Primary Level Secondary Level Tertiary Level
Looks nice
Nice texture
Being soft
Being crunchy
Being a dough that dissolves easily in the
mouth
Nice color Have a color next to cream/beige
Appealing aspect
Have an uniform size
Have an uniform thickness
Being tasty
Pleasant aroma Have an appetizing aroma
Pleasant flavor Have a neutral taste
Satisfaction of the
preparation
Being fully Being fully
Being safe Being safe Being safe
Being healthy Being healthy
Being functional
Have a padronized caloric value
Table 1. Customer requirements to the functional dough for pies.
In the example of the functional dough for pies, it was constructed a table of deployment of
the required qualities mainly from the joining of different sensory aspects of the product
(Table 1).
4.2.3 Establishment of the quality characteristics
From the customer requirement of the tertiary level, must be extracted the technical
characteristics of the finished product. At this point you have to convert the world of market
into the technological world, drawing as much as possible, technical characteristics that will
be easy to be measured. To do this, you should use the following reasoning: "How the
required quality could be assessed in the final product?"
Then the table of quality characteristics should be built the same way as the table of the
required qualities was. It should be built in groups thinking in the objectives of
measurement or types of analysis to be carried out in the final product. For example, in the
case of food products, in physico-chemical, microbiological and sensory analysis (Table 2).
Scientific, Health and Social Aspects of the Food Industry
448
Primary Level Secondary Level Tertiary Level
Physico-chemical
characteristics
Physico-chemical characteristics
(cold dough)
Thickness of the dough for pie
Diameter of the dough for pie
Ash content
Moisture of the dough for pie
Baking time
Fiber content
Carbohydrate content
Protein content
Fat content
Sensory
characteristics
Visual (baked dough)
Color
Integrity
Taste (baked dough)
Aroma
Neutral flavor
Soft texture
Crispness
“Hollow” texture
Microbiological
characteristics
Microbiological characteristics
(cold dough)
Coliforms at 45ºC
Salmonella sp/25g
B. cereus
Estafilococcus coagulase positive
Table 2. Table of quality characteristics of the dough for pies
4.2.4 Establishing the correlations in the quality matrix
In the central part of the matrix it’s necessary to make the correlation of each required
quality with each characteristic quality. To this must be observed the following rules:
1. Judge each relationship independently.
2. Assign symbols for each correlation which correspond to numeric values. The meanings
can be:
or 9: Strong correlation;
or 6: There is a correlation;
or 3: Possible correlation
3. For each required quality should be at least one strong correlation.
4. The symbols can not be concentrated in one place only.
Employment of the Quality Function
Deployment (QFD) Method in the Development of Food Products
449
5. There should not be an item excessively marked with symbols.
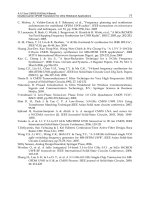
With this information it was possible to build the quality matrix of a functional ready to
bake dough for pies (Picture 2). There was done a correlation between these required
qualities by the market and the quality characteristics of the finished product, assigning
values 3, 6 or 9.
4.2.5 Establishment of the planned quality
The first column of the planned quality is the degree of importance. This must be
established by the survey with consumers of the target market. When the survey is done, it
is necessary to launch the averages values obtained in the matrix.
In the example of the functional dough for pies, the degree of importance of the required
qualities has been established through research with thirty-two prospective buyers, where
the interviewed indicates how important each characteristic was on a scale from 1
(unimportant) to 5 (very important). The medians for each attribute were also launched into
the matrix.
After the development of the prototypes in industrial kitchens or in a pilot plant, it should
be performed a search for sensory analysis with a sample of the target market. For this,
should perform an affective sensory test with samples of one or more developed prototypes
and a competitor's product, if any.
In the survey of the sensory analysis can be used items of the second level of the table of
deployment of required qualities. Based on the type of scale used in the sensory test, it
should be launched into the matrix the averages or medians of the results of sensory
analysis.
In the case of the functional dough for pies, for the sensory analysis of the products
developed, it was used the test of acceptance by the hedonic scale, varying gradually from 1
to 9, based on attributes like or dislike. Fifty tasters commented on all the attributes initially
listed as important to the market. The medians of the attributes evaluated in the sensory
analysis of the product developed were included in the matrix (Picutre 2). To compare the
performance of the products developed for each required quality, we used nonparametric
statistical test of Mann & Whitney (Siegel & Castellan, 2006) in order to distinguish the
preferred.
Then you must define, through consensus among the development team, the column called
planned quality, taking into account the degree of importance and the performance of the
company and competitors. See the example in Picture 2.
The rate of improvement is established through the ratio between each value of planned
quality by the performance of the product in the sensory analysis. Then it should be to
establish which required qualities are considered strong, medium or weak selling points,
i.e., which attributes will be attractive to the market, which items are attractive to the
consumers in an average way and which attributes are obvious or mandatory to the
product. In the column of the selling point, items considered to be attractive to the market
receiving the note 1.5, intermediate items, the value 1.2 and those considered obvious, is
assigned the value 1.0.
To calculate the absolute weight, multiply the degree of importance by the rate of
improvement and also by the selling point. The relative weight of each required quality is
the corresponding percentage of the absolute weight.
Scientific, Health and Social Aspects of the Food Industry
450
Fig. 2. Quality Matrix of a functional ready to bake dough for pies
Employment of the Quality Function
Deployment (QFD) Method in the Development of Food Products
451
4.2.6 Establishment of the designed quality
Now, it should be calculated the absolute weight of the quality characteristics at the bottom
of the quality matrix. To do this, multiply the relative weight of each required quality by the
numerical values of correlations, and add up these products vertically. The relative weight
of each quality characteristic is the corresponding percentage of the absolute weight. For
example, in Picutre 2, the absolute weight of 46.3 of the quality characteristic "dough
thickness" was calculated by multiplying (7.1 x3) + (8.3 x 3) + (7.9 x9).
In the case of the functional dough for pies, were established physico-chemical,
microbiological and sensory specifications for each quality characteristic of the finished
product. The physico-chemical specifications were obtained by laboratory tests. The
microbiological standards have been established according to the Brazilian law and the
sensorial by a trained sensorial team.
5. Overview of the application of QFD in food products
QFD has been used in the food industry since 1987, i.e., its use is recent (Costa et al., 2001).
But only after the 90’s is that the articles were published showing the benefits of using the
method in food products (Benner et al., 2003).
According to Souza Filho and Nantes (2004), the literature has dealt with much more
organizational benefits and potential for improving the technical quality than the
implementation process of QFD. Few articles describe how QFD has been used in real
products and discuss their own experiences. Thus there isn’t a deeper theoretical in the
application of this method. To Charteris (1993) and Govers (1996), the strategic importance
of QFD to contribute to the competitive advantage of firms may explain the reluctance of
companies to share such important information on QFD.
Importantly, too, that one factor, perhaps one of the main, is the difficulty of finding
scientific study of the application of QFD into the food industry, is due to the reliance on
specific sensory attributes of each product. QFD was originally developed for the
development of boats, automobiles and automobiles pieces. The technical characteristics
related to this type of product are characteristics that have defined shapes and dimensions,
specifications and parameters that can be measured accurately. However, the area of food
has a different characteristic; the food may have different perceptions of consumer to
consumer. Sensory perceptions are intrinsic to every human being and despite the food
being technical specifications, mainly physico-chemical and microbiological parameters, the
sensory perceptions are very difficult to specify. Allied to this, food ingredients have slightly
larger deviations than pieces of heavy industry and those may change due to interactions
between them or due to the process applied (Favaretto, 2007). Thus, the technicians of the
food industry wishing to use the QFD tool must idealize the necessary changes in the
method so that it becomes applicable in the development of a food product. It is important
that simplifications are made to the product, its ingredients and their interactions so that the
matrices can be used without any difficulty.
Cheng & Melo Filho (2010), in a survey on the contour and depth of application of QFD in
the 500 largest Brazilian companies, came to the conclusion that is recent the introduction of
the method in those companies and that is still a long way to go and a need for greater
understanding and support of top management in the implementation of this method by
companies.
Although the use of QFD is recent, some companies, however, begin to realize the
advantages of their use and are already getting great results with the implementation of the
Scientific, Health and Social Aspects of the Food Industry
452
method. Table 3 presents some applications of QFD in food product development in the last
12 years.
Authors Applications of QFD Results of the use of QFD
Antoni (1999) Turkey dry
fermented sausage
Easy understanding of the real needs to
be addressed in the product.
Interpretation of the first Quality Matrix
as the voice of the customer divided into
two parts: final consumer requirements
and demands of the point of sale,
unfolding them into the final product
characteristics. Correlation between the
raw material characteristics and the final
product characteristics.
Viaene &
Januszewska (1999)
Chocolate couverture Approximation of the areas of
Marketing and of Food Science and
Technology, reduction of the final cost
and increase of the success potential in
launching the new product due to the
participation of
the consumers belonging to this target
segment into the process.
Tumulero et al.
(2000)
Salty crackers Product improvement, sales
increase and expansion of market share.
Marcos (2001);
Marcos & Jorge
(2002)
Table Tomato Higher interaction of functional areas
involved in the development process
and establishment of sales strategies
based on the analysis of the consumer
market. Reduction of losses.
Chaves (2002) Yogurt Identification of the most important
aspects from the standpoint of quality.
Translation of the needs and desires of
customers and structural changes to
meet the expectations of a specific
market.
Magalhães (2002) Packaged
pasteurized milk
Increase on the sales of the product
Stewart-Knox &
Mitchell (2003)
Food products with
reduced fat
Market identification, consumer
awareness and participation of
suppliers.
Table 3. Applications of QFD in food product development
Employment of the Quality Function
Deployment (QFD) Method in the Development of Food Products
453
Authors Applications of QFD Results of the use of QFD
Cortés & Da Silva
(2005)
Yogurt Translation of customer requirements
and restructuring of the product
according to market expectations.
Commitment of all members of the
company.
Gonçalves & Silva
(2005)
Production of meals:
integration of QFD x
APPCC
Identification of the potential dangers
of contamination in the generic process
to produce meals. Verification of the
phases of meals production that require
greater attention from staff. The results
of the items prioritized in the matrix
served as an aid in the selection and
training process of employees.
Waisarayutt &
Tutiyapak (2006)
Instant rice noodles Based on customer requirements,
determination of the most important
technical specifications of the product
and the important parameters of the
process. Development of control plans
in accordance with the process
parameters.
Delgado & Pedrozo
(2007)
Micro food company
in Peru, “Delicias del
Sur”.
Identification of customer needs and
competitors' actions. Development of
new food products based on
differentiation through the
incorporation of raw materials and
inputs from local resources of
functional character. Strengthening
relationships in the areas of the
organization.
Favaretto (2007) Soft drink Decrease in the time of product
development, quality assurance of
product and service offered to the
customers. Culture change in the
organization.
Ferreira & Miyaoka
(2007)
Sweet Milk based on
soy
Identification of real needs and desires
of the audience. Serving an attractive
niche market, who are lactose
intolerant, vegetarians and people
seeking a healthier diet. Improved
quality and cost reduction.
Table 3. (continued): Applications of QFD in food product development
Scientific, Health and Social Aspects of the Food Industry
454
Authors Applications of QFD Results of the use of QFD
Matsunaga (2007) Breaded chicken Identification of the attributes most
valued by consumers. Higher
interaction between research and
product development area and
marketing area.
Miguel et al., (2007) Consumer profile of
pineapple "Pérola"
Identification of critical quality
attributes at the purchase time,
establishment of the degree of
importance of each attribute required
by the market and interpretation of
sensory analysis. Identification of
points to be improved within the
supply chain, minimizing losses and
maintaining and improving the quality
of the final product.
Anzanello et al., (2009)
Christmas turkey Identification of the process
parameters, product and resources to
be prioritized in the adoption of
improvements. Identification of
resources seen as bottlenecks to meet
the demands prioritized in QFD. Global
view while driving improvements in
products.
Cheng & Melo Filho
(2010)
Noble products with
embedded (ready
dishes like ham
lasagna)
Anticipating the possible changes of
habits and attitudes, adding value to
the product.
Garcia (2010) Fluid milk Disclosure of the characteristics to be
worked in order to improve product
quality.
Kawai (2010) Table tomato Identification of the required
characteristics by consumers and the
establishment of a competitor that has
the largest market share. Reduce losses
and increase the income of the
producer. Improved communication
between sectors.
Pinto & Paiva (2010) Functional dough
ready for pies
Identification of the characteristics that
consumers attach as of greater
importance and prioritization those
into the product development.
Table 3. (continued): Applications of QFD in food product development
Employment of the Quality Function
Deployment (QFD) Method in the Development of Food Products
455
Authors Applications of QFD Results of the use of QFD
Rodrigues (2010) Improving food
services at the
Universidade
Estadual de
Campinas (Unicamp)
Identification of the quality
characteristics most important and
which should be tailored to the
improvement of food service
establishments of Unicamp. Improved
workflow and execution of solutions
more quickly and affordably.
Vatthanakul et al.,
(2010)
Product of gold
kiwifruit leather
Defining the importance of the various
sensory characteristics for the design of
new products.
Zarei et al., (2011) Canning industry Identification of enablers of Lean
Manufacturing viable to be
implemented in practice in order to
increase the lean production of food
supply chain.
Table 3. (continued): Applications of QFD in food product development
Based on the work presented, it is emphasized that QFD enables the company to develop
products that meet the diverse and growing demands of its customers, serving different
market niches, in a short time, and is characterized by the efficiency in storage and
transmission of information during the multifunctional product development activity. In
addition, the use of the method QFD in several companies have pointed out others
advantages as: resolving problems, reducing the development time and using of prototypes
in a more objective way. The QFD is effective in order to direct, in a practice way, how to
plan and conduct activities necessary to the process of the product development.
6. Sensory analysis and support tools to market research
The application of QFD in the food industry is complex and the literature does not allow
establishing its full application in the development of these products. For this reason,
adaptations that take into account the characteristics of the product "food" are necessary for
the successful implementation of QFD in this industry. The adjustments should pursue a
better integration of aspects of market research with the sensory evaluation of food, aiming
to reveal the perception of consumers in a jointful way, in relation to the general market
attributes (shape, size, ease of use, etc.) and to the sensory attributes that make them decide
to accept and purchase of food. The integration of these aspects should also consider the
current model of food consumption in the region and the market segment defined for the
product.
In developing a new product is essential to optimize parameters such as shape, color,
appearance, odor, flavor, texture, consistency and the interaction of different components, in
order to achieve a full balance that translates into an excellent quality and have good
acceptability. Thus, according to Monteleone and colleagues (1997), studying the
relationships between the sensory attributes and the acceptance of a product can be very
useful to formulate or improve a product, as well as to evaluate potential market
opportunities. Understanding what drives the acceptance of a product is very important in
light of a competitive market like nowadays. Meeting the most valued attributes makes
Scientific, Health and Social Aspects of the Food Industry
456
more oriented the product development, benefiting not only the area of research and
product development, as well as marketing, reducing distances between these two areas. In
this sense, the methods of sensory evaluation of foods and evaluation of consumer desires
can be an aid when applied the method QFD into the food product development.
In sensory analysis the differences between products (discriminatory tests), the intensity of a
sensory attribute of quality (descriptive tests), or the degree of acceptance, preference or
rejection for a product (affective tests) are measured by human senses. However, it is
necessary to consider that the sensory perceptions can not be measured directly. Therefore
to assess the individual stimulation received in the sensory evaluation is used scales that
allow the quantification of them, as the specific objective of the evaluation (Bech et al. 1994;
Chaves & Sproesser, 1996; Ferreira et al. 2000).
In acceptance tests, the hedonic scale is the most used and widespread. It is a structured
scale, with nine sentences, balanced, considered easy to use and to understand (says the
pleasant and unpleasant states in the body). The evaluation of the hedonic scale is converted
into numerical scores, and statistically analyzed to determine the difference in the degree of
preference between samples (ABNT, 1998, IFT, 1981; Land & Shepherd, 1988). Optionally
you can use the hybrid hedonic scale, a continuous scale of 10cm, and with the advantages
to meet the assumptions of the models of analysis of variance (ANOVA) as the normality of
the residuals and homoscedasticity, and increase the discrimination between the samples.
The traditional methodologies for analyzing the affective tests data, like the ANOVA, used
to compare more than two averages in the study, and the averages test, to determine the
significance to a particular level of confidence, have shown limitations and shortcomings.
For each product evaluated is obtained the average of the consumer´s group, assuming
therefore that all respondents have the same behavior, ignoring their individuality. Thus,
there may be occurring loss of important information about different market segments
(Meilgaard et al. 2006; Polignano et al., 1999, Reis & Minim, 2006).
In order to analyze the affective data, taking into account the individual response of each
consumer and not just the average of the consumer group that evaluated the products, it
was developed a technique called Preference Mapping, which has been widely used by
scientists of the area of sensory analysis (Behrens et al., 1999). This technique is often
employed to identify groups of consumers who respond uniformly and that differ from
other groups by age, sex, attitude, need, eating habits and/or responses to the product´s
attributes. This gives the opportunity to interpretate the different areas of action of the
market (Polignano, 2000, Westad et al., 2004).
As it can explain better the consumer preference for each attribute, the Preference Mapping
is an interesting tool to collect the real needs of customers and turn them into project
qualities. It can be very useful during the development of food products, particularly in the
construction phase of the Designed Quality of the Quality Matrix (Polignano, 2000).
Cluster analysis is a set of statistical techniques whose objective is to seek a classification
according to the natural relations that the sample shows, forming groups of objects
(individuals, companies, cities or other experimental unit) according to the similarity in
relation to some predetermined criteria, thus reducing the dimensionality of the data.
According to Hair et al. (1998), the groupings (or clusters) resultants should have a high
internal homogeneity (within groups) and high external heterogeneity (between groups).
Cluster analysis is useful in developing new products to meet consumer profiles. This can
identify the profile of each group (age, marital status, psychological characteristics, etc.) that
Employment of the Quality Function
Deployment (QFD) Method in the Development of Food Products
457
will define whether there are different demands (market segmentation). The profile is
defined by the characteristics that make up the cluster, based on the concept of similarity.
In addition to these approaches, there is the publication of articles dealing with the use of
Conjoint Analysis in the food industry. The Conjoint Analysis is a technique that allow to
study the combined effect exerted by two or more independent variables on a dependent
variable (Carneiro et al., 2003). Based on a decomposition analysis, the Conjoint Analysis
determines the contribution of the studied factor levels expressed in samples or
combinations of the consumer response (acceptance, preference or purchase intent). It is an
analysis technique that can be used to identify the attributes/levels that most influence the
selection, purchase and acceptance of products, after the sensory evaluation of them.
The Conjoint Analysis has been widely applied in the development of new products in all
industrial sectors, in particular in the establishment of concepts, competitive analysis,
selection of target market segment, the definition of price and advertising strategy
(Drummond, 1998).
Another tool that has been used is the Repertory Grid. Kelly presented it in 1955, which
advocates the theory that people act as scientists evaluating the world around them, creating
hypotheses and establishing descriptors of what it is seen. The Repertory Grid method is a
term used to describe a set of techniques related to the Kelly’s theory (1955), which can be
used to investigate the individual definitions in the perception of characteristics of his
surroundings. This method is very flexible and allows it to be applied according to the
researcher's interest (Mac Fie & Thomson, 1994).
A descriptor is defined as the way in which two items are similar and, in some way,
different from a third party. In the sensory field, the samples are arranged in triads. In each
set, two samples are kept together and one away from the taster and it describes how the
samples are alike and how different. In addition to identifying the differences, the tasters
should also describe the extremes of each descriptor raised, in order to build a scale so that
samples can be quantified. The data collected are analyzed by GPA (Generalized Procrustes
Analysis), which allow to be established a configuration with the main and common
descriptors to the tasters. This is a multivariate analysis, that establish the consensus map of
the data (Mac Fie & Thomson, 1994).
Another method that helps to identify the product perception by the consumer is called
Focus Group. Focus Group can be defined as a planned session to obtain individual
perceptions of such a product or service, in a peaceful environment, through the moderation
of groups formed by six to nine people (Macfie & Thomson, 1994) or eight to twelve people
(Fuller , 2011). It is a qualitative technique of group discussion, which allows interaction
between people. The moderator leads the discussion to the topics of interest, listening to
people, without interfering directly. This technique allows to raise the participants'
perceptions about the subject matter. According to Fuller (2011), the main function of the
Focus Group is to determine consumer reaction to the objects of study.
The Kano method has as it´s main goal to evaluate the influence of components of products
in consumer satisfaction (Sauerwein et al., 1996). This method aims to rank the attributes in
four characteristics groups according to the degree of care and satisfaction: indifferent
(characteristics that do not affect consumer satisfaction), expected (mandatory
characteristics), proportional (characteristics that customer satisfaction is proportional to the
degree of care) and attractive (characteristics that customer satisfaction does not diminish if
not offered, but increases if met) (Fonseca, 2002).
Scientific, Health and Social Aspects of the Food Industry
458
Using this model it is possible to improve the process of understanding the requirements
from a classification that can help prioritize development resources. The identification of
mandatory requirements for certain attributes and opportunities of future innovation, which
customers have not even being classified as needs now, allowing the development and the
use of criteria in a more efficient way for resource allocation. The process of translating
requirements into product characteristics or services should also benefit from the
information obtained using the Kano model (Guimarães, 2003).
Kano helps in the process of product development, prioritizing the characteristics that
really have an impact on customer satisfaction. Beyond that, this may be very well
combined with QFD, identifying the relative importance of the needs raised by
consumers, contributing to the product development more focused and better targeted to
the audience. The classification of characteristics can also be a guideline to define the
attributes to be worked out for different market segments, creating product differentiation
in that market.
7. Conclusion
The effective development of products has become the competitive advantage for many
companies, especially in the food industry. For that, as shown in this chapter, projects must
achieve the best levels of quality, of efficiency and speed in the elaboration of products.
Certainly this requires an organizational effort of the entire company. What the firm plans,
i.e., its development strategy, and how the company makes its planning – its development
management - will determine the expressiveness of the product in the market. In this sense,
it can be affirmed that the competitive advantage of these organizations is based on the
capacity of its technical staff, in the procedures and organizational structure, in the
strategies established to guide the process, in the methods used, in the way that the top
management interacts with the process and yet, in the organization of the team according to
the level of complexity of the project.
The QFD method as pointed out in this work is not a mechanism that addresses all of the
aspects above, important for structuring the system of product development. However, by
offering a way to treat the necessary information to the process and to plan the activities, the
method has boosted the development system in several companies.
Ultimately, it is worth noting that, specifically for the food industry, some aspects can
enhance the use of the method. Among them those can be mention:
Existence of a support infrastructure to the process, with sufficiently equipped laboratories
and trained personnel to conduct the analysis.
The intrinsic quality of food products can be evaluated by physico-chemical, microbiological
and sensory analyses. Thus, the values of the quality characteristics during construction of
the matrices are determined by such methods. Various techniques of sensory analysis assist
in analyzing and gathering market information and then building a quality matrix, as
reported in this chapter.
Likewise, the pilot plants and experimental kitchens within companies, contribute greatly to
the development of prototypes and conduction of activities in a more quickly way.
Knowledge and application of various statistical techniques in the process of product
development.
Employment of the Quality Function
Deployment (QFD) Method in the Development of Food Products
459
Such techniques facilitate the identification of opportunities and strategic positioning of
products, the identification of factors that affect customer preference and the market
segmentation, supporting the use of the QFD method.
Assurance system of the consolidated quality
The consolidated quality management benefits directly the development process, as it aims
to optimize the exchange of information, the commitment of the people involved in the
activities, the specification of process parameters and the standardization of this procedures,
as well, developing products with little variability. Certainly, these factors create a safer
environment for the conduct of projects, facilitating, in particular, the specification of
product technical parameters, of raw materials, packaging and of the manufacturing
process.
8. References
ABNT (1998). Associação Brasileira de Normas Técnicas. NBR 14141: escalas utilizadas em
análise sensorial de alimentos e bebidas. Rio de Janeiro, 1998.
Akao, Y. & Mazur, G. (2003).The leading edge in QFD: past, present and future. International
Journal of Quality & Reliability Management. Vol. 20, No.1, pp. 20-35, ISSN 0265-671X.
Akao, Y. & Ohfuji, T. (1989). Recent aspects of Quality Function Deployment in service
industries in Japan. Proceedings of the International Conference on Quality Control,
ISBN 0-915299-41-0 3, Rio de Janeiro, 1989.
Antoni, I. (1999). Desenvolvimento de um Embutido Fermentado de Carne de Peru pelo Método do
Desdobramento da Qualidade. 136 p. Dissertação (Mestrado em Tecnologia de
Alimentos). Faculdade de Engenharia de Alimentos, Universidade Estadual de
Campinas (Unicamp), Campinas.
Anzanello, M.; Lemos, F. & Encheveste, M. (2009). Aprimorando Produtos Orientados ao
Consumidor Utilizando Desdobramento da Função Qualidade (QFD) e Previsão de
Demanda. Produto & Produção, Vol. 10, No. 2, jun., 2009, pp. 01 – 27, ISSN 1516-3660.
Athayde, A. (1999). Indústrias agregam conveniências aos novos produtos. Engenharia de
Alimentos, São Paulo, Vol. 24, 1999, pp. 39-41.
Bech, A.; Engelund, E.; Juhl, J.; Kristensen, K. & Poulsen, C. (1994). QFood—optimal design of
food products. MAPP working Paper no.19. MAPP Centre, Aarhus. March, 1994; pp.
2-12; ISSN 09072101.
Behrens, J.; Silva, M. & Wakeling, I. (1999). Avaliação da aceitação de vinhos brancos
varietais brasileiros através de testes sensoriais afetivos e técnica multivariada de
mapa de preferência interno. Revista da Sociedade Brasileira de Ciência e Tecnologia de
Alimentos, Campinas, Vol. 19, No. 2, May, 1999, ISSN 0101-2061.
Benner, M.; Linnemann, A.; Jongen, W. & Folstar, P. (2003). Quality function deployment
(QFD) – can it be used to develop food products?, Food Quality and Preference,
Netherlands, Vol. 14, pp. 327-339, ISSN 0950-3293.
Carneiro, J.; Silva, C.; Minim, V.; Regazzi, A.;Deliza, R. & Suda, I. (2003). Princípios básicos
da Conjoint Analysis em estudos do consumidor. Revista da Sociedade Brasileira de
Ciência e Tecnologia de Alimentos, Campinas, Vol. 37, No. supl, 2003, pp. 107-114,
ISSN 0101-2061.
Chan, L. & Wu, M. (2002). Quality function deployment: a literature review. European Journal
of Operational Research, Vol. 143, 2002, pp. 463-497, ISSN 0377-2217.
Scientific, Health and Social Aspects of the Food Industry
460
Charteris, W. (1993). Quality function deployment: a quality engineering technology for the
food industry. Journal of the Society of Dairy Technology, Vol.46, No 1, 1993, February,
1993, pp. 12–21, ISSN 0037-9840.
Chaves, J. & Sproesser, R. (1996) Práticas de laboratório de análise sensorial de alimentos e bebidas.
Publisher: UFV, Viçosa, Brazil.
Chaves, O. (2002). Aplicação do método de desdobramento da função qualidade na industrialização
do leite de consumo em Minas Gerais. 86 p. Dissertação (Mestrado em Economia
Rural). Departamento de Economia Rural, Universidade Federal de Viçosa, Viçosa.
Cheng, L. & Melo Filho, L. (2010). QFD: desdobramento da função qualidade na gestão de
desenvolvimento de produtos. (2 ed). Publisher: Blucher, ISBN 9788521205418, São Paulo.
Clark, K. & Wheelwright. S. (1993). Managing new product and process development. Free Press,
ISBN 0-02-905517-2, New York.
Cooper, R. (2001). Winning at new products. Accelerating the process from idea to lanch. (3ªed),
Publisher: Basic Books. Cambridge, Massachusetts. ISBN 0738204633.
Cortés, D. & Da Silva, C. (2005). Revisão: Desdobramento da Função Qualidade – QFD –
conceitos e aplicações na indústria de alimentos. Brazilian Journal Food Technology,
Vol. 8, No. 3, 2005, pp. 200-209, ISSN 1517-7645.
Costa, A.; Dekker, M. & Jongen, W. (2001). Quality function deployment in the food
industry: a review. Trends in Food Science and Technology, Vol.11, No. 9–10, 2001, pp.
306–314, ISSN 0924-2244.
Delgado, G. & Pedrozo, E. (2007). Inovação de Produtos Alimentícios: Alimentos funcionais
a partir de produtos locais. Proceedings of IV Convibra: Brazilian Administration
Virtual Congress, São Paulo/SP. Brazil, dez., 2007.
Drumond, F. (1998). Ténicas Estastísticas para o Planejamento do Produto. Fundação Christiano
Ottoni, Belo Horizonte.
Earle, M. (1997). Changes in the food product development process. Trends in Food Science &
Technology, Vol. 8, 1997, pp. 19-24, ISSN 0924-2244.
Favaretto, R. (2007). Modelo de aplicação de QFD no desenvolvimento de Bebidas. 96 p.
Dissertação (Mestrado em Profissional em Engenharia Mecânica) – Faculdade de
Engenharia Mecânica, Universidade Estadual de Campinas (Unicamp), Campinas.
Ferreira, G. & Miyaoka, A. (2007). Estratégias de desenvolvimento do doce de leite à base de soja.
30 p. Monografia (Graduação no Curso de Engenharia de Produção). Engenharia
de Produção da Universidade Federal de Viçosa, Viçosa
Ferreira, V.; Almeida, T.; Pettinelli, M.; Silva, M.; Chaves, J. & Barbosa, E. (2000). Análise
sensorial: testes discriminativos e afetivos. Sociedade Brasileira de Ciência e Tecnologia
de Alimentos, Campinas.
Fonseca, M. (2002). Uma abordagem para a redução de custos no desenvolvimento de produtos
alimentícios. 82 p. Tese (Mestrado em Engenharia de Produção). Faculdade de
Engenharia de Produção, Universidade Federal do Rio de Janeiro, Rio de Janeiro.
Fuller, G. (2011). New food product development: from concept to marketplace. (3ed.), CRC Press,
ISBN 13:978-1-4398-1865-7, Florida.
Garcia, A. (2010). Uso do método DFQ (Desdobramento da Função Qualidade) para melhoria da
qualidade do leite fluido.
181 p. Tese (Doutorado em Tecnologia de Alimentos). Faculdade
de Engenharia de Alimentos, Universidade Estadual de Campinas, Campinas.
Gonçalves, T. & Silva, C. (2005). Proposta de utilização do quality function deployment
(QFD) no sistema de análise de pontos críticos de controle (APPCC) na produção
de refeições. Proceedings of XII SIMPEP, Bauru, SP, Brazil, Nov., 2005.
Employment of the Quality Function
Deployment (QFD) Method in the Development of Food Products
461
Govers, C. (1996). What and how about quality function deployment (QFD). International
Journal of Production Economics, New York, Vol.46-47, 1996, pp. 575-585, ISSN 0925-
5273.
Guimarães, L. (2003). QFD - Analisando seus aspectos culturais organizacionais. Revista
Qualidade, Vol., No. 128, Jan., 2003, pp.56-66.
Hair J.; Anderson, R.; Tatham, R. & Black, W (1998). Cluster analysis. In: Multivariate data
analysis. Hair, J, Black, B, Babin, B & Anderson, R (5.ed.), pp. 469-518, Prentice Hall,
Upper Saddle River.
IFT. (1981). Sensory Evaluation Division. Guidelines for the preparation and review of paper
reporting sensory evaluation date. Journal of Food Technology, Vol.35, No.4, 1981,
pp.16-17, ISSN 0022-1163.
Kawai, S. (2010). Desenvolvimento de Tomate de Mesa, com o uso do método QFD (Quality
Function Deployment), comercializado em um supermercado. 217 p. Tese (Doutorado em
Tecnologia Pós-Colheita). Faculdade de Engenharia Agrícola. Universidade
Estadual de Campinas, Campinas.
Macfie, H. & Thomson, D. (1994). Measurement of food preferences. (1ed.), Springer, ISBN
9780834216792, New York.
Magalhães, G. (2002). Incorporação da Qualidade Desejada pelos Consumidores ao Leite
Pasteurizado Utilizando o Desdobramento da Função Qualidade. 77 p. Dissertação
(Mestrado em Ciência e Tecnologia de Alimentos). Programa de Pós-Graduação em
Ciência e Tecnologia de Alimentos. Universidade Federal de Viçosa, Viçosa.
Marcos, S. & Jorge, J. (2002). Desenvolvimento de tomate de mesa, com o uso do método
QFD (Desdobramento da Função Qualidade), comercializado em um
supermercado. Horticultura Brasileira, Brasília, v. 20, n. 3, p. 490-496, setembro 2002.
Marcos, S. (2001) Desenvolvimento de tomate de mesa, com o uso do método QFD (Quality
Function Deployment), comercializado em um supermercado. 199 f. Tese (Doutorado em
Ciência de Alimentos). Faculdade de Ciência de Alimentos. Universidade Estadual
de Campinas, Campinas.
Matsunaga, P. (2007). Identificação de atributos sensoriais de pedaços empanados de frango mais
valorizados pelo consumidor. 121p. Dissertação (Mestre em Alimentos e Nutrição).
Faculdade de Engenharia de Alimentos. Universidade Estadual de Campinas,
Campinas.
Meilgaard, M.; Civille, G. & Carr, B. (2006). Sensory Evaluation Techniques, ( 4. ed.), FL: CRC
Press, ISBN 0849338395, Boca Raton.
Melo Filho, L. & Cheng, L. (2007). QFD na garantia da qualidade do produto durante seu
desenvolvimento: caso em uma empresa de materiais. Produção, Vol. 17, No.3,Dec.,
2007, . p. 604-624, ISSN 0103-6513.
Miguel, A.; Spoto, M.; Abrahão, C. & Silva P. (2007) Aplicação do método QFD na avaliação
do perfil do consumidor de abacaxi “Pérola”. Ciência e Agrotecnologia, Vol. 31, No. 2,
2007, pp. 563-569, ISSN 1413-7054.
Mizuno, S. (1969). Company-wide quality control activities in Japan. Reports of Statistical
Application Research, Vol.16, No.3, 1969, pp.68-77.
Monteleone, E.; Carlucci, A.; Caporale, G. & Pagliarini, E. (1997). Use of slope analysis to
characterize preference for virgin olive oil. Italian Journal of Food Service, Vol. 9, No.
2, 1997, pp. 133-140, ISSN 1120-1770.
Pinto, A. & Paiva, C. (2010). Developing a functional ready to bake dough for pies using the
Quality Function Deployment (QFD) method. Revista da Sociedade Brasileira de
Scientific, Health and Social Aspects of the Food Industry
462
Ciência e Tecnologia de Alimentos, Campinas, Vol.30, No.(Supl.1), mai., 2010, pp 36-
43, ISSN 0101-2061.
Polignano, L. (2000). Desenvolvimento de produtos alimentícios: implentação da ferramenta mapa
de refrência e estudo da sua articulação com a matriz da qualidade. 268 p. Dissertação
(Mestre em Engenharia de Produção). Escola de Engenharia. Universidade Feredal
de Minas Gerias, Minas Gerais.
Polignano, L.; Cheng, L. & Drumond, F. (1999). Utilização dos mapas de preferência como
técnicas auxiliares do QFD durante o desenvolvimento de produtos alimentícios.
Proceedings of I Brazilian Conference on Management of Product Development, Belo
Horizonte, Brazil, 1999.
Reis, C. & Minim, V. (2006) Testes de aceitação. In: Análise sensorial: estudos com
consumidores., Minim V., pp. 67-83, Publisher UFV, ISBN 85-7269-282-7, Viçosa,
Brazil.
Rodrigues, N. (2010). Aplicação da matriz da qualidade do QFD – Desdobramento Da Função
Qualidade – para avaliar serviços de alimentação do campus da Unicamp. 190 p. Tese
(Doutorado em Tecnologia Pós-Colheita). Faculdade de Engenharia Agrícola.
Universidade Estadual de Campinas, Campinas.
Sauerwein, E.; Bailom, F.; Matzler, K. & Hinterhuber, H. (1996). The Kano Model: how to
delight your consumers. Preprints of the IX International Working Seminar on
Production Economics, Innsbruck/Igls/Austria, February, 1996.
Siegel, S. & Castellan Jr, N. (2006). Estatística não-paramétrica para ciências do comportamento. (2
ed), Artmed, ISBN 85-363-0729-3, Porto Alegre.
Souza Filho, M. & Nantes, J. (2004). O QFD e a análise sensorial no desenvolvimento de
produtos. Proceedings of Production Engineering Symposium, Bauru, Nov., 2004.
Stewart-Knox, B. & Mitchell, P. (2003). What separates the winners from the losers in new
food product development? Trends in Food Science and Technology, Vol. 14, No.1–2,
2003, pp. 58–64, ISSN 0924-2244.
Tumelero, N.; Ribeiro, J. & Danilevicz, A. (2000). O QFD como ferramenta de priorização
para o planejamento da qualidade. Proceedings of Brazilian Conference on Management
of Product Development, São Carlos, Aug., 2000.
Vatthanakul, S.; Jangchud, A.; Jangchud, K.; Therdthai, N. & Wilkinson, B. (2010). Gold
kiwifruit leather product development using quality function deployment approach.
Food Quality and Preference, Vol.21, No.3, 2010, pp. 339–345, ISSN 0950-3293.
Viaene, J. & Januszewska, R. (1999). Quality function deployment in the chocolate industry.
Food Quality & Preference, Vol. 10, pp. 377–385. ISSN, 0950-3293.
Waisarayutt, C. & Tutiyap, O. (2006). Application of Quality Function Deployment in
Instant Rice Noodle Product Development. The Kasetsart Journal: Natural Sciences.
Vol.40 (Suppl.) 162-171 p.
Westad, F.; Hersleth, M. & Lea, P. (2004) Strategies for consumer segmentation with
applications on preference data. Food Quality and Preference, Vol. 15, No. 7-8 , 2004,
pp.681-687, ISSN 0950-3293.
Zarei, M.; Fakhrzad M. & Paghaleh, M. J. (2011). Food supply chain leanness using a
developed QFD model. Journal of Food Engineering, Vol. 102, pp. 25–33, ISSN 0260-
8774.
23
Quality Preservation and Cost Effectiveness in
the Extraction of Nutraceutically-Relevant
Fractions from Microbial and Vegetal Matrices
Marco Bravi
1
, Agnese Cicci
1
and Giuseppe Torzillo
2
1
Chimica Materiali Ambiente, Sapienza Università di Roma, Roma,
2
CNR Istituto per lo Studio degli Ecosistemi, Sesto Fiorentino,
Italy
1. Introduction
Terrestrial and microbial vegetal matrices are a major source of nutraceutically and
pharmaceutically relevant chemical compounds of different nature. In several cases the
consumption of the raw vegetal or microbial matrix has been part of established diet regimes
and has provided the consumers with a host of once unknown dietary benefits. Nowadays,
while the consumption of the raw matrix still provides the original functional value, the
separation of bioactive-enriched fractions has enabled the production of nutraceuticals, while
the addition of nutraceutical fractions to food previously lacking or partially possessing them
has lead to the industrial production of functionalised or fortified food respectively.
The separability of nutraceutically relevant fractions depends on the combination of several
different features of the carrier matrix and of the fraction to be separated, namely: size,
aggregation state and physical (hardness) and chemical (composition) features of the
embodying matrix, chemical nature, bonding and degree of dispersion of the fraction of
interest in the embodying matrix. Physical, chemical and electrostatic interactions between
the embodying matrix, the fractions to be separated and exogenous agents (equipment and
process auxiliary substances, and the environment) affect the desired separation; the
chemical nature of the solvent (if any), the specific energy applied by the physical agent (if
any), the frequency and intensity of the mechanical (e.g., ultrasound) and electromagnetic
(e.g., microwave) field (if any), the processing time and temperature and the presence of
specific case-by-case unwanted substances (e.g., water, oxygen, metal ions) play a role in the
final outcome of the recovery process of the desired fraction.
2. Sub- and supercritical fluid extraction
Sub- and supercritical fluid extraction are promising separation processes aimed at
replacing traditional lengthy, laborious, low selectivity and/or low extraction yield, toxic
chemical-using separation processes (Herrero et al., 2006).
The low viscosity and (relatively) high diffusivity inherent in the supercritical state confers
these solvents better transport properties than liquids solvents have. Furthermore, the
“adjustability” of viscosity, density and solvent power (Del Valle and Aguilera, 1999) by
acting on fluid density through the change of pressure and/or its temperature make them