Báo cáo hóa học: "Research Article Combining Low-Level Features for Semantic Extraction in Image Retrieval" pptx
Bạn đang xem bản rút gọn của tài liệu. Xem và tải ngay bản đầy đủ của tài liệu tại đây (5.56 MB, 12 trang )
Hindawi Publishing Corporation
EURASIP Journal on Advances in Signal Processing
Volume 2007, Article ID 61423, 12 pages
doi:10.1155/2007/61423
Research Article
Combining Low-Level Features for Semantic
Extraction in Image Retrieval
Q. Zhang and E. Izquierdo
Multimedia and Vision Laboratory, Electronic Engineering Department, Queen Mary University of London, London E14NS, UK
Received 9 September 2006; Revised 28 February 2007; Accepted 16 April 2007
Recommended by Hyoung Joong Kim
An object-oriented approach for semantic-based image retrieval is presented. The goal is to identify key patterns of specific objects
in the training data and to use them as object signature. Two important aspects of semantic-based image retrieval are considered:
retrieval of images containing a given semantic concept and fusion of different low-level features. The proposed approach splits the
image into elementary image blocks to obtain block regions close in shape to the objects of interest. A multiobjective optimization
technique is used to find a suitable multidescriptor space in which several low-level image primitives can be fused. The visual
primitives are combined according to a concept-specific metric, which is learned from representative blocks or training data.
The optimal linear combination of single descriptor metrics is estimated by applying the Pareto archived evolution strategy. An
empirical assessment of the proposed technique was conducted to validate its performance with natural images.
Copyright © 2007 Q. Zhang and E. Izquierdo. This is an open access article distributed under the Creative Commons Attribution
License, which permits unrestricted use, distribution, and reproduction in any medium, provided the original work is properly
cited.
1. INTRODUCTION
The problem of retrieving and recognizing patterns in images
has been investigated for several decades by the image pro-
cessing and computer vision research communities. Learn-
ing approaches, such as neural networks, kernel machines,
statistical, and probabilistic classifiers, can be trained to ob-
tain satisfactory results for very specific applications [1–3].
Unfortunately, fully automatic image recognition using high-
level semantic concepts is still an unfeasible task. Though
low-level feature extraction algorithms are well understood
and able to capture subtle differences between colors, statis-
tic and deterministic textures, global color layouts, dominant
color distributions, and so forth, the link between such low-
level primitives and high-level semantic concepts remains an
open problem. This problem is referred to as “the semantic
gap.” To narrow this gap is a challenge that has captured the
attention of researchers in computer vision, pattern recog-
nition, image processing, and other related fields, evidencing
the difficulty and importance of such technology and the fact
that the problem remains unsolved [4, 5].
In this paper, an object-oriented approach for semantic-
based image retrieval is presented. Two important aspects of
semantic-based image annotation and retrieval are consid-
ered: retrieval of images containing a given semantic con-
cept and fusion of different low-level features. The first as-
pect relates to the fact that in most cases users are interested
in finding single objects rather than whole scene depicted in
an image. Indeed, when watching images, human beings tend
to look for single semantical meaningful objects and uncon-
sciously filter out surrounding elements and other objects in
complex scenes. The second aspect, that is, the joint exploita-
tion of different low-level image descriptions is motivated by
the fact that single low-level descriptors are not suitable for
interpreting human understanding into visual description by
machines. Combining them in a concept-specific manner
may help to solve the problem, but different visual features
and their similarity measures are not designed to be com-
bined naturally in a meaningful way. Thus, questions related
to the definition of a metric joining several similarity func-
tions require careful consideration. The low-level descriptors
usedinthisworkarebasedonspecificanddifferent visual
cues representing various aspects of the content. The aim
is to learn associations between complex combinations of
low-level descriptions and semantic concepts. It is expected
that low-level visual primitives complement each other and
jointly build a multidescriptor that can represent the under-
lying visual context in a semantic way.
Alargenumberofdifferent features can be used to ob-
tain content representations that could potentially capture
2 EURASIP Journal on Advances in Signal Processing
or describe semantic objects in images. The difficulty of the
problem arises from the different nature of the features used
as described in [6, 7]. Different features are extracted using
different algorithms and the corresponding descriptors have
individually specific syntaxes. The unavoidable effect is that
different descriptors “live” in different feature spaces with
their own metrics and statistical behavior. As a consequence,
they cannot be naturally mixed to convey semantic mean-
ings. Therefore, finding the right mixture of low-level fea-
tures and their corresponding metrics is important to bridge
the semantic gap. The idea of combining descriptors and
their metrics in an effort to represent semantic concepts has
been addressed for years in pattern recognition. In [8], se-
mantic objects in images were represented by weighted low-
level features. Weights were derived from standard deviation
over relevant examples. In [9], a similar approach with com-
bination of query point movement and weight update was
reported. Alternative many computer vision approaches were
based on local interest point detectors and descriptors invari-
ant to geometric and illumination variations [10]. In [11],
two combination mechanisms for MPEG-7 visual descrip-
tors were proposed: multiple feature direct combination and
multiple feature cascaded combination. They aimed at com-
bining the output of five different expert classifiers trained
using three different low-level features. In the system intro-
duced in [12], several low-level image primitives were com-
bined in a suitable multiple feature space modeled in a struc-
tured way. SVMs with an adaptive convolution kernel were
used to learn the structured multifeature space. However, this
approach suffers from an “averaging” effect in the structure
construction process so that no much reward is added to the
performance.
Contrasting these and other approaches from the liter-
ature, in this paper an object-oriented image retrieval ap-
proach based on image blocks is presented. The approach
is designed to exploit underlying low-level properties of el-
ementary image blocks that constitute objects of interest.
Images are divided into small blocks with potentially vari-
able sizes. The goal is to reduce the influence of noise com-
ing from the background and surrounding objects, in or-
der to identify a suitable mixture of low-level patterns that
bestrepresentagivensemanticobjectinanimage.Theap-
proach employs a multiobjective optimization (MOO) tech-
nique to find an optimal metric combining several low-level
image primitives in a suitable multidescriptor space [13]. Vi-
sual primitives are combined according to a concept-specific
metric, which is “learned” from some representative blocks.
The optimal linear combination of single metrics is estimated
by applying multiobjective optimization based on a Pareto
archived evolution strategy (PAES) [14].Thefinalgoalisto
identify key patterns common to all of the data samples rep-
resenting an average signature for the object of interest.
The paper is organized as follows. An overview of the
proposed approach and an outline of the framework are
given in Section 2. The proposed multiobjective optimiza-
tion approach for image retrieval and classification along
with related background introductions are presented in
Section 3. Selected experiment results from a very com-
prehensive empirical study for evaluation are reported in
Section 4. The paper closes with conclusions and future work
in Section 5.
2. AN OBJECT-BASED FRAMEWORK FOR
IMAGE RETRIEVAL
In most image retrieval scenarios, users’ attention focuses on
single objects. For that reason, in this work the emphasis is on
single objects rather than on the whole scene depicted in the
image. However, segmentation is not assumed, since we ar-
gue that segmenting an image into single semantically mean-
ingful objects is almost as challenging as the semantic gap
problem itself. To deal with objects, a very simple approach
is taken based on small image blocks of regular size called ele-
mentary building blocks of images. The proposed technique
was inspired by three simple observations: users are mostly
interested in finding objects in images and do not care about
the surroundings in picture; elementary building elements
are closer to low-level descriptions than whole scenes; objects
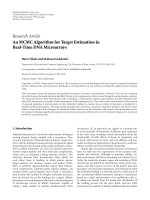
are made up of elementary building elements. In Figure 1,
an example is presented illustrating these observations. The
highlighted elementary blocks are clearly representatives of
the concepts “tiger,” “vegetation,” and “stone.” These blocks
are small enough to be contained in a single object and large
enough to convey information about the underlying seman-
tic object.
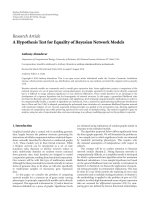
The proposed framework for object-based semantic im-
age retrieval is outlined in Figure 2 and consists of three main
processing stages: preprocessing, multidescriptor metric esti-
mation, and retrieval or classification.
2.1. Preprocessing
The preprocessing stage, as depicted in the left-side mod-
ule, is conducted offline and consists of four different steps.
Firstly, each image in the database is partitioned into a fixed
grid of x
× y blocks. The size of the grid is chosen adap-
tively according to the database to reduce the effect of scal-
ing in images of different sizes. Secondly, low-level features
are extracted automatically. Any set of low-level descriptors
and features can be used and combined in the proposed ap-
proach. In particular, seven visual primitives are used in this
paper to assess the performance of the proposed approach:
color layout (CLD), color structure (CSD), dominant color
(DCD), edge histogram (EHD), texture feature based on
Gabor filters (TGF), grey level cooccurrence matrix (GLC),
and hue-saturation- value (HSV). Observe that the first four
are MPEG-7 descriptors [6], while the other three are well-
established descriptors from the literature [15–17]. In the
third step, given a semantic concept, a set of representative
block samples are selected for training by professional users.
Here, the semantic concept or object is represented by a given
key word, for example, “tiger,” and the key word is linked
with the representative block set. It is assumed that this rep-
resentative set conveys the most important information on
the objects of concern. Besides, it is required that the rep-
resentative group encapsulates enough discriminating power
to filter the actual relevant blocks to the concept from noise
in unrelated blocks. Therefore, in this work, two classes of
Q. Zhang and E. Izquierdo 3
Tiger
Ve g e t a ti o n
Stone
Figure 1: Elementary building blocks in an image.
Preprocessing
stage
Centroid
calculation
Database of image
blocks
Constructing
distance matrix
+
−
Sample
selection
Retrieval or
classification
stage
Extraction of low-level
primitives
Overall database
PAES-
multidescriptor
metric
estimation
stage
Only training examples
Figure 2: Framework overview.
representative samples are selected. The first class contains
the most relevant samples for the semantic concept. They
are referred to as “positive samples.” The second class con-
tains “negative samples” which are irrelevant and have little
in common with the semantic concept. The combination of
both positive and negative samples builds the training set.
Once the training set is available, finally a centrod is cal-
culated for the positive training sets using each one of the
corresponding similarity measures of the considered feature
spaces. Thus, for L feature spaces, a total of L centroids are
calculated. The training set and its centroids are then used
for building a distance matrix for the optimization strategy
that will be further described in Section 3.
2.2. Multidescriptor metric estimation and
retrieval stages
After preprocessing, the underlying visual pattern of se-
mantic concepts in the multifeature space are learned us-
ing the selected training set. multiobjective optimization is
used to find a suitable metric in multifeature space. Specif-
ically, the Pareto archived evolution strategy is adopted to
solve the underlying optimization problem. The final stage is
the actual retrieval. Here, block-based retrieval using an op-
timized metric in multidescriptor space is performed. These
two processing steps build the backbone of the proposed ap-
proach and are elaborated in the next two sections.
4 EURASIP Journal on Advances in Signal Processing
3. A SIMILARITY MEASURE FOR IMAGE RETRIEVAL
USING MULTIOBJECTIVE OPTIMIZATION
In natural images, semantic concepts are complex and can be
better described using a mixture of single descriptors. How-
ever, low-level visual descriptors have nonlinear behaviors
and their direct combination may easily become meaning-
less. Among an infinite number of potential ways to combine
similarity functions from different feature spaces, the most
straightforward candidate for a distance measure in multi-
feature space is a linear combination of the distances defined
for single descriptors. Even in this case, it is difficult to esti-
mate the levels of importance for each feature in the under-
lying linear combination. The work described in this paper
focuses on obtaining an “optimal” metrics based on a lin-
ear combination of single metrics of descriptors in a multi-
feature space. It is an expanded work based on the authors’
previous paper [18]. To harmonize a diversity of characteris-
tics in low-level visual descriptors, a strategy similar to multi-
ple decision making is proposed. This kind of strategies aims
at optimizing multiple objectives simultaneously [13]. The
challenge here is to find suitable weights for combining sev-
eral descriptor metrics.
3.1. Build up the multifeature distance matrix
Let B
={b
(k)
| k = 1, , K} be the training set of elemen-
tary building blocks selected in the preprocessing stage. Here,
K is the number of training blocks. B is directly linked to a
given semantic concept or key word. Clearly, for each new se-
mantic concept a new training set needs to be selected by an
expert user or annotator. For each low-level descriptor, a cen-
troid is calculated in B by finding the block with the minimal
sum of distances to all other blocks in B. That is, if
v
l
rep-
resents the centroid of the set for a particular feature space
l, then
V ={v
1
, v
2
, , v
L
} denotes a virtual overall centroid
across different features of a particular training set B.Here,L
is the number of low-level features or feature spaces consid-
ered.
V is referred to as a “virtual” centroid since in general, it
does not necessarily represent a specific block of B. Depend-
ing on the used feature, each centroid may be represented by
adifferent block in B. Taking
V as an anchor, the following
set of distances can be estimated:
d
(k)
l
= d
v
l
, v
(k)
l
, k = 1, , K, l = 1, , L,(1)
where v
(k)
l
denotes the lth feature vector of the kth block of
the training set, V
(k)
is the feature vector set of the kth block
and d
(k)
l
is the similarity measure for the lth feature space.
Using (1), a K
× L-matrix of distance values is then gener-
ated. For a given key word or semantic concept representing
an object and its corresponding training set B, the following
matrix is built:
d
(1)
1
d
(1)
2
··· d
(1)
L
d
(2)
1
d
(2)
2
d
(2)
L
.
.
.
.
.
.
.
.
.
d
(K)
1
d
(K)
2
··· d
(K)
L
.
(2)
In (2), each row contains distances of different features of the
same block, while each column displays distances of a feature
for different blocks. The distance matrix (2) is the basis which
the objective functions for optimization are built from.
3.2. The need for multiobjective optimization
Let D : V
× V →be the distance between a set of feature
vectors V and the virtual centroid
V in the underlying multi-
feature space. As mentioned before, the most straightforward
candidate for the combined metric D in a multifeature space
for an image block is the weighted linear combination of the
feature-specific distances:
D
(k)
V
(k)
, V, A
=
L
l=1
α
l
d
(k)
l
v
l
, v
(k)
l
,(3)
where d
(k)
l
is the distance function as defined in (1)and
A
={α
l
, l = 1, , L} is the set of weighting coefficients we
are seeking to optimize. Each row in (2) is reformed into an
objective function such as in (3). According to (3), now the
problem consists of finding the optimal set A of weighting
factors α, where optimality is regarded in the sense of both
concept representation and discrimination power. The un-
derlying argument here is that semantic objects can be more
accurately described by a suitable mixture of low-level de-
scriptors than by single ones. However, this leads to the diffi-
cult question about how descriptors can be mixed and what
is the “optimal” contribution of each feature. A simple ap-
proach to optimize the weighting factors α according to (3)
would consider the following combinative objective func-
tion:
D
V, V, A
=
K
k=1
L
l=1
α
l
d
(k)
l
v
l
, v
(k)
l
,subjectto
L
l=1
α
l
= 1.
(4)
Unfortunately, an approach based on the optimization
of (4) leads to unacceptable results due to the complex na-
ture of semantic objects. Semantically, similar objects usually
have very dissimilar visual descriptions in some spaces. Even
worse, different low-level visual features extracted from the
same object class may contradict each other. Consequently,
two main aspects need careful consideration when a solution
for (3) is sought: firstly, single optimization may lead to bi-
ased results; secondly, the contradictory nature of low-level
descriptors should be considered in the optimization process.
For the sake of clarity, let us consider two simple examples to
illustrate these two aspects.
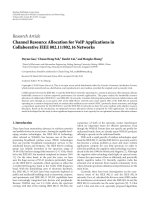
In the first example, the two groups of image blocks
shown in Figure 3 are considered. The first group contains
16 blocks of letters with uniform yellow color and blue back-
ground but featuring a diversity of edges. It is called the “Let-
ter” group. The second group contains 16 blocks with clear
horizontal edges and a diversity of colors. It is called the
“Hori” group. In this small experiment, two low-level fea-
tures are combined according to (4): color layout (CLD) and
edge histogram descriptors (EHD). That is, L
= 2 in this
specific case. Clearly, the CLD distances between blocks of
Q. Zhang and E. Izquierdo 5
(a) (b)
Figure 3: 16 examples of image blocks. “letter” group (a) and “hori” group (b).
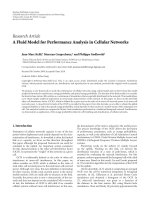
(a) (b)
Figure 4: Examples of image blocks for “building” group (a) and “flower” group (b).
the “letter” group are small, while the EHD distances are
large. Optimizing (4) leads to the “Boolean” weights 1 for
CLD and 0 for EHD. The same process applied to the “hori”
group leads to the “boolean” weights 0 for CLD and 1 for
EHD. Actually, it is straightforward to prove that the op-
timization of (4) always results in a “boolean” decision in
which a single feature get assigned the weight 1 and all the
others the weight 0. Basically, the reason behind is this simple
approach leads to a “winner takes all” result in which the po-
tential contribution of other features to the description of a
semantic object is completely ignored. Here, the winner is al-
ways the low-level feature with the smallest sum of distances
over all training blocks.
The second example aims at illustrating the conflicting
nature of descriptors. Here, the blocks illustrated in Figure 4
are considered. The first group consists of 16 blocks selected
from images containing buildings and it is called the “build-
ing” group. The second group consists of 16 blocks contain-
ing red flowers and it is called the “flower” group.
Considering the “flower” group and its intrinsic seman-
tic concept (flower), a color descriptor will identify blocks
in which the red color is dominant. The dominance of color
over other descriptors, such as edge or texture, is less signif-
icant than the dominance of color in the “letter” group in
Figure 3. Actually, in this case, the edges and textures of the
flowers also contribute to the semantic concept “flower.” On
the other hand, in the “building” group, texture and edges
are dominant while color plays a secondary role. That is, the
amount of “edgeness” in the flowers is critical to discriminate
a red building from a red flower. In either case increasing the
“colorness” or the “edgeness” too much will lead to wrong
results. The underlying conflict between descriptors discrim-
ination power cannot be solved if a single objective function
is considered. An optimal trade-off is needed. Therefore, the
optimization model needs to be based on the contribution
of each single primitive to the description of the semantic
object. Clearly, optimizing a set of potentially contradicting
objective functions does not lead to optimum solutions for
all objective functions. This is the part where multiple de-
cision making plays an important role. The interaction be-
tween different objectives leads to a set of compromised so-
lutions, largely known as the Pareto-optimal solutions [13].
Since none of these Pareto-optimal solutions can be declared
to be better than others without any further consideration,
the initial goal is to find a collection of Pareto-optimal solu-
tions. Once the Pareto-optimal solutions are available, a sec-
ond processing step is required in which higher-level decision
making is performed to choose a single solution among the
available solutions. In this paper, PAES is adopted to optimize
the metrics combining the visual descriptors. In the second
step, the high-level decision making is achieved by selecting
the solution for which the sum of all objective solutions is
minimal as the final optimal solution. The rationale behind
this decision making strategy is that small sums of weighted
distances lead to better gathering of all training sample vec-
tors in feature space, which is the target of the overall opti-
mization approach.
3.3. Multifeature metric optimization
To ensure a minimum comparability requirement, all
the L distances d
l
are normalized using simple min-max
normalization. This transforms the distance output into the
range [0, 1] by applying
d
l(new)
=
d
l
−C
(D − C)
, l
= 1, , L,(5)
where C and D are respectively the minimum and maximum
distances between all blocks in the learning set and the cor-
responding centroid.
Given a semantic object or corresponding key word, the
distance matrix (2) is built. The optimization of (3) is then
performed by applying PAES on B. Accordingly, the set of
objective functions M(A) is defined as follows:
M(A)
=
⎧
⎪
⎪
⎪
⎪
⎨
⎪
⎪
⎪
⎪
⎩
D
(1)
V
(1)
, V, A
D
(2)
V
(2)
, V, A
···
D
(K)
V
(K)
, V, A
⎫
⎪
⎪
⎪
⎪
⎬
⎪
⎪
⎪
⎪
⎭
,(6)
where A is the collection of decision variables (weighting val-
ues), and D
(k)
is the distance function of the kth block as
6 EURASIP Journal on Advances in Signal Processing
(a)
(b)
Figure 5: Positive (a) and negative (b) representative sample blocks of lion.
defined in (3). The goal is to find the best set of coefficients
A
={α
l
| l = 1, , L} subject to the following constraint:
K
l=1
α
l
= 1. (7)
The task at hand boils down to minimizing the objective
functions (6) generated for all the positive training samples
while maximizing the objective functions (6) generated for
all the negative training samples. In both cases, simultane-
ous minimization and maximization are conducted subject
to the constraint (7). For the sake of illustration, Figure 5
shows some examples of positive and negative representative
blocks for the concept lion.
Observe that, in practice, the virtual centroid
V is cal-
culated for the positive samples only. As mentioned before,
instead of a single solution, a set of Pareto-optimal solu-
tions is obtained for the positive and negative samples. Using
these sets of Pareto-optimal solutions, a final unique solu-
tion A
∗
is estimated in a second “decision making” step. This
estimation of A
∗
can be achieved by minimizing the over-
all sum of distances between all positive examples and the
centroid, while maximizing (spreading) the overall sum of
distances between all negative examples and the centroid. In
other words, the goal is to minimize the ratio between the
overall sum of distances from all positive examples to the
centroid and the overall sum of distances from all negative
examples to the centroid. Thus, A
∗
is the set of parameters
minimizing:
min
K
k
=1
D
(k)
+
V
(k)
, V, A
s
K
k=1
D
(k)
−
V
(k)
, V, A
s
, s = 1, 2, , S,(8)
where D
(k)
+
and D
(k)
−
represent the distances over positive and
negative samples, respectively, A
s
is the sth solution in the set
of Pareto-optimal solutions and S is the cardinality of the set
of Pareto-optimal solutions estimated in the first optimiza-
tion step.
3.4. Multiple objective optimization and Pareto
archived evolution
Multiobjective optimization is defined as the problem of
finding a vector of decision variables which satisfies given
constraints and optimizes a vector of objective functions.
These functions form a mathematical description of perfor-
mance criteria which are usually in conflict with each other.
Hence, the term “optimizes” means finding a solution which
gives good or acceptable values for all the objective func-
tions. It can be mathematically stated as finding a particu-
lar vector of decision variables A
∗
={α
∗
1
, α
∗
2
, , α
∗
L
}
T
sat-
isfying P constraints g
p
(A) ≥ 0, p = 1, 2, , P and at the
same time optimizing the set of vector functions M(A)
=
{
D
1
(A), D
2
(A), , D
K
(A)}
T
. Since it is rarely the case that
a single set of decision variables simultaneously optimizes all
the objective functions, “trade-offs” between multiple solu-
tions for each objective function are sought. The notion of
“optimum” is consequently redefined as Pareto optimum. A
particular vector of decision variables A
∗
∈ F is called Pareto
optimal if there exists no feasible vector of decision variables
such as A
∈ F, which could decrease some criterion however
without causing a simultaneous increase in at least one of the
other criteria. Mathematically, this optimization rule can be
expressed as follows: there does not exist another A
∈ F such
that
D
k
(A) ≤ D
k
A
∗
, ∀k = 1, , K.
(9)
This rule rarely generates Pareto-optimal solutions and
its plot is generally referred to as the Pareto front. The vectors
A
∗
are usually called nondominated set.
PAES is a multiobjective local search method. It com-
prises three parts: the candidate solution generator, the can-
didate solution acceptance function, and the nondominated
solutions (NDS) archive. The candidate solution generator is
similar to random mutation hill-climbing. It maintains a sin-
gle current solution and, in each iteration, produces a new
candidate via random mutation. The design of the accep-
tance function is obvious in the case of the mutant domi-
nating the current solution or vice versa, but in the nondom-
inated case, a comparison set is used to help decide between
the mutant and the current solution. Thus, an NDS list is
needed to explicitly maintain a limited number of the non-
dominated solutions when they are found by the hill-climber,
as the aim of multiobjective search is to find a spread of non-
dominated solutions. In [19], a pseudocode showing the sim-
plest form of PAES was given in Algorithm 1.
AgridisusedinPAESinordertoensurearchived
points cover a wide extent in objective space and are
“well distributed.” It is done by recursively dividing the
d-dimensional objective space. For this, an adaptive grid
archiving algorithm (AGA) can be used [14, 19]. When each
solution is generated, its grid location in objective space is
determined. Assuming the range of the space is defined in
Q. Zhang and E. Izquierdo 7
(1) generate initial random solution c and add it to the archive
(2) mutate c to produce m and evaluate m
(3) if (c dominates m) discard m
(4) else if (m dominates c)
(5) replace c with m, and add m to the archive
(6) else if (m is dominated by any member of the archive) discard m
(7) else apply test (c, m, archive) to determine the new solution and
whether it is needed to add m to the archive
(8) if (the termination criterion is valid) stop
else go to 2
Algorithm 1: PAES algorithm.
(a)
(b)
(c)
Figure 6: Three groups of 8 image blocks which well-defined low-level characteristics.
each objective, the required grid location can be found by re-
peatedly bisecting the range in each objective and finding the
half where the solution lies. The recursive subdivision of the
space and assignment of grid location is carried out in AGA
by calculating the range in objective space of the current so-
lutions in the archive and adjusting the grid so that it covers
this range.
In the algorithm, the uniquely extremal vectors are pro-
tected from being removed from the archive once they have
entered it (except by domination). Thus, vectors in the
archive will converge to a set which covers the largest pos-
sible range in objective space in each objective. On the other
hand, the archiving algorithm will be removing vectors from
crowded regions. A comprehensive comparative study of sev-
eral well-known algorithms for MOO was conducted in [20].
As a result, PAES appears as one of the best techniques show-
ing very low complexity.
3.5. Similarity matching in optimal multifeature space
For a particular predefined concept, an optimal multifeature
combination factor set A is obtained from the optimization
step. Using this set of combination factors, the similarity dis-
tance for any block can be calculated by
D(V,
V, A) =
L
l=1
α
l
d
l
v
l
, v
l
. (10)
These distance estimations are supposed to be represent-
ing how likely an image block region contains a particular
concept. Using these distances alone, a complete image re-
trieval process can be achieved without following steps of the
work. In this approach, the mapping from block level to im-
age level is achieved by using the similarity of the most sim-
ilar block of an image to the concept as the similarity of the
image to the concept.
4. EXPERIMENTS
As mentioned in Section 2, seven image low-level primitives
were used to assess the performance of the proposed ap-
proach:CLD,CSD,DCD,EHD[6], TGF [15], GLC [16],
and HSV [17]. It is important to stress that the proposed ap-
proach is not tailored to a given number of low-level descrip-
tors. Any descriptor bank can be used.
The first set of experiments used selected blocks from
synthetic and natural images. It aimed at showing the ef-
fectiveness of the weights derived from images with very
obvious similarity in a given feature space but large differ-
ences in others. The goal was to validate the effectives of the
proposed technique in well-defined scenarios. Initially, the
“hori” set shown in Figure 3 was considered. It was obvi-
ous that the edge descriptor clearly dominates other features.
Thus, classification based on an edge feature would outper-
form the same classifier using any other feature. When using
the MOO-based approach, a weight of 0.9997 was derived for
8 EURASIP Journal on Advances in Signal Processing
Table 1: Weights obtained for the three groups of blocks depicted in Figure 6 using different descriptors.
First group Second group Third group
Descriptors CLD EHD CLD EHD GLC CLD CSD DCD
Weights 0.0266 0.9809 0.0331 0.0475 0.9719 0.0312 0.0055 0.9762
Tiger
Grass
Lion
Cloud
Building
Figure 7: Samples of representative blocks considered for concepts: building, cloud, lion, grass,andtiger.
and assigned to the edge descriptor. Clearly, all other descrip-
tors were ignored. It could be concluded that using MOO
to find the optimal metric in multidescriptor space for im-
age classification safely outperformed techniques using the
“best” single descriptors. To consolidate this early conclu-
sion, additional experiments were run. Figure 6 shows three
groups of 8 image blocks each.
The first group at the top row in Figure 6 featured clear
horizontal edges and a diversity of colors. The CLD and EHD
descriptors were tested on this group. The weights for each
descriptor as estimated by the MOO approach were shown in
Ta ble 1 . The second group of blocks featured similar texture
and a variety of colors and edge orientations. The CLD, EHD,
and GLC descriptors were combined in this case. The weights
foreachdescriptorasreturnedbytheMOOapproachwere
shown in Ta ble 1 . Experiments on the next group aimed at
showing that even for different descriptors based on the same
visual cue (color), the proposed approach showed a good
discriminative power. The third group showed a group of 8
blocks consisting of exactly the same set of pixels: 100 yellow
and 1500 blue pixels. However, the distribution and arrange-
ment of the pixels were different in each block. The weights
for each descriptor returned by the proposed approach were
shown in Ta bl e 1 . Clearly, the DCD should dominate in this
case while the CLD and CSD present a clear coefficient vari-
ation across the group.
From these experiments it could be observed that the
proposed approach assigned suitable weights to each feature
space according to the low-level characteristics of the date
set. This set of experiments also showed that for images with
similar low-level characteristics, the best descriptor was se-
lected from the descriptor bank and the approach reduced to
a single objective optimization.
In the second round of experiments a small dataset con-
taining 700 natural images with known ground truths were
considered. This annotated set was created using natural pic-
tures from the Corel database. All images were manually se-
lected and labelled according to five predefined concepts:
building, cloud, lion, grass,andtiger. The images represent-
ing these five different semantic concepts were then mixed to
create the dataset.
Since ground truths were available in this case, precision
and recall of the retrieval performance were estimated. Four
groups of 20 elementary representative blocks were manually
selected to represent each concept: 10 positive and 10 nega-
tive samples. For each group, the distance matrix (3)wasde-
fined using these 20 blocks and the 7 descriptors mentioned
at the beginning of this section: CLD, CSD, DCD, EHD, TGF,
GLC and HSV [6, 15–17]. Thus, 20 multiobjective functions
of 7 variables were defined. Some of the sample blocks for
the different concepts were depicted in Figure 7. The set of
weights obtained after 10000 iterations of the PAES algo-
rithm were shown in Ta bl e 2. To guarantee a good perfor-
mance of the metric build with the coefficients returned by
PAES, while keeping the computation cost, 10000 iterations
were considered as a good (empirically estimated) trade-off.
Using these weights, the similarity between each block in
the dataset and the virtual centroid of a concept was esti-
mated. A similarity ranking list of blocks was then generated.
If a block of an image was relevant to a concept, the image it-
self was considered relevant to that concept. Using this rule,
images were ranked according to the ranking of single blocks.
Finally, the precision-recall curves for each concept were es-
timated. Precision and recall values were used as the major
evaluation criteria in this paper. They are commonly defined
as follows:
precision
=
retrieved and relevant
retrieved
, (11)
recall
=
retrieved and relevant
relevant
. (12)
Q. Zhang and E. Izquierdo 9
Table 2: Weights obtained after 10000 iterations of PAES.
CLD CSD DCD EHD TGF GLC HSV
Building 0.6736 0.0537 0.0095 0.0353 0.0804 0.0858 0.0646
Cloud
0.0252 0.7780 0.0914 0.0761 0.1833 0.0293 0.0315
Grass
0.130 0.1941 0.1526 0.3296 0.0460 0.1830 0.0039
Lion
0.196 0.4684 0.0677 0.0599 0.1176 0.0516 0.0415
Tiger
0.0380 0.0604 0.0040 0.3474 0.3004 0.1689 0.0895
0
10
20
30
40
50
60
70
80
90
100
Precision (%)
10 20 30 40 50 60 70 80 90 100
Recall (%)
Multi
CLD
CSD
DCD
EHD
TGF
GLC
HSV
Figure 8: Precision-recall curves for concept building using the
multifeature combination metric and using single descriptors.
In order to prove that the multifeature combination met-
ric performs better than any of the combined single descrip-
tors, the precision-recall curves using single descriptors were
also plotted in the same diagrams for comparison. These
curves were depicted in Figures 8–12, each of which plotted
curves for one of the 5 predefined concepts.
In Figures 8–12, the curves obtained using our proposed
approach was plotted with mark “o,” and they were labelled
as “multi” since the major outcome of our method was to
find out the optimised multifeature space. The curves ob-
tained using each of the single descriptors were plotted with
other marks.
It could be observed from Figures 8–12 that the retrieval
performance using the proposed approach was only slightly
outperformed in a single case: for building using EHD, but
the disadvantage of the proposed approach is not big. This
is due to the prevailing dominance of EHD for building pic-
tures. However, EHD cannot be prevailing dominant for any
concept, and there is no such a “super descriptor” can really
do so. This is why an approach such as the proposed one is
needed, which approximates the “super descriptor” by com-
bining several properly selected descriptors. It is not required
that this approximated “super descriptor” outperforms any
single descriptor when searching for any concept. Rather, the
0
10
20
30
40
50
60
70
80
90
100
Precision (%)
10 20 30 40 50 60 70 80 90 100
Recall (%)
Multi
CLD
CSD
DCD
EHD
TGF
GLC
HSV
Figure 9: Precision-recall curves for concept cloud using the multi-
feature combination metric and using single descriptors.
aim is to have it perform not worse than, if not better than,
any single descriptor when searching for any concept. There-
fore, the result given in Figure 8 is acceptable given the aim
of the proposed approach. In other cases shown in Figures 9–
12, the proposed approach performed better than using any
single descriptor in the sense of both precision and recall.
When the multifeature space was applied in a complete
image retrieval system, usually the results were displayed in a
graphical user interface. Retrieved images were presented to
the user in a ranking order according to their visual similar-
ity. Here, a threshold was needed to define how many most
similar images were to be displayed. In our framework, this
threshold value was modifiable, but it was set to be 50 by de-
fault. The precision value was redefined as follows:
precision
=
retrieved-by-threshold and relevant
retrieved-by-threshold
. (13)
The precision values on the first displaying page with a
threshold value of 50 were presented in Ta bl e 3. In the litera-
ture, many other approaches of multifeature fusion had been
proposed [8–12]. However, some of these approaches were
very different from ours in the sense of comparability [9–11].
Some others employed human interactions and were based
on different test datasets, so restoring their environment for
10 EURASIP Journal on Advances in Signal Processing
Table 3: Precision values for the first page of retrieved images with a threshold of 50.
Multifeature metric CLD CSC DCD EHD TGF GLC HSV
Building 90% 65.00% 30.00% 20.00% 90.00% 50.00% 25.00% 55.00%
Cloud
95% 75.00% 95.00% 40.00% 75.00% 25.00% 35.00% 100.00%
Grass
100% 95.00% 95.00% 30.00% 95.00% 65.00% 90.00% 95.00%
Lion
85% 65.00% 55.00% 20.00% 65.00% 25.00% 45.00% 75.00%
Tiger
70% 5.00% 55.00% 5.00% 25.00% 30.00% 25.00% 65.00%
Table 4: Our results comparing with precision values at the second iteration, presented in [12].
Proposed multifeature metric LK (CONC) in [12] RBF (CONC) in [12] ACK in [12]
Building 90% 62% 73% 75%
Cloud
95% 61% 73% 92%
Grass
100% 29% 28% 42%
Lion
85% 37% 46% 59%
Tiger
70% 64% 49% 60%
0
10
20
30
40
50
60
70
80
90
100
Precision (%)
10 20 30 40 50 60 70 80 90 100
Recall (%)
Multi
CLD
CSD
DCD
EHD
TGF
GLC
HSV
Figure 10: Precision-recall curves for concept grass using the mul-
tifeature combination metric and using single descriptors.
comparison was almost infeasible [8]. Since in [12], a set of
experiments used the same dataset as we used here, their re-
sults were taken as a comparison with our approach. These
results were presented in Tab le 4.In[12], the authors pre-
sented approaches employing several different combinations
of low-level features and SVM kernels. Among these kernels,
the approaches using RBF kernel, Laplace kernel, and the
adaptive convolution kernel (ACK) for combining the same
7 visual descriptors generally performed best. Moreover, the
method in [12] was based on user relevance feedback. The
precisions were generally the highest at the second iteration
of relevance feedback. For the sake of comparability, the re-
0
10
20
30
40
50
60
70
80
90
100
Precision (%)
10 20 30 40 50 60 70 80 90 100
Recall (%)
Multi
CLD
CSD
DCD
EHD
TGF
GLC
HSV
Figure 11: Precision-recall curves for concept lion using the multi-
feature combination metric and using single descriptors.
sults obtained using the above three kernels at the second it-
eration were chosen and presented.
As shown in Ta bl e 3, retrievals using the proposed multi-
feature metric generally outperformed retrievals using any of
the single descriptors in the perspective of precision. Com-
paring with the approach proposed in [12], our approach
was relatively more accurate. Besides, results listed in Tab le 4
were obtained after 2 iterations of relevance feedback, while
our approach was fully automatic.
The next set of experiments used a more realistic (larger)
dataset containing 12700 images from the Corel database.
Experiments based on this dataset aimed at validating the
Q. Zhang and E. Izquierdo 11
0
10
20
30
40
50
60
70
80
90
100
Precision (%)
10 20 30 40 50 60 70 80 90 100
Recall (%)
Multi
CLD
CSD
DCD
EHD
TGF
GLC
HSV
Figure 12: Precision-recall curves for concept tiger using the mul-
tifeature combination metric and using single descriptors.
proposed approach within a realistic natural image retrieval
scenario. The goal of our approach in such scenarios was to
effectively gather the relevant images at the beginning of im-
age ranking list, so that users could find a dense collection of
images on their demand in the retrieved images.
This dataset contained a large number of images and
many kinds of objects including animals, plants, human,
sceneries, and events. Even for the most common concepts
like grass, the images containing each concept were sparsely
spread over in the whole set. Because no ground truth was
available here due to the dataset size, only the first several
hundreds retrieved images were judged as relevant or irrele-
vant in a subjective fashion by a human evaluator. The first
500retrievedimagesweremanuallyjudgedforperformance
evaluation. Starting from 10, when every 10 more images
were retrieved, a precision value was estimated as in (13).
To compensate for the sparseness of the relevant images for
each concept, the obtained precision values were compared
with the percentages of each concept in the dataset. These
percentages were manually calculated from a random subset
of 1000 images in the whole dataset.
Figure 13 showed the precisions curves against the num-
ber of retrieved images for a few concepts. The straight
lines in Figure 13 indicated the percentages of images in the
dataset for the corresponding concept, that is, curves and
lines with the same colors and marks represented the same
concepts. However, these curves were not the complete pre-
cision curves for the concepts. They were just very small seg-
ments at the beginning of the complete curves, that is, the
segments of first 500/12700 of the complete curves.
Figure 14 showed the retrieval recall curves against the
number of retrieved images for concepts lion and tiger.Recall
values were estimated as in (12) based on the known fact that
there were 100 images containing each of these two concepts
10
20
30
40
50
60
70
80
90
Precision (%)
0 100 200 300 400 500
Number of retrieved images
Grass
Cloud
Building
Figure 13: The retrieval precisions curves for 3 concepts compared
with the average percentages.
0
10
20
30
40
50
60
70
Recall (%)
0 500 1000 1500 2000
Number of retrieved images
Lion
Tiger
Figure 14: The retrieval recall curves of 2 concepts.
in the dataset. Same as experiments presented in Figure 13,
no ground truth was available for these experiments. There-
fore, only 2000 images were considered as a good representa-
tion since there were only over 100 images for each concept
in the database. However similarly, these curves were not the
complete recall curves for the concepts. They were just very
small segments at the beginning of the complete curves, that
is, the segments of first 2000/12700 of the complete curves.
It could be observed from Figures 13 and 14 that relevant
images for each concept were effectively gathered within the
first few hundreds in the ranking list. It can be concluded that
the proposed approach has good discriminative power and it
is suitable for retrieving natural images in large datasets.
5. CONCLUSIONS
An approach for semantic-based and object-oriented image
retrieval is presented. By analysing the visual content of a
group of representative image blocks, an optimal similarity
12 EURASIP Journal on Advances in Signal Processing
metric per semantic concept is obtained. The core of the pro-
posed approach is a multiobjective optimization technique
to estimate weights for a linear combination of single met-
rics in multifeature space. The proposed approach has been
tested by retrieving natural images in representative datasets.
A comprehensive evaluation of the proposed technique is
presented. Based on the evaluation, we proved the ability of
the proposed approach to effectively retrieve images accord-
ing to semantic concepts from large natural image databases.
ACKNOWLEDGMENT
This research was partially supported by the European Com-
mission under the Contract FP6-045189, RUSHES.
REFERENCES
[1] C. Bishop and C. M. Bishop, Neural Networks for Pattern
Recognition, Oxford University Press, Oxford, Miss, USA,
1995.
[2] O. Chapelle, P. Haffner,andV.N.Vapnik,“Supportvectorma-
chines for histogram-based image classification,” IEEE Trans-
actionsonNeuralNetworks, vol. 10, no. 5, pp. 1055–1064, 1999.
[3] N. Friedman, D. Geiger, and M. Goldszmidt, “Bayesian net-
work classifiers,” Machine Learning, vol. 29, no. 2, pp. 131–163,
1997.
[4] A. W. M. Smeulders, M. Worring, S. Santini, A. Gupta, and
R. Jain, “Content-based image retrieval at the end of the early
years,” IEEE Transactions on Pattern Analysis and Machine In-
telligence, vol. 22, no. 12, pp. 1349–1380, 2000.
[5] Y. Rui, T. S. Huang, and S F. Chang, “Image retrieval: current
techniques, promising directions, and open issues,” Journal
of Visual Communication and Image Representation, vol. 10,
no. 1, pp. 39–62, 1999.
[6] S F. Chang, T. Sikora, and A. Purl, “Overview of the MPEG-7
standard,” IEEE Transactions on Circuits and Systems for Video
Technology, vol. 11, no. 6, pp. 688–695, 2001.
[7] A. Mojsilovi
´
c, “A computational model for color naming and
describing color composition of images,” IEEE Transactions on
Image Processing, vol. 14, no. 5, pp. 690–699, 2005.
[8] Y. Rui, T. S. Huang, M. Ortega, and S. Mehrotra, “Relevance
feedback: a power tool for interactive content-based image re-
trieval,” IEEE Transactions on Circuits and Systems for Video
Technology, vol. 8, no. 5, pp. 644–655, 1998.
[9] S. Newsam, B. Sumengen, and B. S. Manjunath, “Category-
based image retrieval,” in Proceedings of IEEE International
Conference on Image Processing (ICIP ’01), vol. 3, pp. 596–599,
Thessaloniki, Greece, October 2001.
[10] C. Schmid and R. Mohr, “Local grayvalue invariants for image
retrieval,” IEEE Transactions on Pattern Analysis and Machine
Intelligence, vol. 19, no. 5, pp. 530–535, 1997.
[11] M. Soysal and A. A. Alatan, “Combining MPEG-7 based vi-
sual experts for reaching semantics,” in Proceedings of the 8th
International Workshop on Visual Content Processing and Rep-
resentation (VLBV ’03), vol. 2849 of Lecture Notes in Computer
Science, pp. 66–75, Madrid, Spain, September 2003.
[12] D. Djordjevic and E. Izquierdo, “An object- and user-driven
system for semantic-based image annotation and retrieval,”
IEEE Transactions on Circuits and Systems for Video Technol-
ogy, vol. 17, no. 3, pp. 313–323, 2007.
[13] R. E. Steuer, Multiple Criteria Opt imization: Theory, Computa-
tion, and Application, John Wiley & Sons, New York, NY, USA,
1986.
[14] J. Knowles and D. Corne, “Approximating the nondominated
front using the pareto archived evolution strategy,” Evolution-
ary Computation, vol. 8, no. 2, pp. 149–172, 2000.
[15] B. S. Manjunath and W. Y. Ma, “Texture features for brows-
ing and retrieval of image data,” IEEE Transactions on Pattern
Analysis and Machine Intelligence, vol. 18, no. 8, pp. 837–842,
1996.
[16] M. Tuceryan and A. K. Jain, “Texture analysis,” in The Hand-
book of Pattern Recognition and Computer Vision, pp. 207–248,
World Scientific, River Edge, NJ, USA, 2nd edition, 1998.
[17] M. J. Swain and D. H. Ballard, “Color indexing,” International
Journal of Computer Vision, vol. 7, no. 1, pp. 11–32, 1991.
[18] Q. Zhang and E. Izquierdo, “A multi-feature optimization ap-
proach to object-based image classification,” in Proceedings
the 5th International Conference on Image and Video Retrieval
(CIVR ’06), vol. 4071 of Lecture Notes in Computer Science,pp.
310–319, Tempe, Ariz, USA, July 2006.
[19] J. Knowles and D. Corne, “Properties of an adaptive archiving
algorithm for storing nondominated vectors,” IEEE Transac-
tions on Evolutionary Computation, vol. 7, no. 2, pp. 100–116,
2003.
[20] A. Jaszkiewicz, Multiple Objective Metaheuristic Algorithms for
Combinatorial Optimization, Poznan University of Technol-
ogy, Poznan, Poland, 2001.