Báo cáo nghiên cứu khoa học " Data collection Guidelines for collecting and checking data " ppt
Bạn đang xem bản rút gọn của tài liệu. Xem và tải ngay bản đầy đủ của tài liệu tại đây (87.28 KB, 22 trang )
Data collection
Guidelines for collecting and
checking data
Type of data
z Quantitative
- Height, diameter, density
z Qualitative
- Stem straightness
Choosing traits
for measurement and
assessment
• survival
• dbh
• height
• stem volume
• wood density, colour
• timber strength, stiffness
• timber defects
• pulp yield
• fibre length
• stem straightness
• axis persistence/forking
• branch thickness
• branch angle
• pest and disease resistance
• growth stress
• tension wood
• fodder production
• fodder value
• other traits?
?
?
?
?
?
Choosing traits for measurement and
assessment
z Breeders aim to achieve genetic improvement in traits of economic
importance
z Breeders need to talk to the people (industry managers, farmers,
etc.) who plant and use their tree species, to find out which traits
are most important to the users
z Examples :
¾ stem straightness is not very important for trees grown for pulpwood,
but important for trees grown for sawlogs (bends in the stem reduce the
recovery of sawn wood and therefore the value of the log)
¾ dry biomass/hectare, not volume/hectare is important for biomass
energy users
Selecting and breeding for a single
trait, or for multiple traits
z Breeding for a single trait is straightforward - we just
rank the trees for the trait and choose the better trees
for breeding and propagation
z When breeding for two or more traits we must make
“trade-offs” between traits. The tree with the largest
stem volume may have very poor stem straightness -
should we select this tree, if both traits are important
to the user?
Assessing traits
z Objective or subjective scoring systems?
z Objective - e.g. 1 = no flowering
2 = flowering
z Subjective - e.g. stem straightness
1 = worst 2% of trees in trial
2 = next best 15% of trees in trial
3 = next best 33% of trees in trial
4 = next best 33% of trees in trial
5 = next best 15 % of trees in trial
6 = best 2 % of trees in trial
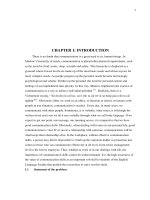
Assessing stem straightness - subjective
scoring system
worst
Prior to scoring,
inspect trial and set
proportions of scoring
categories to
approximate normal
distribution - improves
heritability of trait
Stem straightness
1
2
43
5
6
best
33%
2%
15%
Frequency
Assessing traits
z Best category gets highest score (gives consistency in constructing
selection index)
z An even number of categories (4, or 6) gives higher heritability than
odd numbers of categories (3, 5, or 7) because we are forced to make
decisions about the “average” trees - are they above or below the
mean?
1
24
3
5
even
odd
1
2
43
5
6
⇐ ? ⇒
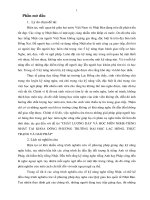
Axis persistence - objective scoring system
1 = stem axis forks
at ground level
2 = stem forks in first
quarter of tree height
3 = stem forks in second
quarter of tree height
6 = axis persists to top of tree
4 = stem forks in third
quarter of tree height
5 = stem forks in fourth
quarter of tree height
Forking defined as two or more leaders, stem diameter of smaller leader
is more than 50% of diameter of larger leader just above fork
Data collection
z Indexing information on the field data sheets
z Data sheets should be prepared with layout and
treatment information included: replicate number,
plot number, tree number, seedlot number, etc.
Indexing in field order - RCB design
Repl Plot Tree Seedlot ht03 ht04 dbh04
1 1 1 4 2.7
1 1 2 4 0.8
. . . .
. . . .
2 5 7 2
*
2 5 8 2 3.2
Collect data in field order
• Indexing information should be in field order,
NOT treatment order
• Measure a replicate at a time, using same
team, to avoid bias
• Successive measures should be in the same
order
Col 1
2
3 4 5 6 7 8 9 10 11 12
Rep 1
1
1412442355747453610 5
2 4 15 12 18 50 13 19 44 60 25 32 16
352551149 84851 62059 328
44637265340302954 739 923
5 2 58 43 22 34 21 17 14 38 56 27 33
Rep 2
1 40 30 52 12 27 59 4 13 49 60 31 39
2 5 21450335124233418 746
3 6 44 37 45 35 58 10 43 54 17 16 3
4 29 38 48 1 53 28 26 8 56 55 15 22
5 20 36 32 9 25 11 47 19 21 41 42 57
Rep 3
1 35 22 25 42 6 55 15 39 43 47 5 13
2 37 8 20 48 3 46 59 38 10 40 36 4
319 9182358 7141128325160
4 41 29 16 57 17 34 21 1 53 45 26 12
5 49 56 30 2 52 24 50 27 31 33 54 44
Rep 4
1274544133720163025 64054
2 14 57 29 28 2 41 11 9 58 8 49 10
3 18 24 55 7 22 47 34 15 42 1 4 50
4234339 3 531524632531738
12 21 33 36 60 56 35 51 26 48 59 19
Rep 5
1211859433114492847302041
2 3 40 7 33 51 17 13 50 9 12 58 42
3 60 54 2 56 39 38 5 25 55 34 44 36
426462715482232 4351053 6
5 8 11 19 52 45 16 1 37 23 29 57 24
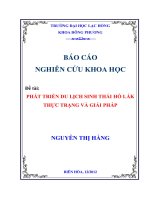
5 reps x 5 rows x 3 m = 75 m
Row
30 m
12 columns x 5 trees x 1.5 m = 90 m
z 60 families
z 5 tree row plots
z 5 replicates
z 5 rows and 12 columns
z spacing 3m between
rows
z spacing 1.5m between
trees within rows
z each seedlot occurs
only once in any long
column
Latinised row column design for seedling seed orchard with 60 families
Assess the trial
in field order !!!
One line - one tree!
z One line on the data sheet should be
used for each experimental unit (usually
a tree).
z Measurements such as height and
diameter are put in columns across the
data sheet after the indexing columns.
Data sheet
repl plot tree seedlot height dbh
1 1 1 4
1 1 2 4
1 1 3 4
1 1 4 4
1 1 5 4
Trees within a plot - same order
for each measurement! 1…25
Tree number……
12345
678910
11 12 13 14 15
16 17 18 19 20
21 22 23 24 2
5
Missing values - enter
*
z Missing values are represented by the
*
symbol, for correct analysis by Genstat.
z Blanks are not acceptable!
z If the value is 0 (for example the dbh of a
tree which is 1.1 m high) enter 0, not
*
Missing trees and variates
repl plot tree seedlot height dbh
1 1 1 4 5.6 4.8
1 1 2 4 5.8 4.9
1 1 3 4 * *
1 1 4 4 * *
1 1 5 4 1.1 0
Check the data !!!!!!!!!!!!!!!
z There will always be mistakes in the data!
z Mistakes arise at different stages of the
operation
z Read back the data from the computer
screen, with somebody checking the field
data sheet against the values which are being
read out
General tips for computer analysis of data
z Keep all the files for an experiment in one folder (directory)
z Check to see whether you are operating in the right working
folder/directory
z Keep a back-up copy of important files such as your original data
file
z As you will most likely modify the original data file, work with a
copy under a different name e.g. benthamii2.xls
z Save your work frequently so it is not lost in a power failure, or if a
program crashes
Excel tips
z Edit\Goto\special\blanks - locate blank cells
in the block of data you have entered
z =max(F2:F4000) - identify max. value in range
F2:F4000
z =min(F2:F4000) - identify minimum value
z =average(F2:F4000) calculate mean
Data should make biological
sense! Are these trees OK?
height diameter at diameter at
ground level breast height
tree (m) (cm) (cm)
1 15.5 19.5 15.6
2 1.1 3.5 0
3 15.6 14.5 22.8
4 * * 13.0
5 1.1 4.2 2.1
6 1.2 5.3 *