Báo cáo hóa học: " A New Image Analysis Based Method for Measuring Electrospun Nanofiber Diameter" ppt
Bạn đang xem bản rút gọn của tài liệu. Xem và tải ngay bản đầy đủ của tài liệu tại đây (260.48 KB, 4 trang )
NANO PERSPECTIVES
A New Image Analysis Based Method for Measuring Electrospun
Nanofiber Diameter
Mohammad Ziabari Æ Vahid Mottaghitalab Æ
Scott T. McGovern Æ A. K. Haghi
Received: 7 August 2007 / Accepted: 27 August 2007 / Published online: 14 November 2007
Ó to the authors 2007
Abstract In this paper, a new image analysis based
method for electrospun nanofiber diameter measurement
has been presented. The method was tested by a simulated
image with known characteristics and a real web. Mean
(M) and standard deviation (STD) of fiber diameter
obtained using this method for the simulated image were
15.02 and 4.80 pixels respectively, compared to the true
values of 15.35 and 4.47 pixels. For the real web, applying
the method resulted in M and STD of 324 and 50.4 nm
which are extremely close to the values of 319 and 42 nm
obtained using manual method. The results show that this
approach is successful in making fast, accurate automated
measurements of electrospun fiber diameters.
Keywords Electrospinning Á Nanofiber diameter Á
Image analysis Á Distance transform Á Local thresholding Á
l-ramdomness
Introduction
Nanofibers are considered as fibers with diameters in the
range of one or two orders of magnitude smaller than those
of conventional textile fibers. Electrospinning is a
straightforward method for manufacturing nanofibers that
combines the benefits of a controlled fiber diameter with
the possibility for large scale automated production. In this
process, a high electric field is applied between a target
plate and nozzle of a cylinder containing a polymer/solvent
dispersion. As the dispersion is pushed through the nozzle,
an electrically charged jet of polymer is formed, which, on
drying by means of evaporation of solvent, results in ran-
domly oriented nanofibers collected on the target [1–4].
The fiber diameter is one of the most important structural
characteristics in the electrospun nanofiber webs and it may
be altered by varying electrospinning parameters such as
the dispersion viscosity. However, the extremely small
fiber size and random orientation of the nanofibers make
the measurement of their diameter very difficult. In addi-
tion, large scale production of nanofibers requires unique
on-line quality control.
To date there has been no successful method developed
for the automated measuring of electrospun fiber diameter
which has hindered the uptake of this process for large-
scale production. The objective of this investigation is to
develop a new image analysis based algorithm for
measuring electrospun nanofiber diameter.
Methodology
Fiber diameter is usually determined from Scanning Elec-
tron Microscopy (SEM) images obtained of the electrospun
webs. Due to the small fiber dimensions, high-quality
images with appropriate magnifications are required.
Manual Method
Routine measurement of fiber diameter and its distribution
are carried out by manual method. First the scale is set.
Then, pixels between two edges of a fiber perpendicular
M. Ziabari Á V. Mottaghitalab (&) Á A. K. Haghi
Textile Department, University of Guilan, P.O. Box 3756,
Rasht, Iran
e-mail:
S. T. McGovern
Intelligent Polymer Research Institute,
University of Wollongong, Wollongong, Australia
123
Nanoscale Res Lett (2007) 2:597–600
DOI 10.1007/s11671-007-9093-1
to the fiber axis are counted. The number of the pixels is
then converted to nm using the scale and the resulting
diameter is recorded. On a typical image, the diameter of
100 fibers are measured using this method and the histo-
gram of fiber diameter distribution is plotted. This process
is very time-consuming and operator consistency and
fatigue may reduce the accuracy. Identifying the edges of
the fibers needs attention and the measurements are not
exactly made perpendicular to the fiber axis. It cannot be
used as on-line method for quality control, due to the need
of an operator for measurement. Automating the fiber
diameter measurement and eliminating the use of the
human operator is a natural solution to this problem.
Image Analysis
An image analysis based method was proposed by Pour-
deyhimi et al. [5] for measuring fiber diameter in
nonwoven textiles. In this method, a binary image of the
textile is used to create a distance map and skeleton. The
fiber diameter may be determined from the values of the
distance map at any pixel location on the skeleton. How-
ever, the occurrence of a broken skeleton at intersection
points is a main challenging area within the use of this
method. Since two or more fibers cross each other at these
intersections, the value of the center of the object in the
distance map doesn’t coincide with the fiber diameter at
these points because it isn’t associated with a single fiber.
The problem becomes more serious as fibers get thicker
and for points where more fibers cross each other. Hence,
the method fails in measuring fiber diameter at
intersections.
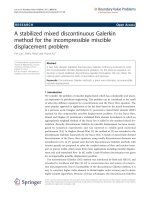
New Distance Transform Algorithm
We established a new method based on image analysis in
which the problem associated with the intersections was
solved. The method uses a binary image as an input. Then,
the distance transformed image and the skeleton are cre-
ated. It can be noted that the skeleton which is obtained by
the process of skeletonization or thinning often contains
short spurs which may be cleaned up through the use of a
pruning procedure [6]. In order to solve the problems
associated with measuring fiber diameter at the intersec-
tions, we first use a sliding neighborhood operation [6]to
identify the location of these points. Then the thickness of
each intersection is recorded from the distance transformed
image. Finally the intersections are deleted from the skel-
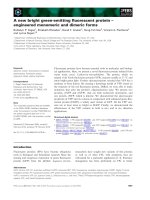
eton image based on their measured thickness. Figure 1
shows a simple simulated web, its distance transformed
image and the skeleton after pruning and deleting the
intersections. It is apparently seen that both of the distance
transformed image and skeleton are broken at intersections
(Fig. 1b, Fig. 1c). As it is observed, the problem is more
pronounced for thicker fibers and intersections with more
fibers.
In the next step, the obtained skeleton after deleting the
intersections is used as a guide for tracking the distance
transformed image and the diameters are computed from
the intensities of this image at all points along the
Fig. 1 (a) A simple simulated
image, (b) Distance transformed
image of (a), (c) Skeleton of (a)
after pruning, (d) Skeleton of
(a) after deleting the
intersections
598 Nanoscale Res Lett (2007) 2:597–600
123
skeleton. The data in pixels may then be converted to nm
and the histogram of fiber diameter distribution is plotted.
Web Simulation
In order to validate the method, test samples with known
structural characteristics are required. Algorithms for
simulation of nonwoven mats have been proposed by
Abdel-Ghani et al. [7] and Pourdeyhimi et al. [8]. One of
the most important features of simulation is that it allows
several structural characteristics such as fiber diameter and
orientation distribution and web density to be taken into
consideration. Since these characteristics of simulated
images are known exactly, one can employ them to test the
usefulness of algorithm used in characterizing diameter and
other structural features. Lately it has been discovered that
the best way to simulate nonwoven mats of continuous
fibers is through l-randomness procedure [8]. In this
scheme, a line with a specified thickness is drawn at a
distance away from a reference point and perpendicular to
an angular position [7, 8]. In this study l-randomness
procedure was used for generating a simulated image with
known characteristics.
Real Web Treatment
Fiber diameter determination by the use of image analysis
requires the initial segmentation of the micrographs in
order to produce binary images. The typical way of pro-
ducing a binary image from a grayscale image is by global
thresholding [6, 9] where a single constant threshold,
usually selected by trial and error, is applied to segment the
image. Global thresholding is very sensitive to any inho-
mogeneities in the gray-level distributions of the object and
background pixels. This effect can be eliminated through
the use of a local thresholding [6, 9] scheme. Automatic
selection of the appropriate thresholds can be carried out
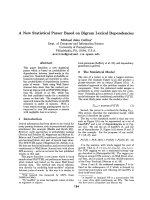
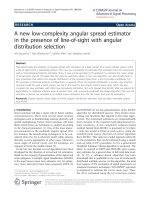
Fig. 2 Fiber diameter distributions for the simulated image given in
Fig. 1a obtained by different methods
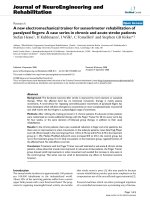
Fig. 3 (a) A simulated image,
(b) Its diameter distribution
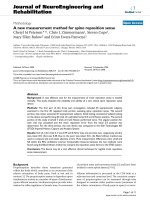
Fig. 4 (a) Micrograph of an
electrospun web, (b) Its
diameter distribution
Nanoscale Res Lett (2007) 2:597–600 599
123
based on, Otsu’s method [9]. Note that, since the process is
extremely sensitive to noise, before the segmentation, a
procedure to clean the noise and enhance the contrast of the
image is necessary.
Results and Discussion
Fiber diameter distributions for the simulated image given
in Fig. 1a obtained by different methods are shown in
Fig. 2. It is apparently seen that fiber diameter distribution
measured by new distance transform method is so close to
the real distribution (simulation). Distance transform
method tends to overestimate fiber diameter and this is seen
by a shift in the distribution toward higher diameter. Fur-
thermore, the distribution obtained by this method is
broader than real. These are due to inaccurate measurement
of fiber diameter at intersection points which was solved in
the new method. A simulated image with the diameter
sampled from a normal distribution with the mean (M) of
15 and standard deviation (STD) of 4 pixels was used to
test the validity of the method. It is noteworthy that the true
M and STD of the simulated image (15.35 and 4.47) varies
slightly with those used as simulation parameters.
Figure 3a and b respectively show the simulated image
and its diameter distribution obtained from the new dis-
tance transform method. The M and STD of fiber diameter
obtained by this method were 15.02 and 4.80 respectively,
showing a good correlation between the calculated and true
M and STD of the simulated image. Using this method,
there can be up to half a pixel error in either direction when
measuring the fiber diameter, resulting in a total mea-
surement error of up to 1-pixel. The slight differences
observed between the calculated and true values could be
attributed to this 1-pixel measurement error, some parts of
branches remaining after pruning and other slight varia-
tions in the skeleton adjacent to the deleted intersections.
Furthermore, the fiber diameters at the deleted intersections
were not counted within the measurement and may
contribute slightly to the variation observed.
To prove that this process is suitable for determination
of fiber diameter on real samples, a real nanofiber web was
obtained from electrospinning of polyvinyl alcohol (PVA)
with average molecular weight of 72,000 g/mol (MERCK).
The micrograph of the electrospun web (Fig. 4a), was
taken using a Philips (XL-30) Environmental Scanning
Electron Microscope after gold sputter coating.
Figure 4b shows the diameter distribution for the real
web. The respective M and STD of the fiber diameter
obtained by this new method were 24.74 and 3.85 in terms
of pixel and 323.7 and 50.4 in term of nm which are in
good agreement with the values 24.36 and 3.19 pixels and
318.7 and 41.8 nm obtained from manual methods. The
differences here can also be attributed to the different
number of measurements taken between the methods used
(over 2,000 for our method versus 100 for the manual
method). Nevertheless, in each case presented, the differ-
ence observed was within 1-pixel measurement error
suggesting the main limitation with the process is with the
resolution of the taken image.
Conclusion
In this study, a new image analysis based method for
assessing nanofibers diameters was successfully developed.
The validity of the method was tested using a simulated
image as well as an image of a real electrospun nanofiber
web. In the case of the real web, local thresholding was
applied on the micrograph of the web taken from SEM to
attain the necessary binary image. The M and STD of fiber
diameter which were obtained using this new method were
extremely close to true values on the simulated image. For
the real web, M and STD of fiber diameter measured by the
method were also in good agreement with those obtained
from the manual method. The results show the effective-
ness of the method for diameter measurement. The method
is automated, accurate, and much faster than manual
method and has the capability of being used as an on-line
technique for quality control.
References
1. A.K. Haghi, M. Akbari, Phys. Stat. Sol. A 204, 1830 (2007)
2. D.H. Reneker, I. Chun, Nanotechnology 7, 216 (1996)
3. H. Fong, D.H. Reneker, Electrospinning and the Formation of
Nanofibers, in Structure Formation in Polymeric Fibers, chap. 6,
ed. by D.R. Salem (Hanser, Cincinnati, 2001), pp. 225–246
4. Th. Subbiah, G.S. Bhat, R.W. Tock, S. Parameswaran, S.S.
Ramkumar, J. Appl. Polym. Sci. 96, 557 (2005)
5. B. Pourdeyhimi, R. Dent, Text. Res. J. 69, 233 (1999)
6. R.C. Gonzalez, R.E. Woods, Digital Image Processing, 2nd edn
(Prentice Hall, New Jersey, 2001)
7. M.S. Abdel-Ghani, G.A. Davis, Chem. Eng. Sci. 40, 117 (1985)
8. B. Pourdeyhimi, R. Ramanathan, R. Dent, Text. Res. J. 66, 713
(1996)
9. M. Petrou, P. Bosdogianni, Image Processing the Fundamentals
(John Wiley and Sons, England, 1999)
600 Nanoscale Res Lett (2007) 2:597–600
123