Báo cáo hóa học: " Research Article Hardware Architecture of Reinforcement Learning Scheme for Dynamic Power Management in Embedded Systems" docx
Bạn đang xem bản rút gọn của tài liệu. Xem và tải ngay bản đầy đủ của tài liệu tại đây (1.63 MB, 6 trang )
Hindawi Publishing Corporation
EURASIP Journal on Embedded Systems
Volume 2007, Article ID 65478, 6 pages
doi:10.1155/2007/65478
Research Article
Hardware Architecture of Reinforcement Learning Scheme for
D ynamic Power Management in Embedded Systems
Viswanathan Lakshmi Prabha
1
and Elwin Chandra Monie
2
1
Department of Electronics and Communication Engineering, Government College of Technology, Coimbatore 641-013,
Tamil Nadu, India
2
Thanthai Periyar Government Institute of Technology TPGIT, Vellore 632002, Tamil Nadu, India
Received 6 July 2006; Revised 7 November 2006; Accepted 28 May 2007
Recommended by Rajesh K. Gupta
Dynamic power management (DPM) is a technique to reduce power consumption of electronic systems by selectively shutting
down idle components. In this paper, a novel and nontrivial enhancement of conventional reinforcement learning (RL) is adopted
to choose the optimal policy out of the existing DPM policies. A hardware architecture evolved from the VHDL model of Temporal
Difference RL algorithm is proposed in this paper, which can suggest the winner policy to be adopted for any given workload to
achieve power savings. The effectiveness of this approach is also demonstrated by an event-driven simulator, which is designed
using JAVA for power-manageable embedded devices. The results show that RL applied to DPM can lead up to 28% power savings.
Copyright © 2007 V. L. Prabha and E. C. Monie. This is an open access article distributed under the Creative Commons
Attribution License, which permits unrestricted use, distribution, and reproduction in any medium, provided the original work is
properly cited.
1. INTRODUCTION
Dynamic power management (DPM) techniques aid en-
ergy efficient utilization of systems by selectively placing sys-
tem components into low-power states when they are idle.
A DPM system model consists of Service provider, Service
queue, Service requestor and Power Manager. Power man-
ager (PM) implements a control procedure (or policy) based
on observations of the workload. It can be modeled as a
power state machine, each state being characterized by the
level of power consumption and performance. In addition,
state transitions have power and delay cost. When a compo-
nent is placed into low-power state, it becomes unavailable
till it is switched on to the active state. The break-even time,
Tbe, is the minimum time a component should spend in the
low-power state to compensate the transition cost [1]. Hence
it is critical to determine the most appropriate policy that the
Power Manager will implement to achieve optimal power.
Appropriate policy of the Power Manager will implement
to achieve optimal power.
2. SYSTEM LEVEL-POWER MANAGEMENT POLICIES
Power management policies can be classified into four cat-
egories based on the methods to predict the movement
to low power states. The categories are greedy, timeout,
predictive, probabilistic, and stochastic. The greedy based
[2] power management will simply shutdown the device
whenever it becomes idle. It is simple; however, the perfor-
mance is not very good. A timeout policy [2]hasatime-
out value τ. Timeout policies assume that after a device is
idle for τ, it will remain idle for at least Tbe. An obv ious
drawback is the energy wasted during this timeout period.
Timeout-based policies include fixed timeout, such as set-
ting τ to three minutes. Alternatively, timeout values can
be adjusted at runtime. History, based or predictive poli-
cies predict the length of an idle period. If an idle period
is predicted to be longer than the break-even time, the de-
vice sleeps right after it is idle. Requests make a device
change between busy and idle. Probabilistic policies [1]pre-
dict idle time online and dynamically change the threshold
that decides the state movement. Stochastic policies model
[2] the arrival of requests and device power state changes
as stochastic processes, such as Markov processes. Minimiz-
ing power consumption is a stochastic optimization prob-
lem [3–7]. DPM based on idle time clustering [8] using an
adaptive tree method helps in moving the system to one
of the multiple sleep states decided by the density of the
clusters.
2 EURASIP Journal on Embedded Systems
3. REINFORCEMENT LEARNING- BASED DPM
3.1. Motivation
From the discussion of all the previous works carried out, it
is evident that success rate of each policy is dependent on the
workload.
For example, when the requests come in at long time in-
tervals, the greedy policy can give the best power optimiza-
tion. When the requests come in continuously without inter-
arrival time, worst policy (always on) can give best result. To
effect further improvement in the battery life of portable de-
vices, one new energy reduction scheme will be needed which
has to predict the best and most suitable policy from the ex-
isting policies. This warrants for the use of intelligent con-
trollers [9] that can learn themselves to predict a best pol-
icy that can balance the workload against power. This paper
focuses on implementing an intelligent Power Manager that
can change policy according to workload.
3.2. Reinforcement learning
A general model for Reinforcement Learning is defined based
on the concept of autonomy. Learning techniques will be an-
alyzed based on the probabilistic learning approach [10]. The
Reinforcement Learning model considered learning agent
(or simply the learner) and the environment. Reinforcement
Learning relies on the assumption that the system dynamics
has the Markov property, which can be defined as follows:
P
r
s
t+1
= s
, r
t+1
= r | s
0
, a
0
, r
0
, , s
t
, a
t
, r
t
,(1)
where P
r
is the probability of state [11] s and reward r that a
system will reach at time t + 1. The Markov property means
that the next state and immediate reward depend only on the
current state and action.
Given any state and action, s and a, the transition proba-
bility of each possible next state, s
,is
P
a
s,s
= P
r
s
t+1
= s
| s
t
= s, a
t
= a
. (2)
Similarly, given any current state and action, s and a, together
with any next state, s
, the expected value of the next reward
is
R
a
s,s
= E
r
t+1
| s
t
= s, a
t
= a, s
t+1
= s
∀
s
, s
∈ s, a ∈ A(s).
(3)
These quantities, P
a
s,s
and R
a
s,s
, completely specify the most
important aspects of the dynamics of a finite MDP.
Apolicy,π, is a mapping from each state, s
∈ S,andac-
tion, a
∈ A(s), to the probability π(s, a) of taking action a
when in state s,
V
π
(s) = E
π
R
t
| s
t
= s
=
E
π
∞
k=0
γ
k
r
t+k+1
| s
t
= s
,(4)
where E
π
{·} denotes the expected value given that the agent
follows policy π,andt is any time step, γ is the discount fac-
tor. Similarly, we define the value of taking action a in state
For every T sec AGENT
{ IF (success)
IF (request) {
{ Reward winner
policy;
} Update Reward
ELSE (no request) Table;
State movement }
By winner ELSE (failure)
policy; Punish policy;
Compute cost or Policy with
energy with all highest reward
policies; is winner policy;
Declare success
or failure of
winner policy
based on energy;
CALL AGENT;
}
Algorithm 1
s under a policy π,denotedQ
π
(s, a), as the expected return
starting from s, taking the action a, and thereafter following
policy π,
Q
π
(s, a) = E
π
R
t
| s
t
= s, a
t
= a
=
E
π
∞
k=0
γ
k
r
t+k+1
| s
t
= s, a
t
= a
,
(5)
where, Q
π
is the action-value function for policy π.
3.3. Pseudocode
The general pseudocode for proceeding with the Reinforce-
ment Learning DPM is as given Algorithm 1.
Temp or al D ifference Learning Algorithm (SARSA).
This learning scheme achieves better policy convergence
than linear and nonlinear learning schemes. SARSA that
stands for State- Action- Reward- State- Action [10]isan
on-policy TD control method. On-policy methods evaluate
or improve the current policy used for control. The first step
is to learn an action-value funct ion rather, that is, Q(s, a)for
the current behavior policy and for all states s (idle time) and
actions a (choice of winner policy).
SARSA algorithm
Algorithm 2 repeatedly applies the learning rule to the set of
values corresponding to the states in the environment. Start-
ing with a state s, the algorithm chooses an action a using
the maximum action state value and observes the next state
s
besides the reward r. The value Q(s, a) is updated using the
SARSA algorithm, s is set to s
and the process repeats.
V. L. Prabha and E. C. Monie 3
Initialize Q(s, a);
Repeat (for each episode): Initialize s;
Choose a from s using policy derived
from Q;
Repeat (for each step of episode):
Take act ion a,observer, s
; Choose a
from s
using policy derived from Q
Q(s, a)
←− Q(s, a)
+α
r + γ
∗
Q(s
, a) − Q(s, a)
0
s
←− s
, a ←− a
.
Until s is terminal.
α, is the learning constants and γ
∗
is the
discount factor.
Algorithm 2
4. SYSTEM MODEL
Agent
The aim of the proposed system is to select and adopt the
best system-level power management policy. The agent is the
learner. The agent in our system is responsible for learning
through the desired RL scheme, updating the reward table,
and issuing the action, that is, declaring the winner policy.
This action is fed to the environment. Thus, the agent can
be assumed to have three important parts: (1) reinforcement
learner that implements the desired RL algorithm, (2) reward
table (for SARSA Q-table) that gets updated by reinforce-
ment learner and (3) action generator which selects the win-
ner policy with the help of reward table. In short, the agent
constitutes the brain of the system.
Environment
The environment constitutes the part that the agent cannot
control, that is, the incoming traffic. It monitors the incom-
ing user requests and decides whether the current policy, that
is, the action generated by the agent is successful or not. If
successful, it issues a command to increase the reward of the
current policy; otherwise it issues a signal to punish the cur-
rent policy. Dur ing the idle time, it puts the system in the
lower modes according to the winning policy issued by the
agent. These policies are then evaluated with the duration of
the current idle period to decide whether they are success-
ful or not. The two important parts of the environment can
be termed as (1) the decision and implementation module,
(2) the servicing module (Figure 3). The latter module ser-
vices the requests till the requester queue remains un emp-
tied. The decision and implementation module starts when
the queue becomes empty and issues requisite command to
implement the winner policy according to the action (i.e., the
winner policy) selected by the agent. Thus, it puts the system
to its optimal state according to the winner policy. The deci-
Table 1: Cost computation for different policies.
Policy Cost (energy)
Always on
C
AP
=
P
a
∗ T
a
, P
a
-active power,
T
a
-active time
Greedy
C
GP
= P
a
∗ T
a
+ P
i
∗ T
i
+ e
i
+ e
L
P
i
-idle power,
e
i
-startup energy, T
i
-idle time
Time out
C
TP
= P
a
∗ T
a
+ P
i
∗ (τ)+e
i
+ e
L
L-latency, τ-threshold time
Stochastic
C
DPM
= P
a
∗ T
a
+ P
i
∗ T
r
(n +1)+e
i
+
L
T
i
T
r
(n + 1)-predicted idle time based
on previous idle time
RLTD
hard
ware
SR PM
SQ SP
Figure 1: Structure of DPM with RLTD hardware block.
sion module makes use of the cost function for system-level
policies to evaluate the energy for the current idle period.
The cost (energy) computation for different policies is in-
dicated in Table 1.
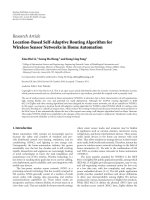
5. HARDWARE ARCHITECTURE
The basic model of a DPM has a Power Manager which issues
commands to the service provider based on the input request
and the queue, using a defined policy. The Power Manager
could be activated by a hardware whose output is a winner
policy. The winner policy would guide the Power Manager
and switch the service provider to the sleep states optimally
as shown in Figure 1.
The SARSA algorithm is converted into an equivalent
hardware block by modeling the algorithm using a VHDL
model.
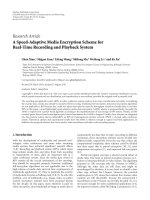
The hardware architecture consisting of various blocks is
as shown in Figure 2. It receives clock as one of the inputs
and active signal as another input. When the active signal is
high (low), it implies that the system is in Active state (idle
state).
Idle time calculation unit
The input to this unit is the clk and the active input. The out-
put of this unit is the idle time and active time value, which is
fed to compute the cost or energy for different policies used.
Cost evaluation unit
with active and idle time duration as input, the cost (energy
consumption) for all policies is calculated as per Tab le 1.
4 EURASIP Journal on Embedded Systems
Idle time
calculation
unit
Cost
evaluation
unit
Winner
policy
unit
Reward
unit
Random number
generator
Qtable
updation
unit
Qtable
Energy
table
Memory unit
Clk
Active
Winner
policy
Figure 2: Architecture for SARSA algori thm.
Q-table updating unit
The input to this unit is the output of reward unit. For ev-
ery idle time based on the reward or punishment a policy re-
ceives, the Q-table is updated using the Q-updating formula
Update :
= qtable(0) + alpha
∗
reward + gamma ∗ qtable(1) − qtable(0)
.
(6)
This Q-updating is carr ied out for all the polices.
Memor y unit
Internally, it was divided into two blocks, namely, Q-table
and Energy table. Energy table receives input from the cost
evaluation unit and Q-table receives input f rom Q-table up-
dating unit. The purpose of this memory unit is to keep a
store of the computed energy values of the three policies. To
get a better accuracy, 32 bit output is chosen for the com-
puted energy values. The Q-table stored in the memory helps
in giving the appropriate values for Q-updating as previous
Q-values are needed for current Q-computation.
Winner policy unit
This unit compares the computed Q-values for all policies
and declares as output the policy which has maximum Q as
the winner policy.
Reward unit
This unit receives input from cost evaluation unit and win-
ner policy unit. If the winner policy has the least cost (i.e.,
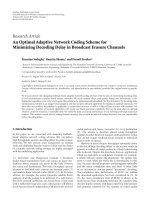
Figure 3: Workload tr ace capture.
energy), then the winner policy is rewarded by giving a
weightage of +1, else the policy is given a negative weightage
of
−1.
6. EXPERIMENTAL RESULTS
The system was modeled in VHDL (modelsim), simulated,
and then synthesized using Xilinx (device-type Spartan 2E).
The input worklo ad traces were derived by capturing real
time input generated by opening different applications on
a desktop system, and the way the capturing was done is as
shown in Figure 3.
This capture is done using Visual C++. It is a power-
ful tool to explore the system resources of windows operat-
ing system effectively. WinAPI functions are used for explor-
ing the system resources. Here, mode programming is used.
The system resources are explored by using PDH interfaces,
which is available in Pdh.h and Pdhmsg.h header files. By
using PdhAddCounter, the percentage idle time of the hard
disk is captured. Active state is represented by 0 and idle state
by 1.
The trace shows how real data captured has been buffered
and stacked in a queue. This captured queue value is the ac-
tive signal fed into the idle trace calculation unit to compute
the idle period with clock time as reference.
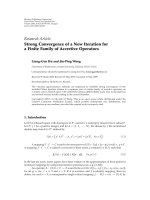
The real time plot, when processor and hard disk are busy
is shown in Figure 4.
For simulation purpose embedded devices with esti-
mated active, sleep, idle, and wakeup powers were used. Pol-
icy switching takes place based on the dynamic traffic arrival
rate. The experiment was carried out for different time dura-
tions that have been termed as episodes. Figure 5 shows how
the policy transition takes place for a 4-episode case. Here
policy 1 is timeout policy, policy 2 is greedy policy, policy 3 is
predictive policy and policy 4 is always on policy. The posi-
tive and negative transitions indicate if the selected policy got
a reward or a punishment at that instant of time. This con-
cludes that policy switching takes place with incoming dy-
namic incoming traffic and further increase in learning time
lead to less punishment or penalty in comparison to the re-
wards by a particular policy.
The experiment was carried out with a variety of poli-
cies and the energy savings obtained was observed. It was
V. L. Prabha and E. C. Monie 5
Figure 4: Real time capture plot when processor and hard disk are
busy.
20000 40000 60000
0
−4
−3
−2
−1
0
1
2
3
4
Policy penalty \ reward
Time (millisecond)
Policy transition chart
Figure 5: Policy transition for 4 episodes.
Table 2: Energy savings using RLTD.
Energy savings%
for traces
IBM Fujitsu WLAN HP
Tra ce1 19.92 12.71 25.65 10.75
Tra ce2
23.24 13.87 27.86 9.65
Tra ce3
21.54 15.65 24.67 12.87
observed that reinforcement learning with temporal differ-
ence has significant advantage over other policies as it dy-
namically settles on the best policy for any given workload.
Tab le 2 shows the percentage energy savings achieved by
reinforcement learning TD DPM using traces captured as
workload. The energ y savings was computed by running any
single policy such as greedy, always on, timeout, determinis-
tic Markov stationary policy and reinforcement learning TD.
7. IMPROVEMENT IN ENERGY SAVINGS
Temp or al D ifference Reinforcement Learning DPM has
proved that it outperforms other DPM methods. The ma-
jor advantage of this method over other methods is that it
is able to exploit the advantages of individual policies. Real
time workloads are highly random and nonstationary in na-
ture, and hence any single policy fails at some point of time.
OPBA (Online Probability-Based Algorithm) like policies
works well when the probability distributions that help in
determining the threshold point of state transition are highly
clustered. RL method performance improves with time, and
policy convergence takes place quickly and effectively.
The hardware solution suggested can be introduced in
the ACPI (Advanced Configuration Power Interface), which
links the application and the Power Manager. The output of
the block winner policy guides the Power Manager to move
the service provider to the appropriate low power state deter-
mined by the policy.
8. CONCLUSION
Dynamic power management is a powerful design method-
ology aiming at controlling performance and power levels of
digital circuits and embedded systems, with the goal of ex-
tending the autonomous operation time of battery-powered
systems.
In this work, Temporal Difference Reinforcement Learn-
ing-based intelligent dynamic power management (IDPM)
approaches to find an optimal policy from a policy table, that
is, precomputed. Hardware architecture has been proposed.
The proposed approach deals effectively with highly nonsta-
tionary workloads. The results have been verified using the
evolved hardware in FPGA. It concludes that Temporal D if-
ference Reinforcement Learning is an effective scheme as the
power saving is appreciable.
REFERENCES
[1] S. Irani, S. Shukala, and R. Gupta, “Competitive analysis of dy-
namic power management strategies for systems with multiple
power savings states,” Tech. Rep. 01-50, University of Irvine,
Irvine, Calif, USA, September 2001.
[2] L. Benini, A. Bogliolo, G. A. Paleologo, and G. de Micheli,
“Policy optimization for dynamic power management,” IEEE
Transactions on Computer-Aided Design of Integrated Circuits
and Systems, vol. 18, no. 6, pp. 813–833, 1999.
[3] Y H. Lu, T. Simunic, and G. de Micheli, “Software controlled
power management,” in Proceedings of the 7th International
Workshop on Hardware/Software Codesign (CODES ’99),pp.
157–161, Rome, Italy, May 1999.
[4] Q. Qiu and M. Pedram, “Dynamic power management based
on continuous-time Markov decision processes,” in Proceed-
ings of the 36th Annual Design Automation Conference (DAC
’99), pp. 555–561, New Orleans, La, USA, June 1999.
[5] Y H. Lu and G. de Micheli, “Comparing system-level power
management policies,” IEEE Design and Test of Computers,
vol. 18, no. 2, pp. 10–19, 2001.
[6] S. K. Shukla and R. K. Gupta, “A model checking approach to
evaluating system level dynamic power management policies
6 EURASIP Journal on Embedded Systems
for embedded systems,” in Proceedings of the 6th IEEE Inter-
national High-Level Design Validation and Test Workshop,pp.
53–57, Monterey, Calif, USA, September 2001.
[7] C. Watts and R. Ambatipudi, “Dynamic energy management
in embedded systems,” Computing & Control Engineering,
vol. 14, no. 5, pp. 36–40, 2003.
[8] E Y. Chung, L. Benini, and G. de Micheli, “Dynamic power
management using adaptive learning tree,” in Proceedings of
the IEEE/ACM International Conference on Computer-Aided
Design (ICCAD ’99), pp. 274–279, San Jose, Calif, USA,
November 1999.
[9] R. S. Sutton and A. G. Barto, Reinforcement Learning: An In-
troduction, MIT Press, Cambridge, UK, 1998.
[10] C. H. C. Ribeiro, “A tutorial on reinforcement learning tech-
niques,” in Proceedings of International Conference on Neural
Networks, INNS Press, Washington, DC, USA, July 1999.
[11] R. A. Johnson, Probability and Statistics for Engineers, Prentice-
Hall, Englewood Cliffs, NJ, USA, 2001.