Báo cáo hóa học: " Research Article Efficient Algorithm and Architecture of Critical-Band Transform for Low-Power Speech Applications" pdf
Bạn đang xem bản rút gọn của tài liệu. Xem và tải ngay bản đầy đủ của tài liệu tại đây (1.39 MB, 10 trang )
Hindawi Publishing Corporation
EURASIP Journal on Advances in Signal Processing
Volume 2007, Article ID 89264, 10 pages
doi:10.1155/2007/89264
Research Article
Efficient Algorithm and Architecture of Critical-Band
Transform for Low-Power Speech Applications
Chao Wang
1, 2
and Woon-Seng Gan
2
1
Center for Signal Processing, School of Electrical and Electronic Engineering, Nanyang Technological University,
Nanyang Avenue, Singapore 639798
2
Digital Signal Processing Lab, School of Electrical and Electronic Enginee ring, Nanyang Technological University,
Nanyang Avenue, Singapore 639798
Received 15 December 2005; Revised 8 December 2006; Accepted 18 January 2007
Recommended by Hugo Van Hamme
An e fficient algorithm and its corresponding VLSI architecture for the critical-band transform (CBT) are developed to approximate
the critical-band filtering of the human ear. The CBT consists of a constant-bandwidth transform in the lower frequency range and
a Brown constant-Q transform (CQT) in the higher frequency range. The corresponding VLSI architecture is proposed to achieve
significant power efficiency by reducing the computational complexity, using pipeline and parallel processing, and applying the
supply voltage scaling technique. A 21-band Bark scale CBT processor with a sampling rate of 16 kHz is designed and simulated.
Simulation results verify its suitability for performing short-time spectral analysis on speech. It has a better fitting on the human
ear critical-band analysis, significantly fewer computations, and therefore is more energy-efficient than other methods. With a
0.35 μm CMOS technology, it calculates a 160-point speech in 4.99 milliseconds at 234 kHz. The power dissipation is 15.6 μWat
1.1 V. It achieves 82.1% power reduction as compared to a benchmark 256-point FFT processor.
Copyright © 2007 C. Wang and W S. Gan. This is an open access article distributed under the Creative Commons Attribution
License, which permits unrestricted use, distribution, and reproduction in any medium, provided the original work is properly
cited.
1. INTRODUCTION
Spectral analysis is one of the most fundamental operations
in the field of acoustic and speech signal processing. It trans-
forms the time-domain acoustic signal into a frequency-
domain spectrum. Some traditional methods, such as fast
Fourier transform (FFT), short-time Fourier transform, and
filterbank (a group of bandpass filters), have been widely
used in academia and industry. These methods usually have
a constant frequency resolution. However, psychoacoustical
studies show that the human ear performs spectral analy-
sis on the acoustic signal in the form of a filterbank w ith
nonuniform critical bandwidths [1]. For wide-band speech
with a bandwidth of 8 kHz, there are 21 critical bands for
the Bark scale described by Zwicker [2] and 24 bands for the
Mel scale [3]. An interesting finding is that, the bandwidths
of the critical bands with center frequencies below a certain
frequency are approximately constant. The bandwidths are
around 100 Hz below 500 Hz in the Bark scale and below
1 kHz in the Mel scale. Above 500 Hz in the Bark scale or
1 kHz in the Mel scale, the bandwidths increase as the center
frequencies increase, while the Q factors of these bandpass
filters are approximately constant. Motivated by the human
auditory perception model, many methods have been devel-
oped to approximate the critical-band analysis. These meth-
ods provide advantages over other traditional ways in speech
applications, especially in the fields of speech recognition,
speech coding, and speech enhancement.
In the past two decades, various schemes to implement
critical-band analysis [4–10] have been proposed for speech
applications. These methods can be classified into four main
approaches: (i) direct digital implementation of the critical-
band filterbank, (ii) FFT method, (iii) constant-Q transform
(CQT) method, and (iv) wavelet packet transform (WPT)
method. The direct implementation of the critical-band fil-
terbank provides good results in the application of speech
recognition [4]. In the FFT method, the spectr al magni-
tude of each critical band is obtained by calculating the
weighted sum of the FFT magnitude coefficients within the
critical band in questions. However, this method requires ex-
tra postprocessing in the FFT spectrum. Some typical ap-
plications of the FFT method include audio coding [5]and
2 EURASIP Journal on Advances in Signal Processing
speech recognition [6]. One of the CQT methods [7] uses
constant-Q filters to approximate the critical-band filtering
in the high frequency range. In the lower frequency range,
the constant-bandwidth coefficients are obtained by sum-
ming the constant-Q filters coefficients within each constant-
bandwidth band in question. The CQT method in [8]em-
ploys the chirp z-t ransform to approximate the critical-band
filtering in the higher frequency range. It uses the FFT to
compute the constant-bandwidth coefficients in the lower
frequency range. The above methods give a close approxi-
mation to the critical-band scale but they are computation-
ally expensive and involve complex hardware architectures.
A new approach based on the fast orthogonal WPT (OWPT)
was proposed for the applications of speech coding, speech
enhancement, and speech recognition [9, 10]. This method
uses a tree structure to decompose the input speech signal
into the approximated critical bands. However, the disad-
vantages are the high hardware complexity, and inaccurate
approximation to the critical-band s cale.
Recently, low-power VLSI speech systems, such as speech
recognizers and speech codecs, have many promising ap-
plications in large volume battery powered portable prod-
ucts, such as personal digital assistants, communicators and
smart toys. The front-end spectral analysis in speech appli-
cations, such as the FFT, filterbank and critical-band analysis
methods, is both computation intensive and memory inten-
sive, which may consume significant power [11]. The existing
CBT methods are not suitable for low-power VLSI realiza-
tion because of the high computation complexity and high
hardware complexity. Therefore, there is a need to design an
efficient spectral analyzer for low-power speech systems.
In this study, we develop an efficient critical-band trans-
form algorithm and an architecture for approximating the
critical-band filtering of the human ear [12]. The novel CBT
scheme has a smaller on-chip memory requirement than the
other methods. It also needs fewer computations and less
memory access. The proposed VLSI architecture uses a paral-
lel and pipeline structure to increase the throughput. There-
fore, a lower supply voltage and a slower clock frequency can
be used to achieve significant power reduction.
The remainder of the paper is divided into five sections.
Section 2 describes the critical-band transform algorithm.
Section 3 presents the short-time spectral analysis of two typ-
ical speech phonemes by a 21-band Bark scale CBT. The VLSI
architecture and circuit design are presented in Section 4.We
evaluate the efficiency of the architecture by designing and
simulating the 21-band CBT processor [13], and comparing
it against a benchmark 256-point FFT processor we designed.
In Section 5, circuit simulation results are reported and dis-
cussed. Finally, conclusions are given in Section 6.
2. THE PROPOSED ALGORITHM OF
THE CRITICAL-BAND TRANSFORM
Based on the observation of the critical-band scale de-
picted in Section 1, a novel critical-band transform algo-
rithm is proposed to approximate the critical-band filtering
of the human ear. It consists of two tr ansforms: a constant-
Q transform (CQT) in the higher frequency range and a
constant-bandwidth transform (CBWT) in the lower fre-
quency range. In this study, the Bark scale is approximated.
The Brown CQT algorithm [14] is employed in the pro-
posed CBT. The results in this study show that the Brown
CQT with low Q values is a suitable algorithm for speech
signal processing. The Brown CQT is also more efficient
than the other constant-Q analysis methods. From the dis-
crete shor t-time Fourier transform, Brown derived an effi-
cient constant-Q transform with a constant ratio of center
frequency to frequency resolution (Q). It is known that the
resolution Δ f of the DFT is equal to the sampling rate di-
vided by the window size (the number of samples analyzed
in the time domain). In order to achieve a constant Q, the
window size in the Brown CQT varies inversely with fre-
quency. The frequency resolution decreases while the center
frequency increases. By choosing a suitable Q value, Brown
CQT can achieve a close fitting to the critical bandwidths in
the higher frequency range.
The CBWT in the proposed CBT is implemented by us-
ing the Brown CQT with a constant window length. The
CBWT is formally expressed as
X
k
cw
=
1
N
c
N
c
−1
n=0
w[n]x[n]
× exp
−
j2πQ
k
cw
n
N
c
, k
cw
= 1, 2, , n
cw
.
(1)
The window size N
c
in the CBWT is constant, while the win-
dow size varies for different bands in the original Brown
CQT. However, the Q value, Q
k
cw
in the Brown implemen-
tation of the CBWT is not constant. The Q
k
cw
is different for
n
cw
constant bandw idths of the CBWT.
In the CBWT, the window size is equal to the sampling
rate SR divided by the frequency resolution of 100 Hz,
N
c
=
SR
Δ f
c
=
SR
f
k
cw
Q
k
cw
= const . (2)
In accordance with the Brown CQT, the CBWT is normalized
by dividing it by N
c
. The center frequency f
k
cw
of the k
cw
th
spectral component varies linearly with k
cw
, and is given as
f
k
cw
= f
minc
+ Δ f
c
k
cw
− 1
,(3)
where f
minc
is the minimum center frequency in the lower
frequency range. The center frequency in the Brown CQT is
exponential in k
cq
.
As both the CQT and CBWT in the CBT can be expressed
in the Brown CQT form, the proposed CBT is expressed as
follows:
X
k
cb
=
⎧
⎪
⎨
⎪
⎩
X
k
cw
, k
cb
= k
cw
= 1, 2, 3, , n
cw
;
X
k
cq
, k
cb
= k
cq
= n
cw
+1, , n
cw
+ n
cq
,
(4)
where n
cw
, n
cq
are the numbers of critical bands in the lower
and higher ranges, respectively. The CBT covering the whole
C. Wang and W S. Gan 3
Table 1: Comparison of the parameters in CBWT and CQT.
CBT CBWT CQT
Range Low frequency range of CBT High frequency range of CBT
Frequency
f
minc
+(k
cw
− 1)Δ f
c
Linear in k
cw
(2
1/s
)
[k
cq
−(n
cw
+1)]
f
minq
exponential in k
cq
Window size N
c
(constant) N[k
cq
] = SR × Q
cq
/f
k
cq
(variable)
Bandwidth
SR/N
c
(constant) f
k
cq
/Q
cq
(variable)
Ratio of frequency
to bandwidth
Q
k
cw
(variable) Q
cq
(constant)
frequency range can be rearranged into one equation as
X
k
cb
=
1
N
k
cb
N[k
cb
]−1
n=0
w
k
cb
, n
x[ n]
× exp
−
j2πQ
k
cb
n
N
k
cb
,
k
cb
= 1, 2, , n
cw
+ n
cq
,
(5)
where X[k
cb
] is the k
cb
th spectral component of the CBT.
Here, x[n] is the discrete-time input speech signal and
w[k
cb
, n] is a window function for each critical band. The
length of each window is N[k
cb
].
The fixed bandwidth in the low frequency range and
constant-Q bandwidths in the higher frequency range are de-
fined as
Δ f
k
cb
=
⎧
⎪
⎪
⎪
⎪
⎪
⎨
⎪
⎪
⎪
⎪
⎪
⎩
Δ f
c
= 100, k
cb
= 1, 2, , n
cw
;
2
1/s
[k
cb
−(n
cw
+1)]
× Δ f
minq
,
k
cb
= n
cw
+1, , n
cw
+ n
cq
,
(6)
where s is the number of constant-Q bands p er octave. The
k
cb
th center frequency is expressed as
f
k
cb
=
⎧
⎪
⎪
⎪
⎪
⎪
⎪
⎪
⎪
⎪
⎨
⎪
⎪
⎪
⎪
⎪
⎪
⎪
⎪
⎪
⎩
f
minc
+Δ f
c
k
cb
−1
= 50+100×
k
cb
−1
,
k
cb
= 1, 2, , n
cw
;
2
1/s
[k
cb
−(n
cw
+1)]
× f
minq
,
k
cb
= n
cw
+1, , n
cw
+n
cq
.
(7)
Note that 50 Hz is chosen to be the center frequency of the
lowest critical band. f
minq
and Δ f
minq
are the minimum cen-
ter frequency and bandwidth in the higher frequency range,
respectively.
The Q factor of the CBT, Q
k
cb
, is therefore described by
Q
k
cb
=
f
k
cb
Δ f
k
cb
=
⎧
⎪
⎪
⎪
⎨
⎪
⎪
⎪
⎩
f
k
cb
100
, k
cb
= 1, 2, , n
cw
;
Q
cq
=
1
2
1/s
− 1
, k
cb
= n
cw
+1, , n
cw
+ n
cq
.
(8)
In order to reduce spectral leakage, a Hamming window
is chosen as the window function w[k
cb
, n]. The length of
eachwindowforeachcriticalbandisdeterminedby
N
k
cb
=
SR
Δ f
k
cb
=
⎧
⎪
⎪
⎪
⎪
⎪
⎪
⎪
⎪
⎪
⎨
⎪
⎪
⎪
⎪
⎪
⎪
⎪
⎪
⎪
⎩
N
c
=
SR
Δ f
c
=
SR
100
, k
cb
= 1, 2, , n
cw
;
SR
f
k
cb
Q
k
cb
, k
cb
= n
cw
+1, , n
cw
+ n
cq
.
(9)
A comparison between the various parameters used in
the CBWT and CQT is given in Table 1. By combining the
Hamming window w[k
cb
, n] and the exponential part into
kern[k
cb
, n], we can compute the critical-band spectrum by
only multiplications and accumulations directly from the in-
put speech data and the precalculated coefficients in (10):
X
k
cb
=
N[k
cb
]−1
n=0
x[ n]
w
k
cb
, n
N
k
cb
exp
−
j2πQ
k
cb
n
N
k
cb
=
N[k
cb
]−1
n=0
x[ n]kern
k
cb
, n
, k
cb
= 1, 2, , n
cb
.
(10)
In this paper, a 21-band Bark scale CBT with 5 constant-
bandwidth bands (100 Hz), and 16 constant-Q bands (Q
=
5.6) is constructed at a sampling rate of 16 kHz. The parame-
ter values are chosen so that the 21-band CBT closely approx-
imates the Bark scale. For the Mel scale, there are 10 constant-
bandwidth bands, and 14 constant-Q bands with Q
= 6.9.
3. SHORT-TIME CRITICAL-BAND
ANALYSIS ON SPEECH
In this section, the performance of the proposed 21-band
Bark scale critical-band transform is evaluated and compared
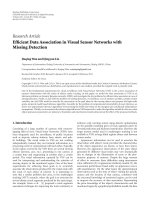
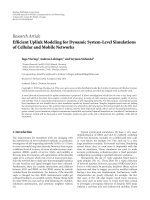
with the OWPT method. Figure 1 shows the degree of ap-
proximation to the Bark scale critical bands both for the CBT
and for the OWPT methods [9]. It shows that the proposed
CBT provides a closer approximation to the Bark scale, espe-
cially in terms of the bandwidths. This is because the OWPT
method can only divide the bandwidths by a factor of 2.
4 EURASIP Journal on Advances in Signal Processing
10
2
10
3
10
4
Center frequency (Hz)
0
200
400
600
800
1000
1200
1400
Filter bandwidth (Hz)
Munich critical band
WPT
CBT
Figure 1: Degree of approximation to Munich Bark critical bands.
The 21-band CBT algorithm has been programmed and
simulated in Matlab 6.5. A typical utterance “ka” [8] is used
in our testing. The syllable “ka” consists of two 600-ms wave-
forms for “k” and “a,” respectively. The 1200-ms speech spo-
ken by a male talker was recorded in a small room and pro-
cessed by CoolEdit Pro 2.0 at a sampling rate of 16 kHz. The
21-band CBT uses 1/2-overlap processing on the 160-point
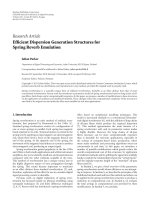
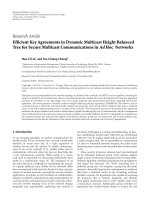
segments of the speech. The CBT spectra of the two speech
waveforms a re shown in Figures 2(a) and 2(b),respectively.
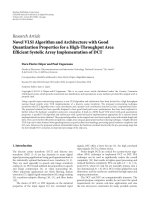
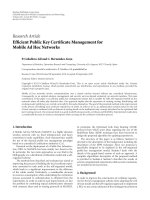
The corresponding FFT spectra are given in Figures 3(a) and
3(b), respectively. These plots show the short-time spectral
magnitude on the z-axis against the frequency in a log scale
on the x-axis. The labels on the y-axis correspond to the
speech duration in seconds.
In the first 600 milliseconds in Figure 2(a), the initial
burst of energy of the plosive “k” has a concentration of en-
ergy in the region near 2 kHz. The energy peak at the very
low frequency range is also observed in the FFT spectra as
shown in Figure 3(a). It is commonly observed in spectro-
gram analysis of the speech signal. A clear formant str uc-
tureforthevowel“a”canbeobservedfromFigure 2(b),with
the first and second formant frequencies around 650 Hz and
1100 Hz, respectively. The third formant around 2500 Hz can
also be seen. These formant frequencies are the typical fea-
tures of the vowel “a” [15]. The short-time spectra as shown
in Figure 2 for the CBT follow closely those obtained by a
256-point FFT as shown in Figure 3. The proposed CBT is
not invertible as the Brown CQT is not invertible [14]. How-
ever, it is adequate to show the typical spectral features of the
phonemes. In some speech applications, the pitch is ignor-
able and the higher frequency information is less significant
[16]. But the critical-band analysis based on the Bark scale or
Mel scale can still capture the phonetically important charac-
teristics of speech. It may work effectively and well in speech
recognition [3, 4].
Based on the above analysis and discussion, the proposed
21-band CBT performs spectral analysis of speech satisfacto-
rily. It can be used as an auditory spectral analyzer in speech
applications.
4. THE VLSI ARCHITECTURE OF
THE CRITICAL-BAND TRANSFORM
In this section, an efficient VLSI architecture is proposed for
the critical-band transform. By applying the symmetry prop-
erty of the CBT coefficients, the number of multiplications is
reduced by about 50%. The derived data path can easily be
pipelined and parallelized. It is very suitable for an ASIC im-
plementation.
4.1. The VLSI architecture of
the critical-band transform
It is observed that there is a symmetry property of the CBT
coefficient kern in (10). The coefficient consists of a real part
(the cosine function) and an imaginary part (the sine func-
tion). Applying the symmetry property of the cosine func-
tion and antisymmetry property of the sine function, the
CBT can be rearranged as
X
k
cb
=
N[k
cb
]−1
n=0
x[ n]
cos
k
cb
, n
+ j ∗ sin
k
cb
, n
=
⎧
⎪
⎪
⎪
⎪
⎪
⎪
⎪
⎪
⎪
⎪
⎪
⎪
⎪
⎪
⎪
⎪
⎪
⎪
⎨
⎪
⎪
⎪
⎪
⎪
⎪
⎪
⎪
⎪
⎪
⎪
⎪
⎪
⎪
⎪
⎪
⎪
⎪
⎩
M[k
cb
]
n=1
x[ n]+x[N − n]
cos+j∗
x[ n]−x[N −n]
sin
+
x[0] + 0
kern[0], N
k
cb
is odd,
M[k
cb
]−1
n=1
x[ n]+x[N − n]
cos+j∗
x[ n]−x[N−n]
sin
+
x[0] + 0
kern[0] +
x[ M]+0
kern[M],
N
k
cb
]iseven,
(11)
where
M
k
cb
=
⎧
⎪
⎪
⎪
⎪
⎨
⎪
⎪
⎪
⎪
⎩
N
k
cb
−
1
2
, N
k
cb
is odd,
N
k
cb
2
, N
k
cb
is even.
(12)
There are two operation modes for calculating the CBT
spectrum of each critical band, when the window length is
odd and even, respectively. By inserting zeroes into the equa-
tion, we can derive the regular expressions a s described by
(11). Therefore, the number of multiplications and memory
usage are reduced by about 50%. These savings contribute
significantly not only to the reduction of the memory area
but also to the saving of power consumption by frequent
C. Wang and W S. Gan 5
10
2
10
3
x
Frequency (Hz)
0
1
2
3
4
5
6
7
8
×10
−2
z
Magnitude
0
0.1
0.2
0.3
0.4
0.5
0.6
y
Time (s)
(a)
10
2
10
3
x
Frequency (Hz)
0
1
2
3
4
×10
−2
z
Magnitude
0
0.1
0.2
0.3
0.4
0.5
0.6
y
Time (s)
(b)
Figure 2: (a) CBT analysis of the first 600 ms of “ka”; (b) CBT analysis of the second 600 ms of “ka.”
10
2
10
3
x
Frequency (Hz)
0
5
10
15
z
Magnitude
0
0.1
0.2
0.3
0.4
0.5
0.6
y
Time (s)
(a)
10
2
10
3
x
Frequency (Hz)
0
5
10
15
z
Magnitude
0
0.1
0.2
0.3
0.4
0.5
0.6
y
Time (s)
(b)
Figure 3: (a) FFT analysis of the first 600 ms of “ka”; (b) FFT analysis of the second 600 ms of “ka.”
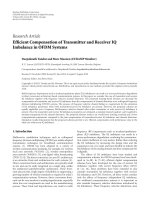
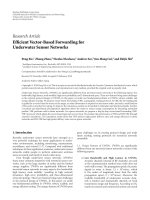
memory access. The data flow of the CBT is derived from
(11). As depicted in Figure 4, the CBT spectral magnitude for
each critical band is obtained after all the accumulations over
a window of input speech samples complete. We denote the
addition (or subtra ction) and multiplication-accumulation
(MAC) process of a pair of data elements as one butterfly op-
eration.
The proposed VLSI architecture of the critical-band
transform processor consists of a pipelined data path, a con-
troller, a coefficient ROM, a data input RAM, a data output
RAM, and an address generator. In this study, the I/O data
and coefficients are expressed in the 16-bit two’s complement
fixed-point format. The operation of the processor is parti-
tioned into data I/O process (I/O mode) and CBT computa-
tion process (CBT mode).
From the CBT data flow depicted in Figure 4,wepro-
pose a two-multiplier and four-adder pipelined data path as
shown in Figure 5. The data are processed in two parallel
x[n]
+
cos
+
Real[X]
= cbr
x[m]
−
sin
+
Image[X]
= cbi
Figure 4: Data flow graph of the CBT algorithm.
paths. The efficient pipeline and par allel processing makes
it possible to utilize the supply voltage scaling approach to
achieve significant power reduction [17]. It has three pipeline
stages to improve the processing throughput. In the first
6 EURASIP Journal on Advances in Signal Processing
Table 2: Pipeline table of CBT data path.
RAM read First 2 adds Two mults. Second 2 adds —
x[n]
x[n]+0
x[n]
− 0
read kern
x[n]×cos
x[n]
× sin
2 accumulations —
— RAM read First 2 adds Two mults. Second 2 adds
— x[n], x[m]
x[n]−x[m]
x[n]+x[m]
read kern
(x[n]−x[m])×kern
(x[n]+x[m])
×kern
2 accumulations
Table 3: Last butterfly operation in the pipeline.
RAM read First 2 adds Two mults. Second 2 adds RAM write
x[n], x[m]
x[n]+x[m]
x[n]
−x[m]
read kern
(x[n]−x[m])×kern
(x[n]+x[m])
×kern
2 accumulations cbr, cbi
(a) When window size N[k
cb
]isodd
RAM read First 2 adds Two mults. Second 2 adds RAM write
x[n]
x[n]+0
x[n]
− 0
read kern
x[n]×cos
x[n]
× sin
2 accumulations cbr, cbi
(b) When window size N[k
cb
]iseven
x[n]
R
+
cos
R
R
∗
R
R
+
R
Real[X]
= cbr
x[m]
R
−
sin
R
R
∗
R
R
+
R
Image[X]
= cbi
c1, rst1 c2 c3, rst3 cw
Figure 5: Proposed pipelined CBT data path.
stage, the first pair of 16-bit wide adders processes two data
elements from the input RAM. The two multipliers compute
16-bit
× 16-bit multiplications and produce 32-bit results for
each multiplier in the second stage. In the last stage, the sec-
ond pair of 32-bit wide adders performs the accumulations.
The final results are truncated into 16-bits and written to the
output RAM, when a CBT spectrum computation is com-
pleted.
As described in (11), for a particular CBT spectrum, there
are (N[k
cb
]−1)/2+1 butterfly operations when N[k
cb
] is odd,
or N[k
cb
]/2+1 butterflies when even. The pipeline processing
of the butterfly operations is described in Ta ble 2. In the first
butterfly operation for each critical band, only one data ele-
ment is read from the input RAM and fed into one of the first
pair of pipeline registers. At the same time, the other register
is reset to zero as described in (11). As shown in Table 3, the
CBT data path has two working modes, that is, even mode
and odd mode. This is because the last butterfly operation
might be different for individual critical bands. For the odd
window length, a pair of data elements is read from the in-
put RAM as usual but only one data element is read when the
window size is even. It takes the data path (N[k
cb
] − 1)/2+4
cycles to compute a CBT spectrum (including access of the
I/O memories) when N[k
cb
] is odd, and N[k
cb
]/2 + 4 cycles
when N[k
cb
]iseven.
The proper pipeline processing with the two working
modes is controlled by a controller. By multiplexing the data
path, CBT spectra are computed one by one from band 1 to
band n
cb
. This controller also supervises the other functional
units in the processor for proper operation. The coefficient
ROMstorestheprecomputedCBTcoefficients kern, and the
I/O RAMs are used to buffer the input speech data and out-
put CBT spectra. Another important functional unit is the
address generator, which provides the correct addresses for
the I/O RAMs and the coefficient ROM. It consists of the
critical-band gener ator and the address generation unit. The
critical-band generator keeps track of which CBT spectrum
is being computed. It also provides the controller and the ad-
dress generation unit with the information of each critical
C. Wang and W S. Gan 7
band, including the number of the butterfly operations, par-
ity of the window size, and the offset values for calculating
the correct addresses in the CBT mode. This infor mation has
been prestored in the critical-band generator when a particu-
lar CBT is determined. The address generation unit generates
addresses for the coefficient ROM in CBT mode and for the
I/O RAMs in both CBT and I /O modes.
For comparison, we also design a 256-point ra dix-2 DIT
(decimation-in-time) in-place FFT processor based on a
single-butterfly architecture, as a benchmark against the pro-
posed CBT processor. The benchmark FFT processor consists
of a controller, a coefficientROM,adataRAM,anaddress
generation unit, and a pipelined butterfly unit with only two
multipliers and three adders. The I/O data and coefficients
are also represented in the 16-bit two’s complement fixed-
point format.
The implementation of the butterfly unit is very crucial
in the design of a single-butterfly FFT processor. In the litera-
ture, there are mainly three methods using different numbers
of multipliers and adders to implement the radix-2 DIT but-
terfly unit. T he radix-2 DIT butterfly is described by
C
= A + W × B,
D
= A − W × B,
(13)
where W is the twiddle factor. In (13), A and B are the two in-
puts, while C and D are the two outputs. All the variables are
complex numbers. By replacing the complex variables with
real variables, a fully parallel butterfly stru cture with four
multipliers and six adders in [18] was derived to achieve the
highest throughput. The four-multiplier and six-adder but-
terfly unit computes one butterfly operation every cycle. To
reduce the hardware cost, a one-multiplier and two-adder
butterfly unit in [19]wasproposedtocomputeonebutterfly
operation every four cycles by multiplexing just one multi-
plier and two adders. By considering both performance and
cost, the two-multiplier and four-adder implementation pro-
vides the best trade off as claimed in [20]. The throughput is
two cycles for one butterfly operation, while the control is
much simpler.
In the benchmark 256-point FFT processor, we design
a two-multiplier and three-adder radix-2 DIT butterfly unit
derived from the rewritten butterfly equation (14)
X
= B
R
× W
R
− B
I
× W
I
,
C
R
= A
R
+ X,
D
R
= A
R
− X,
Y
= B
I
× W
R
+ B
R
× W
I
,
C
I
= A
I
+ Y,
D
I
= A
I
− Y.
(14)
In (14), the subscripts “R”and“I” are used to denote the
real part and imaginary part of the complex variables, re-
spectively. For simplicity, the j prefix associated with the
imaginary part is omitted. From (14), a rescheduled SFG for
the radix-2 butterfly is derived as shown in Figure 6.Based
on the SFG, we propose a two-multiplier and three-adder
pipelined butterfly unit as depicted in Figure 7.Compared
W
I
B
I
(B
R
)
A
R
(A
I
)
+
C
R
(C
I
)
−
+
X(Y )
W
R
B
R
(B
I
)
A
R
(A
I
)
−
+
D
R
(D
I
)
Figure 6: Rescheduled data flow graph for the radix-2 butterfly.
with the two-multiplier and four-adder scheme, it can still
achieve a throughput of two cycles with a latency of four cy-
cles, while it has less hardware cost by reducing the num-
ber of adders from four to three. It is a good solution with
a good trade-off for low-cost speech applications. The pro-
posed two-multiplier and three-adder butterfly unit is em-
ployed to compute the butterfly operations recursively in the
benchmark FFT processor.
In high-performance applications, such as image, video,
and radar signal processing, the pipeline architecture [21]
and the parallel architecture [22] using multiple butterfly
units are widely used to compute the high-speed long-sized
FFT. All these architectures including the single-butterfly
methods provide users flexibility to make a trade off between
hardware cost and performance, by choosing different num-
bers of butterfly units to achieve a different throughput for a
particular application. However, our study focuses low-cost
speech applications. The multiple-butterfly pipeline and par-
allel architectures are not necessary and too expensive as the
performance requirement of speech applications is not high.
For example, the array FFT processor designed in [22 ] uses
four butterfly units to compute the FFT. Each butterfly unit
consists of two multipliers and four adders. So the hardware
cost required by the butterfly units in the array processor is
four times that of the sing le-butterfly architecture. Given the
segments of 256-point speech samples at a sampling rate of
16 kHz, the single-butterfly FFT architecture can easily meet
the real-time processing requirement. Because of low cost re-
quirements, we chose the single-butterfly architecture to de-
sign the benchmark 256-point FFT processor.
4.2. Computation complexity and memory access
Since most of the operations in DSP algorithms involve mul-
tiplications and accumulation, the multiplication and ad-
dition operations are commonly used to measure the effi-
ciency of DSP algorithms. In this section, the numbers of
multiplications and additions are used to evaluate the power-
efficiency of the proposed CBT algorithm and architecture.
In the proposed CBT, the number of the complex mul-
tiplications is half of the window lengths due to the coeffi-
cient symmetry property. The input speech data is always real
8 EURASIP Journal on Advances in Signal Processing
W
I
R
B
I
R
B
R
R
W
R
R
Switch
∗
∗
R
R
+/
−
A
R
A
I
R
R
MUX
R
+
R
C
R
(C
I
)
−
R
D
R
(D
I
)
c1 c2 c3 c5
c6
c4 c4
Figure 7: Proposed pipelined radix-2 butterfly unit.
Table 4: Comparison of on-chip memory access.
Auditory spectral analyzer
RAM access
Total memory access
Input wr ite R/W during computation Output read
256-point in-place FFT processor 256 8192 (512×2 × 8) 512 8960
21-band CBT processor 160 1808 (1766 + 42) 42 2010
and the coefficients are complex. The 21-band CBT involves
1766 real multiplications and 3466 real additions. Both the
numbers of real multiplications and real additions in the
256-point FFT are 4096. The OWPT method, using 10-order
Daubechies filters, consumes 9216 real multiplications and
3800 real additions in a frame of 64 samples [9]. The number
of multiplications in the CBT is 56.9% less than in the FFT,
while the saving in the real additions is 15.4%. The reduction
as compared to the OWPT is more significant. Recently, the
lifting technique is widely used in wavelet transforms to re-
duce the computation complexity by up to 50% [23]. If the
lifting technique is used in the WPT method, the computa-
tion is still larger than in the CBT.
In most typical DSP algorithms, frequent memory access
is another important contribution to the total power dissi-
pation. Therefore, the memory access of the proposed CBT
processor is also compared with that of the 256-point FFT
processor in this section. For the proposed 21-band CBT pro-
cessor, the on-chip memory consists of a 1766-word
× 16-bit
ROM, a 160-word
× 16-bit RAM, and a 42-word × 16-bit
output RAM. The 256-point FFT processor requires a 256-
word
× 16-bit coefficient ROM and a 512-word × 16-bit
RAM. The comparison on RAM access is given in Tabl e 4.
The CBT requires a total of 2010 read/write RAM accesses.
This is in contrast to the 8960 accesses required for a 256-
point in-place FFT. The 21-band CBT results in a reduction
of 77.6% in memory accesses as compared to the FFT.
5. CIRCUITS SIMULATION RESULTS AND ANALYSIS
The proposed 21-band Bark scale CBT processor and the
benchmark 256-point FFT processor are designed by using
VHDL. The CBT processor takes 1167 cycles to compute a
21-band CBT. The FFT processor computes a 256-point FFT
in 2572 cycles.
Both the CBT processor and the FFT processor are sim-
ulated at RTL by using Mentor Graphics Modelsim. They
have been synthesized into gate level by the Synopsys design
compiler with the AMS 0.35 μm CMOS standard cell library.
The estimated areas of the two processors are 2.69 mm
2
and
9.02 mm
2
, respectively. The estimated maximum clock fre-
quencies are 83.3 MHz and 100 MHz, respectively. In order
to estimate the power dissipation, the two processors are sim-
ulated at transistor level by Synopsys Nanosim. Simulation at
transistor level shows that the CBT processor can still work
at a maximum clock frequency of 13 MHz, when the sup-
ply voltage is scaled down to 1.1 V. It can achieve real-time
processing at 234 kHz. Ta ble 5 lists the percentage dissipa-
tion for the different functional units at 234 kHz and 1.1 V.
Table 6 shows the estimated power dissipation at 1.1 V when
the clock frequency is 234 kHz and 1 MHz, respectively. The
CBT processor operates at 50% overlap on 160-point data
segments at a sampling ra te of 16 kHz.
Table 5 shows that the multiplications and RAM memory
accesses consume the largest portion of the total power dis-
sipation, which is 52.1% and 17.6%, respectively. It is shown
in Table 6 that the CBT processor can achieve about 95.3%
power saving at 234 kHz by scaling the supply voltage from
3.3 V to 1.1 V.
As a benchmark, the 256-point FFT processor can per-
form real-time processing within 7.7 milliseconds at 322 kHz
and 1.1 V. It operates at 50% overlap on 256-point data seg-
ments. The FFT processor consumes 87.1 μW per FFT, while
the CBT processor consumes only 15.6 μWperCBT.
C. Wang and W S. Gan 9
Table 5: Power dissipation percentage for different functional units in the CBT processor.
Functional units Address generator Controller I/O RAM ROM Data path (multiplications)
Percentage of the total
power dissipation
4.6% 2.8% 17.6% 2.9% 71.3% (52.1%)
Table 6: CBT processor power dissipation simulation results under
1.1 V and 3.3 V.
Supply voltage (V) 3.3 1.1
Clock frequency (MHz)
0.234 0.234
Average power (μW/MHz)
1413.6 66.7
6. CONCLUSIONS
An efficient algorithm and its VLSI architecture for the
critical-band transform have been proposed for speech ap-
plications. Comparative studies were conducted to show that
the proposed 21-band Bark scale CBT is better than the
OWPT and FFT methods in terms of the closeness in approx-
imation to human ear critical-band filtering, computational
complexity, and memory access. Simulation results verified
its suitability for p erforming short-time spectral analysis on
speech. Circuits design and simulation of the CBT proces-
sor and a benchmark 256-point FFT processor verified the
power efficiency of the proposed architecture. The proposed
CBT algorithm and its architecture are very suited for low-
power speech applications.
REFERENCES
[1] H. Fletcher, “Auditory patterns,” Reviews of Modern Physics,
vol. 12, no. 1, pp. 47–65, 1940.
[2] E. Zwicker, “Subdivision of the audible frequency range into
critical bands (frequenzgruppen),” TheJournaloftheAcousti-
cal Society of America, vol. 33, no. 2, p. 248, 1961.
[3] J. W. Picone, “Signal modeling techniques in speech recogni-
tion,” Proceedings of the IEEE, vol. 81, no. 9, pp. 1215–1247,
1993.
[4] B. A. Dautrich, L. R. Rabiner, and T. B. Martin, “On the effects
of varying filter bank parameters on isolated word recogni-
tion,” IEEE Transactions on Acoustics, Speech, and Signal Pro-
cessing, vol. 31, no. 4, pp. 793–807, 1983.
[5] P. Noll, “Digital audio coding for visual communications,”
Proceedings of the IEEE, vol. 83, no. 6, pp. 925–943, 1995.
[6] S. B. Davis and P. Mermelstein, “Comparison of paramet-
ric representations for monosyllabic word recognition in con-
tinuously spoken sentences,” IEEE Transactions on Acoustics,
Speech, and Signal Processing, vol. 28, no. 4, pp. 357–366, 1980.
[7] T. L. Petersen and S. F. Boll, “Critical band analysis-synthesis,”
IEEE Transactions on Acoustics, Speech, and Signal Processing,
vol. 31, no. 3, pp. 656–663, 1983.
[8] J. M. Kates, “An auditory spectral analysis model using the
chirp z-transform,” IEEE Transactions on Acoustics, Speech, and
Signal Processing, vol. 31, no. 1, pp. 148–156, 1983.
[9] B. Carnero and A. Drygajlo, “Perceptual speech coding and
enhancement using frame-synchronized fast wavelet packet
transform algorithms,” IEEE Transactions on Signal Processing,
vol. 47, no. 6, pp. 1622–1635, 1999.
[10] O. Farooq and S. Datta, “Mel filter-like admissible wavelet
packet structure for speech recognition,” IEEE Signal Process-
ing Letters, vol. 8, no. 7, pp. 196–198, 2001.
[11] A. P. Chandrakasan, S. Sheng, and R. W. Brodersen, “Low
power techniques for portable real-time DSP applications,” in
Proceedings of the 5th International Conference on VLSI Design,
pp. 203–208, Bangalore, India, January 1992.
[12] C. Wang and Y C. Tong, “An improved critical-band trans-
form processor for speech applications,” in Proceedings of IEEE
International Symposium on Circuits and Systems (ISCAS ’04),
vol. 3, pp. 461–464, Vancouver, BC, Canada, May 2004.
[13] C. Wang, Y C. Tong, and Y. Shao, “VLSI design and analysis
of a critical-band transform processor for speech recognition,”
in Proceedings of IEEE International SOC Conference, pp. 365–
368, Santa Clara, Calif, USA, September 2004.
[14] J. C. Brown, “Calculation of a constant Q spectral transform,”
Journal of the Acoustical Society of America, vol. 89, no. 1, pp.
425–434, 1991.
[15] L. Rabiner and B. Juang, Fundamentals of Speech Recognition,
Prentice-Hall, Englewood Cliffs, NJ, USA, 1993.
[16] J. N. Holmes and W. J. Holmes, Speech Synthesis and Recogni-
tion, Taylor & Francis, New York, NY, USA, 2nd edition, 2001.
[17] A. P. Chandrakasan, S. Sheng, and R. W. Brodersen, “Low-
power CMOS digital design,” IEEE Journal of Solid-State Cir-
cuits, vol. 27, no. 4, pp. 473–484, 1992.
[18] B. M. Bass, “A low-power, high-performance, 1024-points FFT
processor,” IEEE Journal of Solid-State Circuits, vol. 34, no. 3,
pp. 380–387, 1999.
[19] E. Cetin, R. C. S. Morling, and I. Kale, “An integrated 256-
point complex FFT processor for real-time spectrum analy-
sis and measurement,” in Proceedings of IEEE Instrumentation
and Measurement Technology Conference, vol. 1, pp. 96–101,
Ottawa, ON, Canada, May 1997.
[20] P. A. Ruetz and M. M. Cai, “A real time FFT chip set: architec-
tural issues,” in Proceedings of the 10th Internat ional Conference
on Pattern Recognition, vol. 2, pp. 385–388, Atlantic City, NJ,
USA, June 1990.
[21] E. Bidet, D. Castelain, C. Joanblanq, and P. Senn, “A fast single-
chip implementation of 8192 complex point FFT,” IEEE Jour-
nal of Solid-State Circuits, vol. 30, no. 3, pp. 300–305, 1995.
[22] Z. Liu, Y. Song, T. Ikenaga, and S. Goto, “A VLSI array pro-
cessing oriented fast Fourier transform algorithm and hard-
ware implementation,” IEICE Transactions on Fundamentals of
Electronics, Communications and Computer Sciences, vol. 88,
no. 12, pp. 3523–3530, 2005.
[23] I. Daubechies and W. Sweldens, “Factoring wavelet transforms
into lifting steps,” Journal of Fourier Analysis and Applications,
vol. 4, no. 3, pp. 247–269, 1998.
10 EURASIP Journal on Advances in Signal Processing
Chao Wang received his B.Eng. degree in
electronics engineering from the Depart-
ment of Electronics Science and Technol-
ogy, Huazhong University of Science and
Technology, Wuhan, China, in 2000. Cur-
rently, he is a Ph.D. Candidate in the School
of Elect rical and Electronic Engineering,
Nanyang Technological University (NTU),
Singapore. He is also with the Center for
Signal Processing, NTU as a Research Engi-
neer. His research interests include digital IC design, VLSI architec-
tures for digital signal processing, low-power design, and embed-
ded signal processing.
Woon -Seng Gan received his B.Eng. (1st
class hons) and Ph.D. degrees, both in elec-
trical and electronic engineering from the
University of Strathclyde, UK, in 1989 and
1993, respectively. He joined the School
of Elect rical and Electronic Engineering,
Nanyang Technological University, Singa-
pore, as a Lecturer and Senior Lecturer in
1993 and 1998, respectively. In 1999, he
was promoted to an Associate Professor. He
teaches several undergraduate, postgraduate, and industry courses
on digital signal processing and real-time signal processing im-
plementation. His research interests include adaptive signal pro-
cessing, psycho acoustical signal processing, image processing, and
real-time digital signal processing. He has published more than 130
international refereed journals and conferences. He has coauthored
a book on “Digital Signal Processors: Architectures, Implementations,
and Applications,” Prentice Hall, 2005, and he is the leading author
of a latest book on “Embedded Signal Processing with the Micro Sig-
nal Architecture,” Wiley-IEEE Press, 2007.