Báo cáo hóa học: " Research Article Unobtrusive Biometric System Based on Electroencephalogram Analysis" pptx
Bạn đang xem bản rút gọn của tài liệu. Xem và tải ngay bản đầy đủ của tài liệu tại đây (677.2 KB, 8 trang )
Hindawi Publishing Corporation
EURASIP Journal on Advances in Signal Processing
Volume 2008, Article ID 143728, 8 pages
doi:10.1155/2008/143728
Research Article
Unobtrusive Biometric System Based on
Electroencephalogram Analysis
A. Riera,
1
A. Soria-Frisch,
1, 2
M. Caparrini,
1
C. Grau,
1, 3
and G. Ruffini
1
1
Starlab S. L., Cam
´
ı a l’Observatori Fabra, 08035 Barcelona, Spain
2
Department of Information and Communication Technologies, Pompeu Fabra University, Plac¸a de la Merc
`
e, 10-12,
08003 Barcelona, Spain
3
Department de Psiquiatria i Psicobiologia Cl
´
ınica, Universitat de Barcelona, Vall d’Hebron 171, 08035 Barcelona, Spain
Correspondence should be addressed to A. Riera,
Received 30 April 2007; Revised 2 August 2007; Accepted 8 October 2007
Recommended by Konstantinos N. Plataniotis
Features extracted from electroencephalogram (EEG) recordings have proved to be unique enough between subjects for biometric
applications. We show here that biometry based on these recordings offers a novel way to robustly authenticate or identify subjects.
In this paper, we present a rapid and unobtrusive authentication method that only uses 2 frontal electrodes referenced to another
one placed at the ear lobe. Moreover, the system makes use of a multistage fusion architecture, which demonstrates to improve the
system performance. The performance analysis of the system presented in this paper stems from an experiment with 51 subjects
and 36 intruders, where an equal error rate (EER) of 3.4% is obtained, that is, true acceptance rate (TAR) of 96.6% and a false
acceptance rate (FAR) of 3.4%. The obtained performance measures improve the results of similar systems presented in earlier
work.
Copyright © 2008 A. Riera et al. This is an open access article distributed under the Creative Commons Attribution License, which
permits unrestricted use, distribution, and reproduction in any medium, provided the original work is properly cited.
1. INTRODUCTION
The term “biometrics” can be defined as the emerging field
of technology devoted to identification of individuals using
biological traits, such as those based on retinal or iris scan-
ning, fingerprints, or face recognition.
Biometrics is nowadays a big research playground, be-
cause a highly reliable biometric system results extremely in-
teresting to all facilities where a minimum of security access
is required. Identity fraud nowadays is one of the more com-
mon criminal activities and is associated with large costs and
serious security issues. Several approaches have been applied
in order to prevent these problems.
New types of biometrics, such as EEG and ECG, are based
on physiological signals, rather than more traditional biolog-
ical traits. This has its own advantages as we will see in the
following paragraph.
An ideal biometric system should present the following
characteristics: 100% reliability, user friendliness, fast oper-
ation, and low cost. The perfect biometric trait should have
the following characteristics: very low intrasubject variabil-
ity, very high intersubject variability, very high stability over
time and universal. Typical biometric traits, such as finger-
print, voice, and retina, are not universal, and can be sub-
ject to physical damage (dry skin, scars, loss of voice, etc.).
In fact, it is estimated that 2–3% of the population is miss-
ing the feature that is required for the authentication, or that
the provided biometric sample is of poor quality. Further-
more, these systems are subject to attacks such as presenting
a registered deceased person, dismembered body part or in-
troduction of fake biometric samples.
Since every living and functional person has a record-
able EEG signal, the EEG feature is universal. Moreover, brain
damage is something that rarely occurs. Finally, it is very hard
to fake an EEG signature or to attack an EEG biometric sys-
tem.
The EEG is the electrical signal generated by the brain
and recorded in the scalp of the subject. These signals are
spontaneous because there are always currents in the scalp
of living subjects. In other words, the brain is never at rest.
Because everybody has different brain configurations (it is
estimated that a human brain contains 10
11
neurons and
2 EURASIP Journal on Advances in Signal Processing
10
15
synapses), spontaneous EEG between subjects should be
different; therefore a high intersubject variability is expected
[11].
As it will be demonstrated with the results of our re-
search, EEG presents a low intrasubject variability in the
recording conditions that we defined: during one minute the
subject should be relax and with his eyes closed. Further-
more, the system presented herein attains the improvement
of the classification performance by combining a feature fu-
sion with a classification fusion strategy. This kind of mul-
tistage fusion architecture has been presented in [22]asan
advancement for biometry systems.
This paper describes a ready-to-use authentication bio-
metric system based on EEG. This constitutes the first dif-
ference with already presented works [4, 5, 7–9]. The system
presented herein undertakes subject authentication, whereas
a biometric identification has been the target of those works.
Moreover, they present some results on the employment of
EEG as person identification cue [4, 5, 7–9], what herein be-
comes a stand-alone system.
A reduced number of electrodes have been already used
in past works [4, 5, 7–9] in order to improve the system un-
obtrusiveness. This fact has been mimed in our system. There
is however a differential trait. The two forehead electrodes are
used in our system, while in other papers other electrodes
configurations are used, for example, [5] uses electrode P4.
Our long-term goal is the integration of the biometric system
with the ENOBIO wireless sensory unit [23, 24]. ENOBIO
uses dry electrodes, avoiding the usage of conductive gel and
therefore improving the user friendliness. For achieving this
goal employing electrodes in no hair areas becomes manda-
tory, a condition our system fulfils.
Lastly, performance evaluation is worth mentioning. Al-
though we present an authentication system, we have con-
ducted some identification experiments for the sake of com-
parison with already presented works [4, 5, 7–9]. The sys-
tem presented herein shows a better performance by a larger
number of test subjects. This question is further analyzed.
In the following sections, the used authentication
methodology will be presented. Section 2 presents the EEG
recording protocol and the data preprocessing. Section 3
deals with the features extracted from the EEG sig-
nal. Section 4 describes the authentication methodology,
Section 5 the results; and finally conclusions are drawn in
Section 6.
2. EEG RECORDING AND PREPROCESSING
For this study, an EEG database recorded at FORENAP,
France, has been used. The database is composed of record-
ings of 51 subjects with 4 takes recorded on different days,
and 36 subjects with only one take. All subjects were healthy
adults between 20 and 45 years. The delay between the 1st
and the 4th recording is 34
± 74 days, whereby the medium-
term stability of the system will be tested. The recording con-
ditions were the same for all subjects: they were seated on an
armchair in a dark room, with closed eyes and were asked
neither to talk nor to move, and to relax. The recording du-
ration was between 2 and 4 minutes. Only the 2 forehead
electrodes (FP1 and FP2) were used for authentication; and
an additional electrode that was placed in the left ear lobe
was used as reference. The decision of using the frontal elec-
trodes is due to projective integration with the ENOBIO sys-
tem, which was presented in the former section. Indeed, the
forehead is the most comfortable place where EEG can be
measured.
The sampling rate for data acquisition was 256 Hz. A
second-order pass band filter with cut frequencies 0.5 and
70 Hz was applied as the first preprocessing stage. A narrow
notch filter at 50 Hz was additionally applied.
Once the filters were applied, the whole signal was cut
in 4-second epochs. Artefacts were kept, in order to ensure
that only one minute of EEG data will be used for testing the
system.
3. FEATURES EXTRACTION
Among a large initial set of features (Higuchi fractal dimen-
sion, entropy, skewness, kurtosis, standard deviation, etc.),
the five ones that show a higher discriminative power in the
conducted preliminary works were used. These five different
features were extracted from each 4-second epoch. These fea-
ture vectors are the ones that we will input in our classifiers.
We can distinguish between two major types of features:
those extracted from a single channel (single channel fea-
tures) and those that relate two different channels (the syn-
chronicity features).
Autoregression (AR) and Fourier transform (FT) are ex-
amples of single channel features. They are calculated for
each channel without taking into account the other one.
These features have been used for EEG biometry in previous
studies [1–10].
Mutual information (MI), coherence (CO), and cross-
correlation (CC) are examples of two-channel features re-
lated to synchronicity [19–21]. They represent some joined
characteristic of the two channels involved in the computa-
tion. This type of features is used for the first time in an EEG
biometry system.
All the mentioned features are simultaneously computed
in the biometry system presented herein. This is what we de-
note as the multifeature set. This set will be fused in subse-
quent stages of the system. The features are described in more
detail in the following subsections.
3.1. Autoregression
The EEG signal for each channel is assumed to be the out-
put of an autoregressive system driven by white noise. We use
the Yule-Walker method, also known as the autocorrelation
method, to fit a pth-order AR model to the windowed input
signal, X(t), by minimizing the forward prediction error in a
least-square sense. This formulation leads to the Yule-Walker
equations, which are solved by the Levinson-Durbin recur-
sion. The AR model is represented by
X(t)
=
p
i=1
a(i)X(t − i)+e(t). (1)
A. Riera et al. 3
In this model, the time series are estimated by a linear dif-
ference equation in the time domain, where a current sample
of the signal X(t) is a linear function of p previous samples
plus an independent and identically distributed (i.i.d) white
noise input e(t). The average variance estimate of e(t) is 0.75
computed for all the subjects. a(i) are the autoregression co-
efficients. Preliminary results have shown the convenience of
using an AR model with order 100.
3.1.1. Fourier transform
The well-known discrete Fourier transform (DFT), with ex-
pression
X(k)
=
N
j=1
x( j)w
(j−1)(k−1)
N
,(2)
where
w
N
= e
(−2πi)/N
(3)
is the Nth root of unity, is used herein to compute the DFT
of each epoch. In our case, N is equal to 1024 (256 Hz
∗4sec-
onds). We retain thence the frequency band from 1 to 40 Hz
so that all EEG bands of interest are included: delta, theta,
alpha, beta, and gamma.
3.1.2. Mutual information
In probability theory and information theory, the mutual in-
formation (MI), also known as transinformation [12, 21], of
two random variables, is a quantity that measures the mutual
dependence of the two variables. The most common unit of
measurement of MI is the bit, when logarithms of base 2 are
used in its computation. We tried different numbers of bits
for coding the signal, choosing 4 as the optimal value for our
classification purposes.
The MI has been defined as the difference between the
sum of the entropies within two channels’ time series and
their mutual entropy.
3.1.3. Coherence
The purpose of the coherence measure is to uncover the
correlation between two time series at different frequencies
[19, 20]. The magnitude of the squared coherence estimate,
which is a frequency function with values ranging from 0 to
1, quantizes how well x corresponds to y at each frequency.
The coherence Cxy(f ) is a function of the power spectral
density (Pxx and Pyy)ofx and y and the cross-power spectral
density (Pxy)ofx and y, as defined in the following expres-
sion:
C
xy
( f ) =
P
xy
( f )
2
P
xx
( f )P
yy
( f )
. (4)
In this case, the feature is represented by the set of points
of the coherence function.
3.1.4. Cross-correlation
The well-known cross-correlation (CC) is a measure of the
similarity of two signals, commonly used to find occurrences
of a known signal in an unknown one. It is a function of the
relative delay between the signals; it is sometimes called the
sliding dot product, and has applications in pattern recogni-
tion and cryptanalysis.
We calculate three CCs for the two input signals:
(i) Ch1 with itself: ρX,
(ii) Ch2 with itself: ρY,
(iii) Ch1 with Ch2: ρXY.
The correlation ρXY between two random variables x
and y with expected values μ
X
and μ
Y
and standard devia-
tions σ
X
and σ
Y
is defined as
ρ
X,Y
=
cov(X, Y)
σ
X
σ
Y
=
E
X − μ
X
Y −μ
Y
σ
X
σ
Y
,(5)
where
(i) E() is the expectation operator,
(ii) cov() is the covariance operator.
In this case, the features are represented by each point
of the three calculated cross-correlations. This feature is re-
ferred to as CC in the following section.
4. AUTHENTICATION METHODOLOGY
The work presented herein is based on the classical Fisher’s
discriminant analysis (DA). DA seeks a number of projec-
tion directions that are efficient for discrimination, that is,
separation in classes.
It is an exploratory method of data evaluation performed
as a two-stage process. First the total variance/covariance ma-
trix for all variables, and the intraclass variance/covariance
matrix are taken into account in the procedure. A projec-
tion matrix is computed that minimizes the variance within
classes while maximizing the variance between these classes.
Formally, we seek to maximize the following expression:
J(W)
=
W
t
S
B
W
W
t
S
W
W
,(6)
where
(i) W is the projection matrix,
(ii) S
B
is between-classes scatter matrix,
(iii) S
W
is within-class scatter matrix.
For an n-class problem, the DA involves n − 1 dis-
criminant functions (DFs). Thus a projection from a d-
dimensional space, where d is the length of the feature vec-
tortobeclassified,intoan(n
−1)-dimensional space, where
d
≥ n, is achieved. In our algorithm, we work with 4 different
DFs:
(i) linear: fits a multivariate normal density to each group,
with a pooled estimate of the covariance;
(ii) diagonal linear: same as “linear,” except that the co-
variance matrices are assumed to be diagonal;
4 EURASIP Journal on Advances in Signal Processing
(iii) quadratic: fits a multivariate normal density with co-
variance estimates stratified by group;
(iv) diagonal quadratic: same as “quadratic,” except that
the covariance matrices are assumed to be diagonal.
The interested reader can find more information about
DA in [13].
Taking into account the 4 DFs, the 2 channels, the 2 single
channel features, and 3 synchronicity features, we have a total
of 28 different classifiers. Here, we mean by classifier, each of
the 28 possible combinations of feature, DF, and channel.
We use an approach that we denote as “personal classi-
fier,” which is explained herein, for the identity authentica-
tion case: the 5 best classifiers, that is, the ones with more
discriminative power, are used for each subject. When a test
subject claims to be, for example, subject 1, the 5 best clas-
sifiers for subject 1 are used to do the classification. In order
to select the 5 best classifiers for the 51 subjects with 4 EEG
takes, we proceed as follows. We use the 3 firsts takes of the
51 subjects for training each classifier, and the 4th take of
a given subject is used for testing it. We repeat this process
making all possible combinations (using one take for testing
and the others for training). Each time we do this process, we
obtain a classification rate (CR): number of feature vectors
correctly classified over the total number of feature vectors.
The total number of feature vectors is around 45, depending
on the duration of the take. Once this process is repeated for
all 28 classifiers, we compute a score measure on them, which
can be defined as
score
=
average(CR)
standard deviation(CR)
. (7)
The 5 classifiers with higher scores out of the 28 possible
classifiers are the selected ones. We repeat this process for the
51 subjects.
Once we have the 5 best classifiers for all 51 subjects, we
can then implement and test our final application. We now
proceed in a similar way, but we only use in each test the
first or the second minute of a given take, that is, we input in
each one of the 5 best classifiers 15 feature vectors. Each clas-
sifier outputs a posterior matrix (Table 1 ). In order to fuse
the results of the 5 classifiers, we vertically concatenate the
5 obtained posterior matrices and take the column average.
The resulting vector is the one we will use to take the authen-
tication decision (in fact it is a probability density function
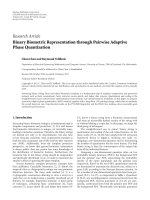
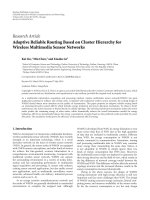
(PDF); see Figures 1(a) and 1(b), where the 1st element is
the probability that the single minute test data comes from
subject 1 and the 2nd element is the probability that the sin-
gle minute test data comes from subject 2, and so forth.
The last step in our algorithm takes into consideration
a decision rule over the averaged PDF. We use two differ-
ent thresholds. The first one is applied on the probability of
the claimed subject. The second threshold is applied on the
signal-to-noise ratio (SNR) of the PDF, which we define as
SNR
i
=
P
2
x
i
/x
i
∈ C
i
j=i
P
2
x
j
/x
j
∈ C
j
,(8)
where P(x
i
/x
i
∈ C
i
) is the probability that the single minute
test data comes from.
5. RESULTS
In the first part of this section, we provide the results for our
authentication system. Then, for the sake of comparison with
related works, which only deal with identification, we also
provide the results of a simplified version of the “personal
classifier” approach. This approach works as an identification
system, that is, the claimed identity of the user is not taken
into consideration as an input.
5.1. Authentication system results
Three different tests have been undertaken on our EEG-
based biometric system in order to evaluate its classification
performance:
(i) legal test: a subject belonging to thedatabase claims his
real identity,
(ii) impostor test: a subject belonging to thedatabase
claims the identity of another subject belonging to the
database,
(iii) intruder test: a subject who does not belong to the
database claims the identity of a subject belonging to
the database.
We have used the data of the 51 subjects with 4 takes
in the database for the legal and the impostor tests. For the
intruder test, the 36 subjects with 1 take have been applied
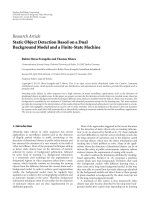
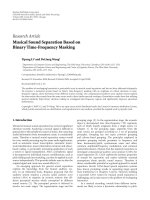
to the system. An easy way to visually represent the sys-
tem performance is the classification matrices (Figures 2(a)
and 2(b)). These are defined by entries c
ij
, which denote the
number of test feature vectors from subject i classified as sub-
ject j.
Taking into account that we have 4 test takes, and that
we use both the first and the second minutes for testing, we
have 4
∗2∗51 = 408 legal situation trials (N
leg
). In the case
of the impostor situation, we have also 4 takes, we also use
the first and the second minutes of each take, we have 51 im-
postors that are claimed to be the other 50 subjects from the
database. Therefore, we have 4
∗2∗51∗50 = 20,400 impos-
tor situation trials (N
imp
). For the intruder situation, we have
1 test take from which we only use the first minute, so we
have 1
∗1∗36∗51 = 1,836 intruder situation trials (N
int
). We
use the true acceptance rate (TAR) and the false acceptance
rate (FAR) as performance measures of our system. They are
defined for each individual subject in each trial situation as
following:
TAR
i
=
c
ii
N
j
=1
c
ij
,
FAR
i
=
N
j
=1
c
ji
N
j
=1
N
k
=1
c
jk
∀j=i,
(9)
where c
ij
denote the classification matrix entries as defined
in the previous section, N the number of subjects for each
trial situation, either legal/impostor (N
= 51) or intruders
(N
= 36). It is worth mentioning that for this second case, no
TAR
i
can be defined.
A. Riera et al. 5
Table 1: Posterior matrix of the 15 FT feature vectors extracted from one minute EEG recording of subject 1. Each row represents the
probabilities assigned to each class for each feature vector. We see that the subject is well classified as being subject 1 (refer to the last row).
Notice that this posterior matrix represents a 9-class problem and our work is done for a 51 class problem.
Classified as Subject 1 Subject 2 Subject 3 Subject 4 Subject 5 Subject 6 Subject 7 Subject 8 Subject 9
Test10.460.28000.230000
Test 2 0.40 0.24 0 0 0.11 0 0 0 0.23
Test30.9900000000
Test40.9900000000
Test50.9900000000
Test60.910.010.0400000.040
Test70.9900000000
Test80.990.010000000
Test90.9600.02000000
Test100.9900000000
Test110.160.0400000.2500.53
Test120.530.350000000.11
Test130.920.070000000.01
Test140.9900000000
Test15100000000
Average 0.81 0.07 0.01 0 0.03 0 0.02 0 0.06
0
0.05
0.1
0.15
0.2
0.25
0.3
0.35
0.4
0.45
0.5
Probability
5 101520253035404550
Subjects number id
(a)
0
0.05
0.1
0.15
0.2
0.25
0.3
0.35
0.4
0.45
0.5
Probability
5 101520253035404550
Subject number id
(b)
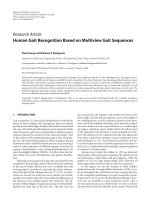
Figure 1: PDF for normal situation for subject 10 (a) and for intruder situation (b). In (a), notice that if a probability threshold is set to
0.15, subject 10 will be authenticate only if he claims to be subject 10. In (a), the intruder would not be authenticated in any case.
The general system TAR is computed as the average over
all subjects:
TAR
=
1
N
N
i=1
TAR
i
. (10)
The general FAR can be computed in an analogous man-
ner for the two different groups of impostors (N
= 51) and
intruders (N
= 36).
As it can be observed, we get two different FAR measures
for the impostor and the intruder cases. These two measures
are weighted averaged in order to obtain a unique FAR mea-
sure as follows:
FAR
=
N
imp
N
imp
+ N
int
FAR
imp
+
N
int
N
imp
+ N
int
FAR
int
, (11)
where FAR
imp
is the average of FAR
i
over the 51 impostors,
FAR
int
is the average of FAR
i
over the 36 intruder
We finally obtain an equal error rate (EER) measure
that equals 3.4%. This value is achieved for a probability
threshold equal to 0.02 and an SNR threshold equal to 2.36.
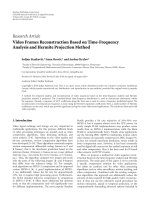
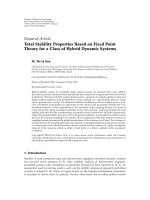
In Figure 3, we can see the behavior of TAR and FAR for
6 EURASIP Journal on Advances in Signal Processing
50
45
40
35
30
25
20
15
10
5
Claimed subject
5 101520253035404550
Legal/impostor subject
7
6
5
4
3
2
1
(a)
50
45
40
35
30
25
20
15
10
5
Claimed subject
5 101520253035
Intruder subject
Intruder case prob
= 0.02 SNR = 2.36 test take = 1
test block
= 1FAR= 6.8627
(b)
Figure 2: Classification matrices. The subjects in the x axes claim to be all the subjects from the database. In (a), we see that the diagonal
is almost full. These are the cases where a subject truthfully claims to be himself. The off-diagonal elements represent the impostor cases.
Note that we are showing the results of the 8 possible test trials together. In (b), the intruder cases are shown. Only one trial was made per
intruder.
1
3
5
7
9
11
Percentage
11.522.53
SNR threshold
100-TAR
FAR
Figure 3: Behavior of TAR and FAR for a fixed probability threshold
of 0.02 and modifying the SNR threshold for the “authentication
mode.” The intersection of the two curves is the EER.
different SNR thresholds (with probablitiy thresholds fixed
to 0.02).
Depending on the security level, different thresholds can
be applied in order to make the system more inaccessible for
intruders, but this would also increase the number of legal
subjects that are not authenticated as shown in Figure 3.
5.2. Comparison in an identification task
It is easy to slightly modify the described system to work in
an identification mode. Indeed, this “identification mode” is
a simplification of the authentication one. Rather than using
personalized classifiers for each subject, what we do now is to
use the same 16 classifiers for all the subjects. Those classifiers
are the ones that have more discriminative power among all
subjects. They are given in the Table 2.
It is worth pointing out that a trivial classifier would yield
a CR equal to 0.0196 (i.e., 1/number of classes, which in our
case is 51). Moreover, the results obtained after fusing the dif-
ferent classifiers significantly improve the performance of the
identification system as depicted in Figure 4. This improve-
ment of performance is also achieved in the “authentication
mode.”
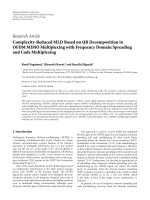
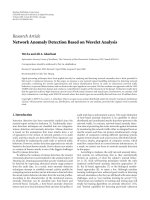
Figure 4 shows the behavior of the TAR and FAR for our
system in “identification mode.” We can see that 3 different
operating points are marked. Those are the values we will use
for the comparison.
Ta ble 2 shows several results from other works along with
the results of our current work, in 3 different operating
points.
6. DISCUSSION AND CONCLUSIONS
An authentication biometric system based on EEG, using 2
frontal electrodes plus 1 reference placed at the left ear lobe,
is described in this paper. The tested subject has to sit, close
her eyes, and relax during one minute of EEG recording. The
only inputs to the system are the one-minute EEG recording
and the claimed identity of the subject. The output is a binary
decision: authenticated or not. This authentication system
A. Riera et al. 7
Table 2: Classification rate for the sixteen best classifiers used for all subjects in the “identification mode.”
Feat D.Fun Ch CR Feat D.Fun Ch CR
ff lin 2 0.42 ar lin 2 0.34
ff lin 1 0.41 ar lin 1 0.29
ff quad 1 0.40 cc lin — 0.31
ff quad 2 0.39 co lin — 0.24
ff diaglin 2 0.36 mi lin — 0.24
ff diagquad 2 0.36 cc quad — 0.23
ff diaglin 1 0.35 co quad — 0.21
ff diagquad 1 0.35 mi quad — 0.19
Table 3: EEG identification results extracted from literature and from our present work.
Study
No. of subjects No. of leads
Performance (classifica-
tion rate)
TAR FAR
Poulos et al. (1999) [7]
4(+75intruders) 2
95%
65% 16.9%
Poulos et al. (2001) [8]
4(+75intruders) 2
80–100%
92.9% 13.6%
Poulos et al. (2002) [9]
4(+75intruders) 2
76–88%
79% 19.8%
Paranjape et al. (2001) [5]
40 2
79–85%
-not available- -not available-
Mohammadi et al. (2006) [4]
10 2 or 3
80–97% single channel
85–100% multi channel
-not available- -not available-
Present paper (op1)
51 (+36 intruders) 3
98.1%
99% 14.3%
Present paper (op2)
51 (+36 intruders) 3
95.1%
94.5% 5.5%(EER)
Present paper (op3)
51 (+36 intruders) 3
87.5%
88.7% 2%
0
2
4
6
8
10
12
14
16
18
20
Percentage
0.511.522.5
SNR threshold
100-TAR
FAR
op’s
0.75
1.42.4
Figure 4: Behavior of TAR and FAR for a fixed probability thresh-
old of 0.02 and modifying the SNR threshold for the “identification
mode.” The intersection of the two curves is the EER. Three operat-
ing points (up) have been chosen at different SNR thresholds (0.75,
1.4, and 2.4)
demonstrates to outperform the same system in “identifica-
tion mode” (EER
= 3.4% versus EER = 5.5%). The “identi-
fication mode” is adopted only to compare with precedent
studies [4, 5, 7–9], since they deal only with identification.
The results of our system in “identification mode” outper-
form precedent works even though a larger database has been
used to test our system. Intruders have also been used to test
the intruder detection.
We consider that the more innovative point in this study
is the use of several features and the way they are personalized
and fused for each subject. We focus on extracting the maxi-
mum possible information from the test takes, taking care of
the unobtrusiveness of the system: with only one minute of
recording, using only the two forehead channels, we obtain
28 different classifiers, from which the 5 ones with more dis-
criminative power for each subject are selected. In order to
have an even more reliable system, a multimodal approach
would probably increase the performance considerably. We
are investigating the possibility of applying an electrocardio-
gram (ECG)-based biometry simultaneously to the EEG [14–
18]. Combining EEG and ECG biometric modalities seems
to be very promising and will be discussed in a follow-up
paper.
Another possible application that we are researching is
whether the emotional state (stress, sleepiness, alcohol, or
drug intake) can be extracted from EEG and ECG. In this
case, besides the authentication of the subject, we could un-
dertake his initial state validation. This would be a very in-
teresting application for workers of critical or dangerous en-
vironments.
Finally, the usage of less than one minute of EEG data
recording is being studied in order to make the system less
obtrusive. This condition will be improved as well with the
ENOBIO sensory integration.
8 EURASIP Journal on Advances in Signal Processing
ACKNOWLEDGMENTS
The authors wish to acknowledge the HUMABIO project
(funded by FP6: FP6-2004-IST-4-026990) in which Starlab
is actively involved and thank FORENAP, France, which is
another active partner in HUMABIO, for providing the large
EEG database used in this study.
REFERENCES
[1] S.E.Eischen,J.Y.Luckritz,andJ.Polich,“Spectralanalysisof
EEG from families,” Biological Psychology, vol. 41, no. 1, pp.
61–68, 1995.
[2] N. Hazarika, A. Tsoi, and A. Sergejew, “Nonlinear considera-
tions in EEG signal classification,” IEEE Transactions on Signal
Processing, vol. 45, no. 4, pp. 829–836, 1997.
[3] S. Marcel and J. Mill
´
an, “Person authentication using brain-
waves (EEG) and maximum a posteriori model adaptation,”
Tech. Rep. 81, p. 11, IDIAP Research Report, Valais, Switzer-
land, 2005.
[4] G. Mohammadi, P. Shoushtari, B. Ardekani, and M. Shamsol-
lahi, “Person identification by using AR model for EEG sig-
nals,” in Proceedings of the 9th International Conference on Bio-
engineering Technology (ICBT ’06), p. 5, Czech Republic, 2006.
[5] R. B. Paranjape, J. Mahovsky, L. Benedicenti, and Z. Koles,
“The electroencephalogram as a biometric,” in Proceedings of
Canadian Conference on Electrical and Computer Engineering,
vol. 2, pp. 1363–1366, Toronto, Canada, May 2001.
[6] M. Poulos, M Rangoussi, and E. Kafetzopoulos, “Person iden-
tification via the EEG using computational geometry algo-
rithms,” in Proceedings of the 9th European Signal Processing,
(EUSIPCO ’98), pp. 2125–2128, Rhodes, Greece, September
1998.
[7] M. Poulos, M Rangoussi, V Chrissikopoulos, and A. Evan-
gelou, “Parametric person identification from EEG using
computational geometry,” in Proceedings of the 6th Interna-
tional Conference on Electronics, Circuits and Systems (ICECS
’99), vol. 2, pp. 1005–1008, Pafos, Cyprus, September 1999.
[8]M.Poulos,M.Rangoussi,N.Alexandris,andA.Evangelou,
“On the use of EEG features towards person identification
via neural networks,” Medical Informatics & the Internet in
Medicine, vol. 26, no. 1, pp. 35–48, 2001.
[9]M.Poulos,M.Rangoussi,N.Alexandris,andA.Evangelou,
“Person identification from the EEG using nonlinear signal
classification,” Methods of Information in Medicine, vol. 41,
no. 1, pp. 64–75, 2002.
[10] A. Remond, Ed., EEG Informatics. A didactic review of meth-
ods and applications of EEG data processing, Elsevier Scientific
Publishing Inc, New York, NY, USA, 1997.
[11] N. E. Sviderskaya and T. A. Korol’kova, “Genetic features of
the spatial organization of the human cerebral cortex,” Neuro-
scie nce and Behavioral Physiology, vol. 25, no. 5, pp. 370–377,
1995.
[12] M. Deriche and A. Al-Ani, “A new algorithm for EEG feature
selection using mutual information,” in Proceedings of IEEE In-
ternational Conference on Acoustics, Speech and Signal Process-
ing (ICASSP ’01), vol. 2, pp. 1057–1060, Salt Lake, Utah, USA,
May 2001.
[13] R.Duda,P.Hart,andD.Stork,Pattern Classification,JohnWi-
ley & Sons, New York, NY, USA, 2001.
[14] L. Biel, O. Pettersson, L. Philipson, and P. Wide, “ECG analysis:
a new approach in human identification,” IEEE Transactions
on Instrumentation and Measurement, vol. 50, no. 3, pp. 808–
812, 2001.
[15] C. K. Chang, “Human identification using one lead ECG,”
M.S. thesis, Department of computer science and information
engineering. chaoyang university of technology, Taiwan, 2005.
[16] S. Israel, J. Irvine, A. Cheng, M. Wiederhold, and B. Wieder-
hold, “ECG to identify individuals,” Pattern Recognition,
vol. 38, no. 1, pp. 133–142, 2005.
[17] M. Kyoso, “Development of an ECG identification system,”
in Proceedings of the 23rd Annual International IEEE Confer-
ence on Engineering in Medicine and Biology Society,Istanbul,
Turkey, October 2001.
[18] R. Palaniappan and S. M. Krishnan, “Identifying individuals
using ECG beats,” in Proceedings of International Conference on
Signal Processing and Communications(SPCOM ’04), pp. 569–
572, Banalore, India, December 2004.
[19] G. Winterer, M. Smolka, J. Samochowiec, et al., “Association
of EEG coherence and an exonic GABA(B)R1 gene polymor-
phism,” American Journal of Medical Genetics, vol. 117, no. 1,
pp. 51–56, 2003.
[20] M. Kikuchi, Y. Wada, Y. Koshino, Y. Nanbu, and T. Hashimoto,
“Effect of normal aging upon interhemispheric EEG coher-
ence: analysis during rest and photic stimulation,” Clinical
EEG Electroencephalography, vol. 31, no. 4, pp. 170–174, 2000.
[21] R. Moddemeijer, “On estimation of entropy and mutual infor-
mation of continuous distributions,” Signal Processing, vol. 16,
no. 3, pp. 233–248, 1989.
[22] A. Ross and A. Jain, “Information fusion in biometrics,” Pat-
tern Recognition Letters, vol. 24, no. 13, pp. 2115–2125, 2003.
[23] G. Ruffini, S. Dunne, E. Farr
´
es, et al., “A dry electrophysiology
electrode using CNT arrays,” Sensors and Actuators, A: physi-
cal, vol. 132, no. 1, pp. 34–41, 2006.
[24] G. Ruffini, S. Dunne, E. Farr
´
es, et al., “ENOBIO dry electro-
physiology electrode; first human trial plus wireless electrode
system,” in Proceedings of the 29th IEEE EMBS Annual Interna-
tional Conference, Lyon, France, August 2007.