Báo cáo hóa học: " Research Article Classification of Hazelnut Kernels by Using Impact Acoustic Time-Frequency Patterns" pot
Bạn đang xem bản rút gọn của tài liệu. Xem và tải ngay bản đầy đủ của tài liệu tại đây (4.76 MB, 11 trang )
Hindawi Publishing Corporation
EURASIP Journal on Advances in Signal Processing
Volume 2008, Article ID 247643, 11 pages
doi:10.1155/2008/247643
Research Article
Classification of Hazelnut Kernels by Using Impact Acoustic
Time-Frequency Patterns
Habil Kalkan,
1
Nuri Firat Ince,
2
Ahmed H. Tewfik,
2
Yasemin Yardimci,
1
and Tom Pearson
3
1
Informatics Institute, Middle East Technical University, 06531 Ankara, Turkey
2
Department of Electrical and Computer Engineering, University of Minnesota, MN 55455, USA
3
Agricultural Research Service, United States Department of Agriculture, KS 66502, USA
Correspondence should be addressed to Yasemin Yardimci,
Received 17 January 2007; Revised 7 July 2007; Accepted 8 October 2007
Recommended by Hugo Van hamme
Hazelnuts with damaged or cracked shells are more prone to infection with aflatoxin producing molds (Asperg illus flavus). These
molds can cause cancer. In this study, we introduce a new approach that separates damaged/cracked hazelnut kernels from good
ones by using time-frequency features obtained from impact acoustic signals. The proposed technique requires no prior knowledge
of the relevant time and frequency locations. In an offline step, the algorithm adaptively segments impact signals from a training
data set in time using local cosine packet analysis and a Kullback-Leibler criterion to assess the discrimination power of different
segmentations. In each resulting time segment, the signal is further decomposed into subbands using an undecimated wavelet
transform. The most discriminative subbands are selected according to the Euclidean distance between the cumulative probability
distributions of the corresponding subband coefficients. The most discriminative subbands are fed into a linear discriminant
analysis classifier. In the online classification step, the algorithm simply computes the learned features from the observed signal
and feeds them to the linear discriminant analysis (LDA) classifier. The algorithm achieved a throughput rate of 45 nuts/s and a
classification accuracy of 96% with the 30 most discriminative features, a higher rate than those provided with prior methods.
Copyright © 2008 Habil Kalkan et al. This is an open access article distributed under the Creative Commons Attribution License,
which permits unrestricted use, distribution, and reproduction in any medium, provided the original work is properly cited.
1. INTRODUCTION
Tree nuts are extensively used in the food industry. Environ-
mental conditions and processing procedures may decrease
nut quality by causing cracks or damage to the shell. Dam-
age to the shell of the nut kernel increases the likelihood
that fungi will infect the kernels. Fungal infestation can cause
aflatoxin formation, which is a type of mycotoxin that is
linked to various health problems including liver cancer [1].
Therefore, nuts with shell damage should be separated from
nuts with regular shells. This same problem affects many
different types of tree nuts such as almonds, pecans, hazel-
nuts, pistachio nuts, and so on. Initial attempts at separa-
tion of fungal damaged food items from undamaged ones go
back to the studies of Pearson [2]. For pistachio nuts, Pear-
son showed that nearly all the aflatoxin contaminated pista-
chios are either caused by bird damage or insects before har-
vesting or due to early split. Pearson [3] used a machine vi-
sion system to classify pistachio nuts into 3 categories such as
stained (caused by early splitting), unstained, or moderately
stained, with an average classification error of 11%. After re-
moving stained pistachio nuts from unstained ones, the afla-
toxin contamination level of pistachio nut is reduced from
4.8–8.6 range to 0.04–2.5 ppb [4].
In another application of tree nut sorting, a high speed
sorter based on impact acoustics was developed to sepa-
rate the pistachio nuts with closed shells from the ones with
cracked shells by using the features that were extracted from
impact sound signals [5]. This system was improved by us-
ing the eigenvalues of mel-cepstrum coefficients and sound
amplitudes [6] resulting in a classification accuracy of 97.8%.
While this system was primarily designed for separating open
and closed shell pistachio nuts, it was shown to provide a fea-
sible method for detecting hazelnuts with cracked shells [7]
as well.
Hazelnut quality in the market is mainly measured by
the ratio of inner kernel weight to the shell weight. Hence
farmers separate the empty hazelnuts from fully developed
ones before selling the nuts. A mechanical device working
with an air fan is used for this purpose. The air fan deflects
2 EURASIP Journal on Advances in Signal Processing
the hazelnuts with lower weight and the rest of the hazel-
nuts are accepted as fully developed. This system is unable
to determine the nuts with cracked shells because hazel-
nuts with cracked shell have weights that are very similar
to hazelnuts with regular shell. The acoustic sorter system
described above is used to separate empty hazelnuts from
fully developed nuts in [7] and 97.5% of these hazelnuts
are correctly classified by using 70 features. These features
are extracted from the short time variances of signal seg-
ments, maximum signal amplitude, spectral peak locations,
and the parameters of a Weibull distribution approxima-
tion of the envelope of the impact signal parameters. The
same features were used for cracked and regular shell hazel-
nut separation and 94.47% classification accuracy was ob-
tained. However, this type of algorithm is computationally
complex and therefore hard to implement in real time. The
results obtained in [7] show the importance of time and
frequency features in impact acoustics classification. In or-
der to reduce computational complexity and achieve error
rates similar to [7], we recently used an undecimated wavelet
transform to classify hazelnuts with regular shell and cracked
shell [8]. The most discriminative subbands are manually se-
lected and their energies are used for classification in [8]. A
91.8% classification rate is achieved with nearly 20 features.
Although the computational complexity is reduced with this
approach, the classification accuracy is poor compared to
[7].
In this study, we propose an adaptive time-frequency (t-
f ) analysis approach based on a local discriminant basis al-
gorithm similar to that used in [9–11] to select the most rel-
evant time segments and subbands to maximize classifica-
tion performance. For this purpose, we combine local cosine
packets and wavelet transform which are subsequently used
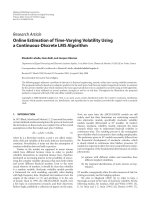
for time and frequency plane feature selection. A schematic
diagram summarizing our approach is given in Figure 1.
In particular, the local cosine packet analysis is used along
the time axis with a pyramidal tree to segment the signals
such that the spectral distances in the selected time windows
are maximized between classes. A Kullback-Leibler distance
was used to estimate the distance between the spectrum of
cracked and undamaged hazelnut acoustics. In the next step
in each selected time segment, an undecimated wavelet trans-
form is implemented to select the most discriminant sub-
bands. Unlike the algorithm proposed in [10, 11] that uses
fixed frequency bands, we enhance the frequency axis seg-
mentation by using an undecimated wavelet transform in
each adapted time segment. Accordingly, the proposed tech-
nique requires no prior knowledge of the relevant time and
frequency locations. All these segmentation procedures are
executed automatically in an offline manner. As a final step
the t- f features are sorted according to a cost function and
fed to a linear discriminant. In order to asses the efficiency
of different feature selection approaches, we compare two
different methods. In particular, the resulting t- f features
are sorted by using Fisher discrimination on the pruned tree
or processed by the correlation-based feature selection algo-
rithm of [12] implemented on the full tree. The features se-
lected by both algorithms are then fed into the linear discrim-
inant analysis classifier.
The paper is organized as follows. In the next section, the
data acquisition system and sample selection procedure are
given. The procedures for constructing the time-frequency
plane segmentations and the advantages of using undeci-
mated wavelet transform are described in Section 3.Exper-
imental results and conclusions are given in Sections 4 and 5,
respectively.
2. MATERIALS
2.1. System description
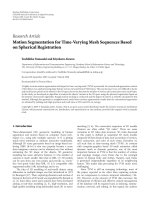
The impact acoustic recording system (Figure 2) consists of
a pipe, an impact plate, and a microphone. Hazelnut kernels
are dropped on an impact plate through the pipe. The im-
pact acoustic signal generated by the system is captured by
a microphone and processed by a PC. A stainless steel plate
with dimensions 7.5
×15 ×2 cm is used as the impact plate.
The impact plate is fixed to the ground at a 120
◦
angle. This
angle prevents the nuts from making multiple impacts. The
microphone is sensitive to frequencies up to 20 kHz and is
placed 5 cm from the impact plate. The impact acoustic sig-
nalissampledat44.1kHz.
2.2. Collection of samples
“Levant”-type hazelnuts collected from an orchard in Duzce,
Turkey, in August 2006, are used in this experimental study.
Developed hazelnuts are first selected by a standard air fan
system and resorted using their measured weights. Hazelnuts
less than 0.9 g are accepted as empty and removed from the
fully developed class. The shells of fully developed hazelnuts
are visually inspected and are further classified as nuts with
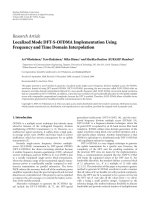
regular shell and nuts with cracked shell. Each selected hazel-
nut is dropped on the metal plate and the resulting acous-
tic signals (Figure 3) are recorded. Averaged time-frequency
maps of cracked and open hazelnut acoustics are given in Fig-
ures 3(c) and 3(d).
3. METHODS
Before explaining the details of the proposed signal process-
ing and classification system, let us summarize the overall al-
gorithm. The proposed method implements an offline learn-
ing step to extract the most discriminative time-frequency
features. This is achieved by first segmenting the training
signals along the time axis with a pyramidal tree. In par-
ticular, the segmentation is calculated by pruning the pyra-
midal tree from bottom to top to maximize the Kullback-
Leibler distance between the expansion coefficients of good
and cracked hazelnuts in each segment. The expansion coef-
ficients in each segment are obtained from local cosine pack-
ets that provide local spectral representations. Then, each
adapted time segment is decomposed into subbands by an
undecimated wavelet transform. The subbands are repre-
sented in a binary tree format and are pruned to find the
most discriminative subbands along the frequency axis. Fi-
nally a time-frequency map is computed by extracting the
Habil Kalkan et al. 3
Impact
acoustics
Time
Local cosine
packets-based
time segmentation
Undecimated wavelet-
based
subband selection
Offline learning
Frequency
Figure 1:Theblockdiagramoftheoffline learning step of the proposed algorithm.
Nut feeder
Impact plate
Microphone
Amplifier
Figure 2: Schematic of experimental apparatus for collecting
acoustic emissions from hazelnut kernel.
most relevant features. An LDA classifier is trained with these
features and tested using data that was not used for training.
The main contribution of the proposed approach is the
systematic and automatic extraction of the relevant features
during the training step so as to improve classification accu-
racy. In the remainder of this section we describe that step in
detail.
3.1. Local discriminant bases
In previous studies, impact acoustic classification is per-
formed by combining the features obtained from the time
and frequency domains as indicated in [7]. Here, we ex-
plore a different approach that is based on extracting fea-
tures from the time-frequency plane. The local discriminant
bases (LDBs) method was developed to extract such local
information [9] for classification. The LDB algorithm ba-
sically expands the signal by using wavelet packets or local
trigonometric bases over a pyramidal-binary tree as shown
in Figure 1. This tree is then pruned from bottom to top
to maximize a predefined cost function which measures the
discrimination power of each node. The pruning opera-
tion adapts the tree for classification task. The original al-
gorithm implements adaptation either in time or frequency.
It has been shown that adaptation along both axes is crucial
[10, 13]. Once the segmentation is accomplished the time-
frequency features are sorted according to a cost measure and
fed to a classifier for final decision. Since the time-frequency
plane is a high-dimensional space, a postprocessing step is
implemented by several authors to boost the classification
performance [10, 14]. Depending on the problem, this step
can be principal component analysis or a Mel-Scale-based
approach to get band features.
Here, we utilize the local cosine packets and wavelet
transform sequentially. As a first step to adapt to the tempo-
ral variability between the cracked and undamaged hazelnut
acoustics, we use local cosine packets which provide time axis
segmentation with smooth windows. Local cosine packets
are widely used in signal processing to segment signals with
time varying characteristic [15]. Once we obtain the time axis
segmentation, we use wavelet transform to select the most
relevant subbands for the final feature extraction. Since our
purpose is to discriminate between signals coming from dif-
ferent classes, we use a dissimilarity criterion to obtain the
segmentations along both the time and frequency axis. Now
let us describe the distance measure and algorithms used for
time and frequency segmentation in detail.
3.2. Dissimilarity measure
Various types of dissimilarity measures were tested and the
following ones were selected and used. Let p and q be the
spectral energy distributions of signals belonging to class1
and class2, respectively. The distance measure can be:
(i) the symmetric Kullback-Leibler distance, which is also
called J-divergence:
J(p, q)
= I(p, q)+I(q, p),
I(p, q)
=
n
i=1
p
i
log
p
i
q
i
,
(1)
or
(ii) Euclidean distance:
D(p, q)
=p −q
2
=
n
i=1
p
i
−q
i
2
. (2)
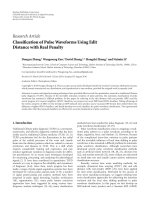
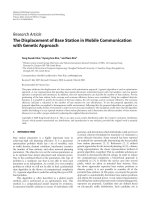
We have used the J criterion for time segmentation and
D for subband selection in each adapted segment. As shown
in Figure 4(a), the averaged spectrum of cracked and regular
hazelnut shells has most of its energy in midbands. However,
when the distance between these two spectra is calculated, we
noticed that the J criterion emphasizes higher bands more
than the D criterion. During our experimental studies, we
observed that the most discriminant locations are located in
higher frequency bands. Therefore, using J for time segmen-
tation provided better results.
4 EURASIP Journal on Advances in Signal Processing
0 50 100 150 200 250 300
Samples
−0.2
−0.1
0
0.1
0.2
ReH
(a)
0 100 200 300
Samples
−0.3
−0.2
−0.1
0
0.1
0.2
CrH
(b)
01234
Time (ms)
0
5
10
15
20
Frequency (KHz)
(c)
01234
Time (ms)
0
5
10
15
20
Frequency (KHz)
(d)
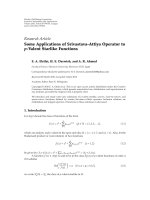
Figure 3: Typical impact acoustic signals of (a) fully developed hazelnuts with regular shell (ReH), (b) fully developed hazelnuts with cracked
shell (CrH), and averaged spectrogram of (c) ReH and (d) CrH signals.
3.3. Time segmentation with local cosine packets
The impact acoustic signals have different characteristics in
the impact, postimpact, and late impact phases. Therefore,
impact signals should be analyzed locally. In general, local
information of the signal is extracted by a short time Fourier
transform (STFT). Some researchers used local cosine pack-
ets (LCPs) because of its advantages over the STFT [9, 11].
Local cosine packets (LCPs) is preferred in this study and
used to partition the time axis in a pyramidal tree structure
of Figure 1.
Local cosine packets partition the time axis by using
smooth bells [15] that are constructed using cut-off func-
tions r(t) that satisfy
r
t
2
+
r(−t)
2
=
1 ∀ t ∈ R,
r(t)
=
0ift ≤−1,
1ift
≥ 1.
(3)
An example of such a function r(t) is
r(t)
=
⎧
⎪
⎪
⎪
⎨
⎪
⎪
⎪
⎩
0ift ≤−1,
sin
π
4
1 + sin
πt
4
if − 1 <t<1,
1ift
≥−1.
(4)
First, all signals are represented with local cosine packets
within smooth windows (as in (4) in the tree structure. The
resulting expansion coefficients are squared and then aver-
aged over the signals in the given class. This provides an av-
eraged energy spectrum of each class in a given time segment
within the pyramidal tree. Let p
i
and q
i
be the mean energy
spectra of cracked and regular classes, in a given time seg-
ment, respectively. The distance between the average spectra
is calculated with the criterion J where “n”in(1) corresponds
to the total number of time samples in a given node. This
way, the distance is accumulated along the spectrum within
Habil Kalkan et al. 5
0 5 10 15 20 25
Frequency (KHz)
0
0.5
1
1.5
2
2.5
3
Averaged magnitude
Cracked
Regular
(a)
0 5 10 15 20 25
Frequency (KHz)
0
0.2
0.4
0.6
0.8
1
Normalized discrimination power
D
J
(b)
Figure 4: (a) The averaged magnitude spectrum of cracked and regular hazelnut impact acoustic signals related to the first 128 samples.
(b) The J and D distance between two spectra.
If J
mother
≥ (J
child1
+ J
child2
) xϕ,
keep mother,
else
keep children.
Algorithm 1: Pruning algorithm.
all subspaces to get a single value representing each node
of the tree. The resulting binary tree is then pruned from
bottom to top according to the rule in Algorithm 1 to find
the nodes with maximum discrimination power:
Here J
mother
and J
child
are the discrimination power of
the mother and children nodes and are computed by the
Kullback-Leibler distance criteria and ϕ is an empirically se-
lected constant. It is experimentally found that ϕ
= 0.95 pre-
serves discriminative information while leading to robust
segmentation. The algorithm keeps the mother if it captures
95% of the discriminative power of the children, otherwise it
keeps the children.
3.4. Frequency segmentation
We have observed time jitter in the recorded signals which is
due to variances in the travel time to the steel plate. There-
fore, a shift invariant decomposition is highly desirable for
processing the signal. The importance of shift invariance for
classification is also emphasized in [9–11]. The undecimated
wavelet transform (UDWT) has the shift-invariance prop-
erty. It was first used for texture classification in [16]. In this
study, a similar approach is taken to analyze the impact sig-
nals for classification. A filter f(n) with a z-transform F(z)
that satisfies the quadrature mirror filter condition
F(z)F
z
−1
+ F(−z)F
−
z
−1
=
1(5)
is used to construct the pyramidal filter bank (Figure 5). The
high-pass filter g(n) is obtained by shifting and modulating
f(n). Specifically, the z transform of g(n) is chosen as
G(z)
= zF
−
z
−1
. (6)
The subsequent filters in the filter bank are then generated by
increasing the width of f(n) and g(n) at every step, for exam-
ple,
F
i+1
(z) = F
z
2
i
,
G
i+1
(z) = G
z
2
i
, i = 0, 1, , N.
(7)
In the signal domain, the filter generation can be expressed
as
f
i+1
(k) = [ f ]
↑2
i
,
g
i+1
(k) = [g]
↑2
i
,
(8)
where the notation []
↑m
denotes the up-sampling operation
by a factor of m.
The resulting filter bank of which the second level fre-
quency response is demonstrated at Figure 6 is used to ex-
tract the subband signals at the nodes. It is observed that the
signal has different energy distribution in each subband.
The Euclidean distance between cumulative probability
distributions (cdf) of subband energies in (2) is chosen as
the discriminative measure. We selected to use cdf over pdf
because it is easier to calculate. One can also use pdf instead.
The resulting pyramidal subband tree is pruned from bottom
to top by the rule, shown in Algorithm 2.
6 EURASIP Journal on Advances in Signal Processing
x(k)
F(z)
G(z)
x
L
(k)
x
H
(k)
F(z
2
)
G(z
2
)
F(z
2
)
G(z
2
)
x
LL
(k)
x
LH
(k)
x
HH
(k)
x
HL
(k)
Figure 5: Pyramidal filter tree up to second level. L and H stand for
low and high bands, respectively.
05.51 11.02 16.53 21.5
Frequency (kHz)
0
0.2
0.4
0.6
0.8
1
1.2
1.4
LL LH HL HH
Sub-bands
Figure 6: Frequency response of the 2nd level filters.
If d
mother
< max {d
child1
,d
child2
},
set max
{d
child1
,d
child2
} as mother,
else
remove children.
Algorithm 2: Pruning algorithm.
Where d
child1
and d
child2
are the Euclidian distances of
subbands nodes of mother node where as d
mother
is the dis-
tance of the mother node.
4. RESULTS
One thousand cracked and one thousand uncracked hazel-
nut kernels are used in this study. Each hazelnut is dropped
on the metal plate and the resulting acoustic signal consist-
ing of 768 time samples is recorded. We analyzed the signal
up to a tree depth of 4 resulting in a smallest segment size of
48 time samples in the time domain. We empirically found
that this level provides a healthy balance between focus on
to transient waveforms and the required spectral resolution
to distinguish between subbands with different behavior. The
signals were first represented by using LCP over the pyrami-
daltreestructure.Thepyramidaltreewasprunedbyusing
the algorithm of Section 3.3 and the adaptive time segmenta-
tion for classification purpose was obtained for different sets
of signals as indicated in Figure 7. It was observed that differ-
ent sets of signals may cause different segmentation in time.
We used the segmentation of Figure 7(a) in our simulations.
In this case, the time axis is divided into 7 segments.
In each time segment, the signal was decomposed into
subbands up to the 4th wavelet decomposition level and the
most relevant subbands were detected by using the proce-
dures of Section 3.4.
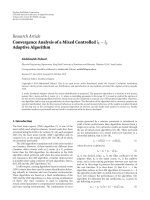
A discriminative time-frequency map was generated in
Figure 8 by combining the adaptively pruned trees both in
time and frequency to visualize the most crucial t- f patterns.
In our application, the algorithm usually generates a t- f map
with around 70 subbands for various training data sets. For
every signal in each training set, the energy value for each
subband was computed resulting in two sets of feature vec-
tors corresponding to cracked and healthy shell classes.
The 70 features obtained were sorted in descending or-
der according to their discrimination power and then used
for classification. Fisher’s discrimination measure is used for
feature selection. We observed with all training data sets that
the most discriminative feature locations were concentrated
in the high frequency bands corresponding to the early and
post impact regions as indicated in Figure 8. Among the 70
subbands, the 25 most discriminative ones are indicated by
different shades of gray, with darker shades corresponding to
higher discrimination levels.
4.1. Classification
In order to assess the efficiency of the proposed algorithm, a
comparison is made with the features of [7] and those fea-
tures of our previous work [8] which used nonadaptive sub-
bands and different order statistical features. Recall that in
[7], 70 features were extracted from the short time variances
of signal; maximum signal amplitude, spectral peak loca-
tions, and Weibull distribution fit to the envelope of the im-
pact signal and all are used for classification. In the subband-
based algorithm [8], features were extracted from subband
signals and the 20 most relevant features and the subbands
including these features were manually selected. The time
segmentation of Figure 7(a) is employed to obtain a total of
28 statistical features including mean absolute energy, vari-
ance, skewness, and kurtosis on each of the seven time seg-
ments.
The one thousand acoustic signals for each class are ran-
domly divided into 5 nonoverlapping sets, each consisting of
200 records. Five pairs of uncracked and cracked sets are then
randomly formed. Each pair is used to construct the adaptive
t- f segmentation and select features. The features identified
are then used with the remaining 1600 acoustic signals to de-
termine the performance of the classifier. This procedure is
repeated five times with the five different pairs of uncracked
and cracked sets.
Habil Kalkan et al. 7
100 200 300 400 500 600 700
Samples
−0.6
−0.4
−0.2
0
0.2
0.4
0.6
Amplitude
(a)
100 200 300 400 500 600 700
Samples
−0.6
−0.4
−0.2
0
0.2
0.4
0.6
Amplitude
(b)
Figure 7: The adaptive time segmentation grids (dotted lines) of (a) set1 and (b) set2.
0 100 200 300 400 500 600 700
Samples
Lbands
Hbands
Adaptively selected bands
Figure 8: The time-frequency discrimination map of impact acous-
tic data. Darker regions indicate higher discrimination power.
The optimal number of features for classification was in-
vestigated by adding features one by one according to Fisher’s
discrimination criterion. This step is repeated for all four
methods. Related classification error curves are presented in
Figure 9.
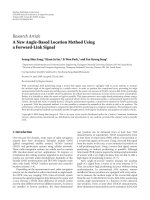
We noticed that the lowest classification error is achieved
with our proposed approach. The minimal classification er-
ror rates achieved by each method are given in Ta ble 1.
It is observed that the lowest error is achieved by the
first 64 features with an error level of 3.5% by our pro-
posed approach. For the method of [7], 43 out of 70 time
and frequency domain features provided the minimum er-
10 20 30 40 50 60 70
Number of features
0
2
4
6
8
10
12
14
16
18
20
Classification error (%)
Non-adaptive sub-band
Features of [7]
LDB features
Statistical features
Figure 9: The classification error rates with various numbers of fea-
tures.
ror level. Similarly, 20 nonadaptive subband features are
used for the method of [8]. The statistical features gave
poor classification error rates compared to other meth-
ods. The lowest error rate occurred when the first 7 fea-
tures are used. Our proposed approach reaches an error rate
around 4% after the first 30 features. Increasing the num-
ber of features provided marginal improvement of the error
rate.
The ROC curves for the three methods are presented in
Figure 10. It is observed that 64- and 30-dimensional LDB
features provide higher detection of cracked hazelnuts for a
given false alarm rate.
8 EURASIP Journal on Advances in Signal Processing
Table 1: Classification rate comparison of proposed LDB-based
method against the previously developed algorithms.
Method Accuracy(%)
43 features of method of [7] 94.47
7 statistical features 85.00
20 nonadaptive subband features 91.80
64 LDB-based feature 96.51
00.10.20.30.40.50.6
False positive
0.7
0.75
0.8
0.85
0.9
0.95
1
Tr u e p o si t i ve
20 non-adaptive sub-band
43 features of [7]
64 LDB features
30 LDB features
Figure 10: Receiver operating characteristics (ROCs) curves.
4.2. Filter selection
Various types of wavelet filters (Daubechies, Coiflet, and
Sym) are used for decomposition of the frequency axis,
and their effects on classification accuracy are observed.
In Figures 11(a) and 11(b), the classification accuracy of
DaubechiesandCoifletwaveletsisdepictedincontour
graphics format. The x-axis indicates the total number of
features retained after sorting. The y-axis indicates the fil-
ter type used in subband decomposition. The higher filter
types correspond to higher-order filters. The darker regions
in the contour graph give lower classification accuracy. It is
observed that better classification error rates (< 4%) are ob-
tained when approximately 40 or more features are retained
after decomposition with high-order wavelet filters (Db12–
Db15 and Coif3–Coif5). We selected one of the high-order
wavelet filters, Coiflet 4, for further analysis. The discrimi-
nant band distribution of Figure 8 may slightly change de-
pending on the wavelet filter.
4.3. Effect of noise on classification
In order to asses the robustness of our methods against dis-
turbing effects, a zero mean Gaussian noise at various SNR
levels is added to the signal, and classification performances
are compared as shown in Figure 12. It is observed that the
algorithm performs well for reasonable noise levels. The al-
gorithm usually selects low level subbands nodes when the
signals are disturbed by high-level noise. This can be justified
by fact that the energy of the impact acoustics is concentrated
in the mid and lower bands of the spectrum as indicated in
Figure 4. In order to keep the efficiency in classification, the
algorithm selects features from lower bands with increasing
noise level. This also results a decrease in classification accu-
racy.
4.4. Effect of shift-invariance to classification
As indicated in the previous sections the main motivation for
using UDWT against DWT is the shift invariance property of
the UDWT In order to justify our selection we compared the
UDWT results with those obtained from the DWT and spin-
cycle procedure of [17]. The spin-cycle procedure is intro-
duced by [17] to overcome the lack of shift invariance of the
DWT and LCP. In particular, a signal is shifted to the left and
right for a selected number of spins. For each shift, the signal
is expanded into its DWT coefficients. These coefficients are
either averaged or processed individually. It has been shown
that the spin-cycle procedure provides many improvements
over the direct use of the DWT or LCP [13, 17]. In Figure 13,
we show the classification curves obtained from the DWT,
the DWT with spin-cycle, and the UDWT methods.
As expected, the results obtained from DWT were poor.
Interestingly the DWT with spin-cycle provided results as
good as the UDWT. We note that the minimum error of spin-
cycle method was slightly lower than UDWT but used more
features. However, one should note that the computational
complexity of spin-cycle method is 3 times higher than that
of UDWT. In real-time applications, it is difficult to obtain
fast processing by this method.
4.5. Feature selection
A total of 210 features corresponding to 210 time-frequency
band are obtained before frequency axis pruning operation.
Recall that when Fisher criterion is used for feature sort-
ing, the frequency tree is pruned as a prior step to obtain
an uncorrelated subband feature set. Here, we investigate
the efficiency of the proposed approach by comparing it to
the correlation-based feature selection (CSF) procedure of
[12]. The CSF uses the feature-to-class and feature-to-feature
correlations to select a subset of features from a redundant
set. Since it can account for the feature-to-feature correla-
tions, we presented the unpruned full feature dictionary to
CSF method. The subset returned by the CSF method was
used for classification. In Figure 14, we show the classifica-
tioncurveofCSFandcompareitwiththecurveofouralgo-
rithm based on Fisher’s criterion on the pruned set. The CSF
method achieved to minimal error of 4% with around 70
features. Although a redundant feature dictionary was pre-
sented to the algorithm, it successfully selected a subset with-
out any pruning step.
Habil Kalkan et al. 9
4
4
4
4
6
6
6
6
6
6
6
6
6
8
8
8
8
8
8
8
8
10
10
10
10
10
10
12
12
14
4
4
4
6
4
9
14
10
10 20 30 40 50 60
Number of features
2
4
6
8
10
12
14
Filter type (Db1–15)
(a)
4
4
4
4
4
4
4
5
5
5
5
5
5
5
5
6
6
6
6
6
6
6
6
6
7
7
7
7
7
7
7
7
7
8
8
8
8
8
8
8
8
9
9
9
10
10
11
12
4
4
13
5
9
10 20 30 40 50 60
Number of features
1
2
3
4
5
Filter type (Coif1–5)
(b)
Figure 11: The effect of selected wavelets and feature dimension on classification accuracy; (a) Daubechies, (b) Coiflet.
020406080
Number of features
0
5
10
15
20
25
Classification error (%)
Signal
SNR 20 dB
SNR 10dB
SNR 5dB
Figure 12: The classification error curves for noise disturbed im-
pact acoustic signals.
It is observed that the classification error increased after
70 features. Interestingly within the first 10 features, the CSF
provides a lower error rate than Fisher’s criterion. However,
with increasing number of features the Fisher-based sorting
procedure over the pruned subband tree provided lower er-
ror rates. The pruning algorithm in our method automati-
cally eliminated two third of these features. The error curve
(Pruned tree, Fisher) in Figure 14 indicates that the pruning
and Fisher criteria combination is successful at detecting rel-
evant features in acoustic signals.
0 20 40 60 80 100
Number of features
3
3.5
4
4.5
5
5.5
6
6.5
7
7.5
8
Classification error (%)
DWT
Spin-cycle
UDWT
Figure 13: The classification error curves for evaluating the effi-
ciency of shift invariance property. The spin-cycle curve stands for
the results obtained from DWT supported 1-Spin-cycle procedure.
4.6. Computational complexity
Determining the best time-frequency segmentation of the
signals and the bands to be retained for classification is rel-
atively computationally demanding but this step has to be
carried out only once, offline. For online processing, the
throughput of the algorithm in terms of nuts processed
per second depends on the number of features used in
10 EURASIP Journal on Advances in Signal Processing
0 50 100 150 200 250
Number of features
3
4
5
6
7
Classification error (%)
Unpruned tree, CSF
Pruned tree, Fisher
Figure 14: The classification error curves of CSF method and our
proposed approach.
classification. When the first 64 features providing the best
classification rate is employed, all 768 samples need to be
processed. In this case 17.4 milliseconds are required for sig-
nal acquisition of a single nut at a sampling rate of 44.1 kHz.
The computations for feature extraction and classification
require 13.1 milliseconds on a dedicated P4 3 GHz proces-
sor. In this case, up to 32 nuts can be processed in a second
with classification error of 3.5%. In case an extra 0.5% clas-
sification error is tolerable, up to 45 nuts can be processed
in a second with 30 features. We observed that only the first
half of the signal is required to compute the first 19 features.
The classification error achievable at this case is 5.3% and
the throughput can be as high as 119 nuts/s provided that the
mechanical sorter system is able to keep up with signal pro-
cessing.
5. CONCLUSION
Inthisstudy,anadaptivetimefrequencyplanefeaturese-
lection algorithm is introduced to separate cracked hazel-
nuts from regular hazelnuts. The adaptation in time and fre-
quency is achieved by combining local cosine packets and an
undecimated wavelet transform. The impact signal is adap-
tively segmented in the time domain with LCP. Similarly the
signals in each resulting time segment are decomposed into
subbands by an undecimated wavelet transform. The sub-
band tree is pruned from bottom to top according to the
discrimination power of its nodes. The resulting t- f map is
used to extract the best features for classification. Interest-
ingly, higher bands are selected by the algorithm. Finally, the
hazelnuts are classified by LDA. The proposed approach is
robust, adaptive to signal type and provides superior classi-
fication results. The algorithm can work in a real time auto-
matic sorter with a processing speed of 45 nuts/s.
ACKNOWLEDGMENTS
This work is supported by National Science Foundation
(NSF) and by the Project EEEAG-106E057 and Program
2214 of National Scientific Research Council of Turkey.
REFERENCES
[1] C. R. Dichter, “Risk estimates of liver cancer due to aflatoxin
exposure from peanuts and peanut products,” Food and Chem-
ical Toxicology, vol. 22, no. 6, pp. 431–437, 1984.
[2] T. Pearson, “Separating early split from normal pistachio nuts
for removal of nuts contamination on the tree with aflatoxin,”
M.S. thesis, University of California, Berkeley, Calif, USA,
1987.
[3] T. Pearson, “Machine vision system for automated detec-
tion of stained pistachio nuts,” Lebensmittel-Wissenschaft und-
Technologie, vol. 29, no. 3, pp. 203–209, 1996.
[4] T. Pearson and T. F. Schatzki, “Machine vision system for au-
tomated detection of aflatoxin-contaminated pistachios,” Jour-
nal of Agr icultural and Food Chemistry, vol. 46, no. 6, pp. 2248–
2252, 1998.
[5] T. Pearson, “Detection of pistachio nuts with closed shells
using impact acoustics,” Applied Engineering in Agriculture,
vol. 17, no. 2, pp. 249–253, 2001.
[6] A. E. Cetin, T. Pearson, and A. H. Tewfik, “Classification of
closed- and open-shell pistachio nuts using voice-recognition
technology,” Transactions of the American Society of Agricul-
tural Engineers, vol. 47, no. 2, pp. 659–664, 2004.
[7] I. Onaran, B. Dulek, T. Pearson, Y. Yardimci, and E. C¸ etin,
“Detection of empty hazelnuts from fully developed nuts by
impact acoustics,” in Proceedings of the 13th European Sig-
nal Processing Conference (EUSIPCO ’05), Antalya, Turkey,
September 2005.
[8] H. Kalkan and Y. Yardimci, “Classification of hazelnuts by im-
pact acoustics,” in Proceedings of the 16th IEEE Signal Process-
ing Society Workshop on Machine Learning for Signal Process-
ing (MLSP ’06), pp. 325–330, Maynooth, Ireland, September
2006.
[9] N. Saito and R. R. Coifman, “Local discriminant bases,”
in Wavelet Applications in Signal and Image Processing II,
vol. 2303 of Proceedings of SPIE, pp. 2–14, San Diego, Calif,
USA, July 1994.
[10] N. F. Ince, A. H. Tewfik, and S. Arica, “Classification of move-
ment EEG with local discriminant bases,” in Proceedings of
IEEE International Conference on Acoustics, Speech and Signal
Processing (ICASSP ’05), vol. 5, pp. 413–416, Philadelphia, Pa,
USA, March 2005.
[11] N. F. Ince, A. H. Tewfik, and S. Arica, “Extraction subject-
specific motor imagery time-frequency patterns for single
trial EEG classification,” Computers in Biology and Medicine,
vol. 37, no. 4, pp. 499–508, 2007.
[12] M. A. Hall, “Correlation-based feature selection for machine
learning,” Ph.D. dissertation, Department of Computer Sci-
ence, Waikato University, Hamilton, New Zealand, 1998.
[13] N. F. Ince, S. Arica, and A. H. Tewfik, “Classification of sin-
gle trial motor imagery EEG recordings with subject adapted
non-dyadic arbitrary time-frequency tilings,” Journal of Neural
Engineering, vol. 3, no. 3, pp. 235–244, 2006.
[14] K. Englehart, B. Hudgins, P. A. Parker, and M. Steven-
son, “Classification of the myoelectric signal using time-
frequency based representations,” Medical Engineering and
Physics, vol. 21, no. 6-7, pp. 431–438, 1999.
Habil Kalkan et al. 11
[15] M. V. Wickerhauser, Adapted Wavelet Analysis from Theory to
Software, A. K. Peters, Natick, Mass, USA, 1994.
[16] M. Unser, “Texture classification and segmentation using
wavelet frames,” IEEE Transactions on Image Processing, vol. 4,
no. 11, pp. 1549–1560, 1995.
[17] N. Saito, R. R. Coifman, F. B. Geshwind, and F. Warner, “Dis-
criminant feature extraction using empirical probability den-
sity estimation and a local basis library,” Pattern Recognition,
vol. 35, no. 12, pp. 2841–2852, 2002.