Báo cáo hóa học: " Research Article Transforming 3D Coloured Pixels into Musical Instrument Notes for Vision Substitution Applications" pot
Bạn đang xem bản rút gọn của tài liệu. Xem và tải ngay bản đầy đủ của tài liệu tại đây (4.57 MB, 14 trang )
Hindawi Publishing Corporation
EURASIP Journal on Image and Video Processing
Volume 2007, Article ID 76204, 14 pages
doi:10.1155/2007/76204
Research Article
Transforming 3D Coloured Pixels into Musical Instrument
Notes for Vision Substitution Applications
Guido Bologna,
1
Beno
ˆ
ıt Deville,
2
Thierry Pun,
2
and Michel Vinckenbosch
1
1
University of Applied Science, Rue de la prairie 4, 1 202 Geneva, Switzerland
2
Computer Science Center, University of Geneva, Rue G
´
en
´
eral Dufour 24, 1211 Geneva, Switzerland
Received 15 January 2007; Accepted 23 May 2007
Recommended by Dimitrios Tzovaras
The goal of the See ColOr project is to achieve a noninvasive mobility aid for blind users that will use the auditory pathway to
represent in real-time frontal image scenes. We present and discuss here two image processing methods that were experimented in
this work: image simplification by means of segmentation, and guiding the focus of attention through the computation of visual
saliency. A mean shift segmentation technique gave the best results, but for real-time constraints we simply implemented an image
quantification method based on the HSL colour system. More particularly, we have developed two prototypes which transform
HSL coloured pixels into spatialised classical instrument sounds lasting for 300 ms. Hue is sonified by the timbre of a musical
instrument, saturation is one of four possible notes, and luminosity is represented by bass when luminosity is rather dark and
singing voice when it is relatively bright. The first prototype is devoted to static images on the computer screen, while the second
has been built up on a stereoscopic camera which estimates depth by triangulation. In the audio encoding, distance to objects
was quantified into four duration levels. Six participants with their eyes covered by a dark tissue were trained to associate colours
with musical instruments and then asked to determine on several pictures, objects with specific shapes and colours. In order to
simplify the protocol of experiments, we used a tactile tablet, which took the place of the camera. Overall, colour was helpful for the
interpretation of image scenes. Moreover, preliminary results with the second prototype consisting in the recognition of coloured
balloons were very encouraging. Image processing techniques such as saliency could accelerate in the future the interpretation of
sonified image scenes.
Copyright © 2007 Guido Bologn a et al. This is an open access article distributed under the Creative Commons Attribution License,
which permits unrestricted use, distribution, and reproduction in any medium, provided the original work is properly cited.
1. INTRODUCTION
Echolocation is a mode of perception used spontaneously by
many blind people. It consists in perceiving the environment
by generating sounds and then listening to the correspond-
ing echoes. Reverberations of various types of sound, such as
slapping of the fingers, murmured words, whistles, noise of
the steps, or sounds from a cane are commonly used. In this
work we present See ColOr (Seeing Colours with an Orches-
tra), which is a multidisciplinary project at the cross-road of
computer vision, audio processing and pattern recognition.
The long-term goal is to achieve a noninvasive mobility aid
for blind users that will use the auditory pathway to repre-
sent in real-time frontal image scenes. Ideally, our targeted
system will allow visually impaired or blind subjects having
already seen to build coherent mental images of their envi-
ronment. Typical coloured objects (signposts, mailboxes, bus
stops, cars, buildings, sky, trees, etc.) will be represented by
sound sources in a three-dimensional sound space that will
reflect the spatial position of the objects. Targeted applica-
tions are the search for objects that are of particular use for
blind users, the manipulation of objects, and the navigation
in an unknown environment.
Spatialisation is the principle which consists of virtually
creating a three-dimensional auditive environment, where
sound sources can be positioned all around the listener.
These environments can be simulated by means of loud-
speakers or headphones. Among the precursors in the field,
Ruff and Perret led a series of experiments on the space per-
ception of auditive patterns [1]. Patterns were transmitted
through a 10
× 10 matrix of loudspeakers separated by 10 c m
and located at a distance of 30 cm from the listener. Pat-
terns were represented on the auditory display by sinusoidal
waves on the corresponding loudspeakers. The experiments
showed that 42% of the participants identified 6 simple ge-
ometrical patterns correctly (segment of lines, squares, etc.).
However, orientation was much more difficult to determine
precisely. Other experiments carried out later by Lakatos
2 EURASIP Journal on Image and Video Processing
taught that subjects recognised with 60–90% accuracy ten al-
phanumeric characters [2].
Hollander carried out a series of comparative exper-
iments between several spatialisation techniques [3]. He
achieved a study, similar to that of Perret and Ruff,where
each loudspeaker was virtually synthesised by a pair of head
related transfer functions (HRTFs). In practice, the simula-
tion of the spatialised environment was obtained by repro-
ducing the perceptive process of sound source localisation.
Specifically, to give the impression that a sound source was
positioned at a given place, it was filtered through the pair of
HRTFs corresponding to the position of the source in space,
before being sent to the listener. For all the experiment par-
ticipants, customised HRTF filters were determined by spe-
cial measures. The author concluded that for an auditory dis-
play composed of 4
× 4 virtual loudspeakers, the participants
found much more difficulty in the correct identification of
simple patterns (20–43%, versus 60–90%). However, the au-
thor noticed that the percentage of correct answers increased,
as the number of virtual loudspeakers increased.
1.1. Novel aspects of the See ColOr approach
Our See ColOr prototype for visual substitution presents a
novelty compared to s ystems presented in the literature (cf.
Section 2). More particularly, we propose the encoding of
colours by musical instrument sounds, in order to emphasise
coloured objects and textures that will contribute to build
consistent mental images of the environment. Note also that
at the perceptual level, colour is helpful to group the pixels of
a monocoloured object into a coherent entity. Think for in-
stance when one looks on the ground and it “sounds” green,
it will be very likely to be grass. The key idea behind See
ColOr is to represent a pixel of an image as a sound source
located at a particular azimuth and elevation angle. Depth is
also an important parameter that we estimate by triangula-
tion using stereo-vision. Each emitted sound is assigned to
a musical instrument, depending on the colour of the pixel.
We advocate the view that under the same illumination an
object must be rendered by the same combination of sounds,
whatever its p osition in the sonified window. This is why lo-
cation is perceived by sound spatialisation and the “identity”
of a particular object resides in its particular sound timbre.
In this work, the purpose is to investigate w h ether in-
dividuals can learn associations between colours and musi-
cal instrument sounds and also to find out whether colour
is beneficial to experiment participants. To the best of our
knowledge this is the first study in the context of visual sub-
stitution for real-time navigation in which colour is supplied
to the user as musical instrument sounds. We created two
different prototypes; the first is based on the sonification of
a subwindow of the image scene represented on the screen of
a laptop, while the second is related to the sonification of a
subwindow of the image captured by a stereoscopic camera
providing depth. In the following sections, we present several
techniques for image simplification, audio encoding without
spatialisation, 3D spatialisation, and s everal experiments re-
lated to colour followed by the conclusion.
2. REAL TIME NAVIGATION PROTOTYPES
FOR THE BLIND
Several systems have been proposed for visual substitution
by the auditory pathway in the context of real-time naviga-
tion [4–8]. Systems developed for the analysis of static im-
ages during long intervals of time are not taken into account
here; for a review see [9]. The “K Sonar-Cane” combines a
cane and a torch with ultrasounds [4]. With such a device,
it is possible to perceive the environment by listening to a
sound coding the distance and to some extent the texture of
the objects which return an echo. The sound image is always
centered on the axis pointed by the sonar. Scanning with that
cane only produces a one-dimensional response (as if using
a regular cane with enhanced and variable range) that does
not take colour into account.
TheVoice is a system where an image is represented by 64
columns of 64 pixels [5]. Every image is processed f rom left
to right and each column is listened for about 15 ms. Specif-
ically, every pixel in a column is represented by a sinusoidal
wave with a distinct frequency. High frequencies are at the
top of the column and low frequencies are at the bottom.
Overall, a column is represented by a superposition of sinu-
soidal waves with their respective amplitudes depending on
the luminance of the pixels. This head-centric coding does
not keep a constant pitch for a given object when one nods
the head because of elevation change. In addition, interpret-
ing the resulting signal is not obvious and requires extensive
training.
Capelle et al. proposed the implementation of a crude
model of the primary visual system [6]. The implemented
devi ce provides two resolution levels corresponding to an ar-
tificial central retina and an artificial peripheral retina, as in
the real visual system. The auditory representation of an im-
age is similar to that used in TheVoice with distinct sinusoidal
waves for each pixel in a column. Experiments carried out
with 24 blindfolded sighted subjects revealed that after a pe-
riod of time not exceeding one hour, subjects identified sim-
ple patterns such as horizontal lines, squares, and letters.
A more musical model was introduced by Cronly-Dillon
et al. [7]. First, the complexity of an image is reduced by
applying several algorithms (segmentation, edge detection,
etc.). After processing, the image contains only black pix-
els. Pixels in a column define a chord, while horizontal lines
are played sequentially, as a melody. When a processed im-
age presents too complex objects, the system can apply seg-
mentation algorithms to these complex objects and to ob-
tain basic patterns such as squares, circles, and polygons. Ex-
periments carried out with normal and (elderly) blind per-
sons showed that in many cases a satisfactory mental image
was obtained. Nevertheless, this sonification model requires
a very strong concentration from the subjects and thus is a
source of mental fatigue.
Gonzalez-Mora et al. have been working on a prototype
for the blind in the Virtual Acoustic Space Project [8]. The y
have developed a device which captures the form and the vol-
ume of the space in front of the blind person’s head and sends
this information, in the form of a sound map through head-
phones in real-time. Their original contribution was to apply
Guido Bologna et al. 3
the spatialisation of sound in the three-dimensional space
with the use of HRTFs. As a result, the sound is perceived
as coming from somewhere in front of the user. The first de-
vice they achieved was capable of producing a virtual acoustic
space of 17
× 9 × 8 gray-level pixels covering a distance of up
to 4.5 meters.
3. IMAGE SIMPLIFICATION AND SALIENCY
Since the amount of information collected by the camera on
the facing scene is very large, sonifying a scene as it stands
would create a cacophony. In this case the blind user, over-
whelmed by all the sounds, would not understand the en-
vironment and would not be guided efficiently. Thus, the
acquired data needs to be filtered and its amount reduced.
To achieve this, we present a nd discuss here two methods
that were experimented in this work: image simplification by
means of segmentation, and guiding the focus of attention
(FOA) through the computation of visual saliency.
3.1. Image simplification
To guide the sonification and reduce the amount of informa-
tion given by the stereo camera, it w as felt that a cartoon-
like picture would be easier to sonify and understand. To
this purpose we experimented and compared three different
segmentation methods on the acquired images: a split-and-
merge method based on quadtrees, and two clustering meth-
ods, k-means, and the kernel-based mean shift. These meth-
ods have been chosen because of their algorithmic simplicity
or reported accuracy. Furthermore, they all directly perform
in a colour space, which is a relevant point in a project where
we want to sonify colours.
3.1.1. Methods
Image seg mentation is a very w ide and well documented re-
search area. To decide which methods could be of interest
in our case, we have chosen them according to the following
constraints:
(1) speed: the segmentation has to run in real-time;
(2) automation: the number of parameters to set has to be
negligible, if not zero;
(3) coherence: one region must be part of one and only
one object; further an object should not be divided
into too many different regions.
Split-and-merge methods [10] are simple to implement,
do not have many parameters, and are computationally ef-
ficient. The method we have decided to use here is simply
based on the division of the picture in quadtrees.
K-means [11, 12] is a classical classification technique. It
groups the data based on features into K number of groups
(K>0). Each group, or cluster, is defined by its gravity
center, called centroid. The gathering is done by minimiz-
ing the distance between data and the corresponding cluster
centroid.
Mean shift [13, 14] is a procedure that detects modes in
any statistical distribution. Based on the CIE L
∗
u
∗
v
∗
colour
space and the
{x, y} coordinates of the pixels, the resulting
segmentation is visually consistent. For instance, the method
presented by DeCarlo and Santella [15], based on a hierarchi-
cal mean shift segmentation, generally gives coherent visual
results. More particularly, regions that really have different
colours usually stay dissociated.
3.1.2. Results and discussion
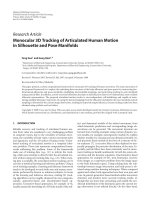
We have applied these methods on the set of images used for
the experiment described in Section 6.1. Figures 1, 2,and3
show the results of the different methods on some of these
320
× 240 pictures.
Results were analysed according to three different crite-
ria: the computing time, the resulting number of regions, and
a consistency measure defined as the mean size of regions.
These results are summarised in Table 1.
The quadtree method is fast and only depends on a ho-
mogeneity cr iter ia, for example, a threshold on the variance
of colours in the studied area, but it creates rectangular re-
gions. This is inadequate in our context since object edges
are not respected. The blind user would be confused by such
Picasso’s world, if everything around him would sound like
having straight and rectangular edges.
One of the problems with the k-means method is the
number of regions it provides. The number of classes is ex-
actly k, but this does not mean that only k regions are seg-
mented. On the contrary , many small regions are spread all
over the image. Another flaw is the dependence on the first
positions of centroids; if they are first placed close to a local
minima, the convergence time will be small. On the contrary,
when their positions are far from minima, the convergence
time can reach a few minutes. Last but not least, the final
clustering depends too much both on the original position
of centroids, as it can be seen on Figure 4, and on the chosen
distance function, as Figure 5 shows it.
As for mean shift, the results seem visually interesting: the
image is clearly simplified, while very few information on the
objects is lost. We however noticed two problems. First, the
choice of parameters is not straightforward, because in order
to get the best results one has to give one parameter for each
dimension of the feature space. This problem can be solved
at the cost of losing precision, by setting a common parame-
ter for all dimensions. The major problem lies with the com-
puting time. Even if mean shift is not always the slowest of
all three segmentation algorithms that were compared, it de-
pends too much on the parameters chosen, the higher the
parameters value, the longer the computing time, and never
takes less than 1 second to compute. Indeed, in our case, we
have to perform all image processing steps in less than a third
of a second, so that our system can respond at a 3 Hz fre-
quency. Results obtained in terms of speed and added com-
plexity with respect to quality were not concluding enough
to pursue the idea of simplifying images. As a consequence,
the solution that finally consists in performing a simple vec-
tor quantization in colour space to decrease the number of
colours to be sonified is seriously considered (cf. Section 4).
4 EURASIP Journal on Image and Video Processing
(a) Original image (b) Mean shift segmentation
(c) K-means segmentation (d) Quadtree segmentation
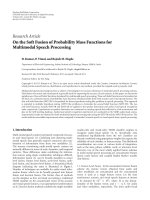
Figure 1: Examples of the results of the three segmentation methods on a children computer drawing.
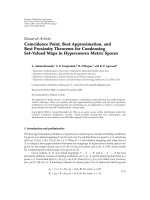
(a) Original image (b) Mean shift segmentation
(c) K-means segmentation (d) Quadtree segmentation
Figure 2: Examples of the results of the three segmentation methods on a real photography.
3.2. Focus of attention
As explained before, the system does not sonify the whole
scene to avoid cacophony, which leads to misunderstand-
ing. Since only a small window will be actually sonified, the
risk of missing important parts of the scene is not negligi-
ble. For this reason an alarm system is being developed. It is
based on the mechanism of visual saliency, that wil l be sum-
marised in the next paragraphs. This mechanism allows de-
tection of parts of the scene that would usually attract the
Guido Bologna et al. 5
(a) Original image (b) Mean shift segmentation
(c) K-means segmentation (d) Quadtree segmentation
Figure 3: Examples of the results of the three segmentation methods on a churchyard photography.
(a) (b)
Figure 4: Different centroid positions lead to different K-means clusterings.
(a) Euclidean distance (b) Cosine distance
Figure 5: Clusterings obtained by changing the distance function.
6 EURASIP Journal on Image and Video Processing
Table 1: Analysis of segmentation results on a set of 320 × 240 pic-
tures.
Number of
regions
Regions mean
size (in pixels)
Computing
time (s)
Mean shift 237 324.7 4.5
K-means
2561 30.0 3.8
Quadtree
783 98.1 2.3
visual attention of sighted people. Once the program has de-
tected such saliencies, a new sound will indicate to the blind
user that another part of the scene is noteworthy.
3.2.1. Visual saliency
Saliency is a visual mechanism linked to the emergence of a
figure over a background [16]. During the preattentive phase
of the visual perception, our attention firstly stops on ele-
ments that arise from our visual environment, and finally fo-
cus the cognitive processes only on these elements. Different
factors enter into account during this process, both physical
and cognitive. Physical factors are mainly based on contrasts
(lightness, colours), singularity in a set of objects or in an ob-
ject itself [17], or cohesion and structuration of the scene. We
are only interested in these physical factors: blind users will
use their own cognitive abilities to understand the surround-
ings, given their personal impressions, particular knowledge
of this environment (e.g., is the user inside or outside?), and
the sonified colours.
Amongst the existing frameworks of visual attention and
saliency, four different methods have been considered. They
can be grouped in two categories. In the first one are ap-
proaches based on conspicuity maps [18, 19]andentropy
[20] which provide accurate salient regions at the cost of high
complexity. In the second category are methods based on dif-
ferences of Gaussians (DoG) [21] and the speeded up robust
features (SURF) [22].Theyprovidelessaccurateresultsbut
are of lower algorithmic complexity. The constraints on the
viability of the See ColOr system (at least 3 Hz frequency an-
swer’s rate), led to the choice of the SURF method as a start-
ing point. Moreover, the accuracy of the detected point is not
a strong constraint: once the blind user has pointed towards
this specific location with the stereoscopic camera, his own
cognitive system will take over.
3.2.2. SURF’s interest points
In this approach, interest points are determined as the max-
ima of the Hessian determinant distribution computed on
the grey-level picture. For each point x
= (x, y) of the pic-
ture, its Hessian determinant at scale σ is approximated as
follows:
det
H
approx
(x, σ)
=
D
xx,σ
D
yy,σ
−
c
σ
· D
xy,σ
,(1)
where D
xx,σ
, D
yy,σ
,andD
xy,σ
are box filter approximations
for Gaussian second-order derivatives at scale σ and c
σ
is a
correction constant, depending on the current scale and the
size of box filters.
The computation of the Hessian determinant is stored on
adifferent layer for each scale. The combination of these lay-
ers is a three-dimensional image, on which is applied a non-
maxima suppression in a 3
×3× 3 neighbourhood. The max-
ima are then interpolated in scale and image space, and in-
terest points are extracted from this new three-dimensional
picture.
3.2.3. SURFing colours
Most methods that detect saliency over a colour domain are
time consuming, and fast methods such as SURF only work
on intensity values, that is, grey-level pictures. We have thus
adapted the original SURF algorithm so that it operates in
colour space, keeping in mind that speed is a strong con-
straint. Our approach, where we combine the salient points
of each intensity colour plane, is a first step to a more sophis-
ticated colour version of SURF.
The sonification part of See ColOr is working in HSL (cf.
Section 4). We therefore attempted to map the camera colour
space, that is, RGB, into HSL. This was found to create many
problems due to the cyclic dimension of hue, from 0
◦
to 360
◦
.
This is why we compute the SURF’s interest points in the
original RGB colour space on each colour plane. We then
combine these three conspicuity planes into a final one: all
detected points are present in this final plane, and whenever
a point is detected in more than one colour plane, its final
strength increases according to the SURF strength from each
colour.
To decide which salient point is the most interesting, we
look for the part of the scene containing the densest group
of interest points. First we search for the 2 strongest inter-
est points p
= (x
p
, y
p
, s
p
) ∈ S
I
,where{x
p
, y
p
} are the pixel
coordinates, s
p
the strength computed by the SURF method,
and S
I
the set of interest points detected on the image I.A
group of density G
c
centered on c—one of the strongest in-
terest points of saliency s
c
—is defined as follows:
G
c
=
p ∈ S
I
| d(c, p) <m· s
c
+ n · s
p
,(2)
where m, n are positive coefficients—respectively set to 1 and
0 in our current experimentation—used to define the influ-
ence area of the salient points and d(c, p) the distance of
point p to the group’s center c. In our case, we h ave chosen
the squared Euclidean distance. Figure 6 shows how, given a
set of detected saliencies, we group them.
Here, we obtain two groups of points that can be in-
dicated to the user. The chosen group is the densest one,
according to the density measure A
G
c
/W
G
c
,whereA
G
c
=
p∈G
c
C
p
—C
p
being the circle area centered in p,ofradius
s
p
—and W
G
c
=
p∈G
c
s
p
are, respectively, the surface and
the weight of the density group G
c
. Finally, the center of grav-
ity of this density group is proposed to the blind user as an
interesting object in the scene.
We give here a description of the scenario which tells the
system where to look when a salient point is found. First, the
saliencies are computed. The strongest relevant area is soni-
fied using a specific sound, and spatialised to indicate its ex-
act position to the user, while the other ones are kept in the
Guido Bologna et al. 7
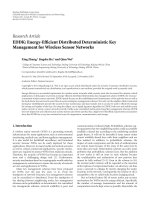
Figure 6: Detected dense groups of salience. A cross indicates a
point of interest, and its size depends on the point’s strength given
by the SURF method.
system memory. The number of memorised areas is to be de-
fined later, when further experiments with blind users will be
achieved. Whenever the user’s point of view changes, the sce-
nario restarts, combining the new list of detected saliencies
with the previous ones, keeping only the strongest salient ar-
eas. In addition, the spatialisation of previous saliencies has
to take into account the user’s movement to focus the atten-
tion on an updated geogr aphic area.
Spatialised alarm sounds would be different than musi-
cal instrument sounds that are currently used for colour en-
coding (cf. Section 4). For instance we could imagine sounds
of percussions or sounds used for earcons. Furthermore, the
saliency submodule would be activated by the user on de-
mand with the use of a special device button.
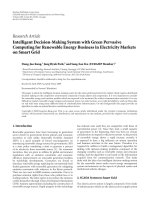
3.2.4. Results and discussion
We performed this method on pictures taken by a stereo-
scopic colour camera. Figures 7(a) to 7(f) and 7(g) to 7(l)
show the results, compared to the original SURF computa-
tion.
Crosses are centered where a point of interest is detected,
and their size depends on the strength of the point of inter-
est. On Figures 7(c) and 7(i), blue crosses are the remaining
points of interest, and the white cross is the point that will be
sent to the See ColOr sonification system, as an alarm.
The next step will be the use of the disparity information
given by the stereo camera. This additional information will
be useful for the computation of saliency. For example, this
could help in the choice of the point of interest’s area of influ-
ence, or to dissociate salient points close in the image plane
but distant depth. Moreover, we can then give more impor-
tance to close objects and to objects getting closer, and ignore
leaving or distant ones.
4. FLAT AUDIO ENCODING
This section illustrates audio encoding without 3D sound
spatialisation. Colour systems are defined by three distinct
variables. For instance, the RGB cube is an additive colour
model defined by mixing red, green, and blue channels. We
used the eight colours defined on the vertex of the RGB cube
(red, green, blue, yellow, cyan, purple, black, and white). In
practice a pixel in the RGB cube was approximated with the
colour corresponding to the nearest vertex. Our eight colours
wereplayedontwooctaves:Do,Sol,Si,Re,Mi,Fa,La,Do.
Note that each colour is b oth associated with an instr ument
and a unique note. An important drawback of this model was
that similar colours at the human perceptual level could re-
sult considerably further on the RGB cube and thus gener-
ated perceptually distant instrument sounds. Therefore, after
preliminary experiments associating colours and instrument
sounds we decided to discard the RGB model.
The second colour system we studied for audio encoding
was HSV. The first variable represents hue from red to purple
(red, orange, yellow, green, cyan, blue, purple), the second
one is saturation which represents the purity of the related
colour and the third variable represents luminosity. HSV is a
nonlinear deformation of the RGB cube; it is also much more
intuitive and it mimics the painter way of thinking. Usually,
the artist adjusts the purity of the colour, in order to cre-
ate different nuances. We decided to render hue with instru-
ment timbre, because it is well accepted in the musical com-
munity that the colour of music lives in the timbre of per-
forming instruments. This association has been clearly done
for centuri es. For instance, think about the brilliant conno-
tation of the Te Deum composed by Charpentier in the sev-
enteenth century (the well-known Eurovision jingle, before
important sport events). Moreover, as sound frequency is a
good perceptual feature, we decided to use it for the satura-
tion variable. Finally, luminosity was represented by double
bass when luminosity is rather dark and a singing voice when
it is relatively bright.
The HSL colour system also called HLS or HSI is very
similar to HSV. In practice, HSV is represented by a cone
(the radial variable is H), while HSL is a sy mmetric double
cone. Advantages of HSL are that it is symmetrical to light-
ness and darkness, which is not the case with HSV. In HSL,
the saturation component always goes from fully saturated
colour to the equivalent gray (in HSV, with V at maximum,
it goes from saturated colour to white, which may be consid-
ered counterintuitive). The luminosity in HSL always spans
the entire range from black through the chosen hue to white
(in HSV, the V component only goes half that way, from black
to the chosen hue). The symmetry of HSL represents an ad-
vantage with respect to HSV and is clearly more intuitive.
The audio encoding of hue corresponds to a process of
quantification. As shown by Tabl e 2, the hue var iable H is
quantified for seven colours.
More particularly, the audio representation h
h
of a hue
pixel value h is
h
h
= g · h
a
+(1− g) · h
b
(3)
with g representing the gain defined by
g
=
h
b
− H
h
b
− h
a
(4)
with h
a
≤ H ≤ h
b
and h
a
, h
b
representing two successive
hue values among red, orange, yellow, green, cyan, blue, and
8 EURASIP Journal on Image and Video Processing
(a) Original image (b) Original SURF (c) Final computed saliency
using the proposed algorithm
(d) SURF on red plane (e) SURF on green plane (f) SURF on blue plane
(g) Original image (h) Original SURF (i) Final computed saliency
using the proposed algorithm
(j) SURF on red plane (k) SURF on green plane (l) SURF on blue plane
Figure 7: Examples of the results of the detection of coloured salient points.
purple (the successor of purple is red). In that manner the
transition between two successive hues is smooth. For in-
stance, when h is yellow, then h
= h
a
,thusg = 1and
(1
− g) = 0; as a consequence, the resulting sound mix is
only pizzicato violin. When h goes toward the hue value of
green, which is the successor of yellow on the hue axis, the
gain value g of the term h
a
decreases, whereas the gain term
of h
b
(1 − g) increases, thus we progressively hear the flute
appearing in the audio mix.
Once h
h
has been determined, the second variable S of
HSL corresponding to saturation is quantified into four pos-
sible notes, according to Tabl e 3.
Luminosity denoted as L is the third var iable of HSL.
When luminosity is rather dark, h
h
is additionally mixed with
double bass using the four notes depicted in Ta ble 4 , while
Tabl e 5 illustrates the quantification of bright luminosity by
a singing voice.
Note that the audio mixing of the sounds representing
hue and luminosity is very similar to that described in (3).
In this way, when luminosity is close to zero and thus the
perceived colour is black, we hear in the final audio mix the
double bass without the hue component. Similarly, when lu-
minosity is close to one, the perceived colour is white and
thus we hear the singing voice. Note that with luminosity at
its half level, the final mix contains just the hue component.
Pixel depth is encoded by sound duration. For the time
being, we quantify four depth levels; from one meter to four
meters, every meter. Pixel depth farther than three meters
Guido Bologna et al. 9
Table 2: Quantification of the hue variable by sounds of musical
instruments.
Hue value (H) Instrument
Red (0 ≤ H<1/12) Oboe
Orange (1/12
≤ H<1/6) Viola
Yel low (1/6
≤ H<1/3) Pizzicato violin
Green (1/3
≤ H<1/2) Flute
Cyan (1/2
≤ H<2/3) Trumpet
Blue (2/3
≤ H<5/6) Piano
Purple (5/6
≤ H<1) Saxophone
Table 3: Quantification of saturation by musical instrument notes.
Saturation (S) Note
0 ≤ S<0.25 Do
0.25
≤ S<0.5 Sol
0.5
≤ S<0.75 Sib
0.75
≤ S ≤ 1 Mi
Table 4: Quantification of luminosity by double bass.
Luminosity (L) Double bass note
0 ≤ L<0.125 Do
0.125
≤ L<0.25 Sol
0.25
≤ L<0.375 Sib
0.375
≤ L ≤ 0.5 Mi
Table 5: Quantification of luminosity by a singing voice.
Luminosity (L) Voice note
0.5 ≤ L<0.625 Do
0.625
≤ L<0.75 Sol
0.75
≤ L<0.875 Sib
0.875
≤ L ≤ 1 Mi
is considered at infinity. The time dur ation of a sound of
a pixel at infinity is 300 ms (the goal being real-time navi-
gation, it would be unfeasible to use longer sounds), while
sounds representing pixels of undetermined depth is 90 ms.
Tabl e 6 shows the correspondence between sound duration
and the encoded depth of pixels. As a result, a window with
all pixels at a close depth level will sound faster than a w in-
dow having all its pixels at infinity.
In order to estimate profundity, we use a stereoscopic
camera having an epipolar configuration (SRI Interna-
tional: ). The key elements of
the depth estimation algorithm are the enhancement of edge
information by first computing a Laplacian-of-Gaussian fea-
ture on each image, then summing the absolute value of dif-
ferences over a small window (area correlation). The max-
imum correlation is found for each pixel in the left image
over a search area from 8 to 64 pixels. Finally, a confidence
Table 6: The encoding of depth (D) by sound duration.
Depth [m] Sound duration (ms)
Undetermined 90
0
≤ D<1 160
1
≤ D<2 207
2
≤ D<3 254
3
≤ D<∞ 300
measure based on edge energy, and a left/right match consis-
tency check is calculated requiring that the same correspond-
ing points are determined when the left and right images are
swapped. Typical configurations for which depth is undeter-
mined are homogeneous surfaces and occlusions.
5. 3D SOUND SPATIALISATION
Sounds emitted by loudspeakers at a reasonable distance
from the listener can be approximated by plane waves. Our
purpose is to reproduce a 3D soundfield in order to recre-
ate as closely as possible the perception of localised sound
sources. Ambisonic is a method for 3D sound production
[23–26], based on the construction of the desired wave field
by using several loudspeakers. Specifically, the key idea be-
hind ambisonic is the reconstruction of plane waves with the
use of a limited number of spherical harmonics.
For the sake of simplicity let us describe a two-
dimensional case of a plane wave. Suppose that the plane
wave is arriving at an angle ψ with respect to the x-axis and
that the listening point is at a distance r with an angle φ with
respect to the x-axis. The plane wave S
ψ
is defined as
S
ψ
= P
ψ
e
ikr cos(φ−ψ)
;(5)
where P
ψ
is the pressure of the plane wave and k is the wave
number or 2π/λ (with λ the wavelength).
With the use of cylindrical Bessel functions J
m
(·), (5)be-
comes [26]
S
ψ
= P
ψ
J
0
(kr)+
∞
m=1
2i
m
J
m
(kr)
cos(mψ)cos(mφ)
+sin(mψ)cos(mφ)
.
(6)
In practice, the plane wave cannot be reproduced exactly,
as the number of terms goes to infinity. Note that am-
bisonic can provide a higher level of localisation due to
its ability to include more information about the sound-
field than stereo or Dolby surround can include. In prac-
tice, the three-dimensional soundfield is approximated to a
specific order, corresponding to the order of spherical har-
monics. For instance, zeroth order corresponds to mono
and first order is the prevailing form in use in the past, de-
noted as the B-format, which represents the pressure (omni-
directional component) and the three orthogonal gradient
pressure components, corresponding to the three spatial di-
rections.
10 EURASIP Journal on Image and Video Processing
In the See ColOr project, sound spatialisation is achieved
by means of a virtual ambisonic procedure of order two [27].
Personalised HRTFs make it possible to correctly perceive di-
rectional sound sources with the use of a headphone. A loud-
speaker at a particular position is a sound source, thus by
means of HRTFs it is possible to simulate on a headphone the
loudspeakers of an ambisonic architecture. The advantage of
the virtual loudspeaker approach is that HRTFs are measured
only for the positions corresponding to the loudspeakers, in-
stead of requiring numerous measurements spanning space
in azimuth and elevation.
6. PROTOTYPES AND EXPERIMENTS
Our first prototyp e is based on a sonified 17
× 9 subwin-
dow pointed by the mouse on the screen which is sonified
via a virtual ambisonic audio rendering system. In fact, the
sound generated by a pixel is a monaural sound that is en-
coded into 9 ambisonic channels; with parameters depend-
ing on azimuth and elevation angles. Then, the encoded am-
bisonic signals are decoded for loudspeakers placed in a vir-
tual cube layout. Finally, the physical sound is generated for
headphones with the use of HRTF functions related to the di-
rections of virtual loudsp e akers. The HRTF functions we use,
are those included in the CIPIC database [28]. The orchestra
used for the sonification is that described in Section 4, with-
out depth rendering. The maximal time latency for gener-
ating a 17
× 9 sonified subwindow is 80 ms with the use of
Matlab on a Pentium 4 at 3.0 GHz. During the experiments
individuals used the original pictures without any segmenta-
tion processing.
For the second prototype we used a stereoscopic colour
camera with an algorithm for distance calculation (cf.
Section 4). The resolution of images is 320
×240 pixels with a
maximum frame rate of 30 images per second. Depth estima-
tion is based on epipolar geometry and the camera must be
calibrated. Note that typical exposure time and gain param-
eters, as well as red and blue channels have very different val-
ues for indoor and outdoor environments. The major draw-
back of the depth determination algorithm is its unreliability
when texture or edges are missing. T he sonified subwindow
is a row of 25 pixels located at the centre of the image. For
the time being, we just take into account the left/right sound
spatialisation. This prototype uses the first prototype audio
encoding with the addition of depth rendering by time sound
duration.
6.1. Tablet experiments
The purpose of this study was to investigate whether indi-
viduals can learn associations between colours and musi-
cal instrument sounds. Several experiments have been car-
ried out by participants having their eyes enclosed by a dar k
tissue, and listening to the sounds via headphones [23].
In order to simplify the experiments, we used the T3 tac-
tile tablet from the Royal National College for the Blind
(UK) (). Essentially, this device allows
to point on a picture with the finger and to obtain the coordi-
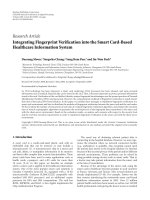
Figure 8: Experiments with the T3 tactile tablet.
nates of the contact point. Moreover, we put on the T3 tablet
a special paper with images including detected edges repre-
sented by palpable roughness. Figure 8 shows the T3 tablet.
Six participants were tr a ined to associate colours with
musical instruments and then asked to determine on several
pictures, objects with specific shapes and colours. For each
participant the training phase lasted 45 minutes. The train-
ing phase started with images of coloured rectangles of vary-
ing saturation values and constant luminosity. Then, training
was pursued with coloured rectangles of constant saturation
and varying luminosity. After fifteen minutes, we asked the
participant to listen to distinct parts of images, such as sky,
grass, ground, and so forth. After another 20 minutes, the
tester eyes were enclosed by a dark tissue and the training
was performed with the tactile tablet showing real pictures.
In particular, participants were asked to identify colours un-
der the touched regions; when wrong, participants were cor-
rected.
At the end of the training phase, a small test for scoring
the perfor mance of the participants was achieved. On the 15
heard sounds, the average number of correct colours among
the six participants was 8.1 (standard deviation: 3.4). It is
worth noting that the best score was reached by a musician
who found 13 correct answers. Afterwards, participants were
asked to explore and identify the major components of the
pictures shown in Figures 1(a) and 9.
Regarding the children draw picture illustrated in
Figure 9, all participants interpreted the major colours as the
sky, the sea, and the sun; clouds were more difficult to infer
(two individuals); instead of ducks, all the subjects found an
island with yellow sand or a ship.
Guido Bologna et al. 11
Figure 9: An elementary picture to be explored and interpreted in
the experiments.
Figure 10: A real picture to be explored and interpreted in the ex-
periments.
For the picture depicted in Figure 1(a) all participants in-
terpreted the major colours as the sky and the sea; an indi-
vidual said that the dolphin is a “jumping animal,” another
said that it was a fish and the others determined a boat or a
“round shape;” only a person found birds and no one could
identify the small fish.
On the interpretation of real images, such as the picture
shown in Figure 10, four participants correctly identified the
tree with the grass and the sky. A participant qualified the
tree as a strange dark object and finally, the last individual
inferred a nuclear explosion!
Concerning Figure 2(a), all subjects found major colours
(blue and yellow); however no one made the distinction be-
tween the sky and the sea. Moreover, no one identified the
yellow cliff, though a large yellow region was always de-
scribed.
The last assignment was to find a red door in Figure 3(a).
All participants found one of the red doors in a time range
between 4 and 9 minutes.
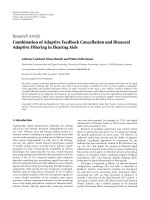
Figure 11: A prototype showing a stereoscopic camera mounted
on the head of a participant to an experiment (note that small head
phones are not visible in the picture).
6.2. Preliminary experiments with
astereoscopiccamera
The second prototype was tested by an individual with eyes
enclosed by a dark tissue. That person is very familiar to mu-
sical instruments and in addition he has learned the colour
encoding for much more time than the six participants of the
previous series of experiments. The experiment consisted in
recognizing coloured balloons. More particularly, our exper-
imenter was on a chair in front of a desk and he knew that
he had on his left side many balloons having seven possible
colours: red, orange, green, yellow, blue, pink, and white. His
task consisted in grabbing balloons and trying to recognise
their colours. Figure 11 illustrates the participant to this ex-
periment.
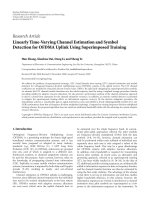
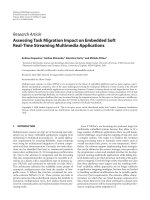
Figure 12 illustrates a typical distance estimation for bal-
loons on a desk. Note that many depth points are unde-
termined, especial ly on the desk (brown colour). Moreover,
closeballoonsarerepresentedinred,orange,andyellow,
while more distant points are green, cyan, and blue.
In this indoor experiment, the difficulty was that light re-
flections on the balloons created many white areas. During a
training phase of 15 minutes the participant had his eyes un-
covered with the stereoscopic camera mounted on his head.
Then, the eyes of our experimenter were covered and he was
told to grasp and explore each balloon for some time before
giving an answer. On the 15 balloons (red: 3; orange: 2; green:
3; yellow: 2; blue: 2; pink: 1; white: 2), all the colours were
correctly recognised. After the experiment we asked the par-
ticipant which colour was the most difficult. He said that the
difference between red and orange balloons was very small.
In fact, for orange balloons more viola was present in the au-
dio mixing than for red balloons. Moreover, the difference
between pink and red balloons was the oboe note, which is
higher for red and also the luminosity of pink corresponding
to a brigh ter component encoded by the singing voice. The
participant said that the easiest colours were those of blue
balloons with very clear piano attack.
12 EURASIP Journal on Image and Video Processing
(a) Original image
(b) Depth map
Figure 12: A typical view of balloons with a corresponding depth
map.
6.3. Discussion
The first experiment concerning the recognition of 15
colours corresponding to 15 sounds exhibited that correct
answers were given in a little bit more than half of the times,
on average. Therefore, roughly speaking our group gave cor-
rect answers for five colours out of nine. That is clearly better
than black and white identification. Thus, this experiment
demonstrated that learning all colours is possible, but diffi-
cult in a short training time. We have yet to precisely evalu-
ate how long it will take to reach a perfect recognition rate. It
is worth noting that learning Braille is also complicated and
requires a long period of training. Accordingly, the training
phase with musical instrument sounds should be repeated a
reasonable number of sessions.
The second experiment with children’s drawings demon-
strated that the most important components of the pictures,
such as the sky, the sea, and the sun were identified. Some-
times our participants were not completely sure, but with
logical reasoning they inferred that if the top of the pictures
is cyan and if the bottom is blue, then the bottom is the sea
and the top is the sky. Moreover, if something at the top of
Figure 9 is yellow and round shaped, this must be the sun.
Another interesting observation is the difficulty to identify
the three ducks. In fact, our common sense tells us that some-
thing yellow would be more likely to be the sand of an island
or a yellow ship. Yellow ducks on the sea represent an unusual
situation which is never considered by our participants.
The third experiment was performed with two real pic-
tures. It is worth noting that Figure 10 has three major com-
ponents (sky, grass, and tree), with a limited perspective view.
Consequently, almost our participants gave a correct sketch
of that picture. On the contrary, Figure 2(a) presents a no-
ticeable perspective; as a result, the context of the picture was
not determined by our six participants, although several in-
dividuals correctly identified the most important colours.
The fourth experiment consisted in finding one of the red
doors of Figure 3(a). All the people were successful, however
the elapsed time was quite long. The first reason is that with
A3 paper format on the T3 tablet, it takes a long time to ex-
plore the picture with a small subwindow of size 17
×9 pixels.
Moreover, the image scene is complicated with a high degree
of perspective. This is a typical situation where higher-level
functions such as saliency (cf. Section 3) would accelerate the
user search.
Five participants out of six said that colour was helpful
for the interpretation of pictures. In fact, when one tries to
identify a picture component, the presence of colour in the
audio representation limits the number of possible interpre-
tations. Finally, the experiments emphasised perspective as a
major drawback for the understanding of two-dimensional
figures.
When successful, participants formed an adequate men-
tal map of typical static pictures in a time interval between
five and ten minutes. This could appear quite long for real
life situations; however, no saliency mechanism was provided
and most importantly the participants to our experiments
were acquainted to the colour encoding for only one training
session.
7. CONCLUSION AND FUTURE WORK
We presented the current state of the See ColOr project which
aims at providing a mobility aid for visually impaired indi-
viduals. Two image processing methods were experimented
in this work: image simplification by means of segmentation,
and guiding the focus of attention through the computation
of visual saliency. Because of real-time constraints, image
simplification in our two prototypes was achieved by colour
quantification of the HSL colour system translated into mu-
sical instrument sounds. With only a training session, the
experiments on static pictures revealed that our participants
were capable to learn five out of nine principal colours, on av-
erage. We will investigate how learning improves with time.
To this purpose, we plan to collaborate with psychologists, in
order to define an appropriate protocol aiming at quantify-
ing the learning rate over several training sessions. As a first
element of answer to this question of learning rate, note that
one of the experiment participants has used the prototype
many times and has gradually learned the audio representa-
tion of colour. Without any doubt, after several training ses-
sions this person recognises colours better than what he had
learned during the first t raining session.
Furthermore, colour was helpful for the interpretation
of image scenes, as it lessened ambiguity. These experi-
ments also demonstrated that the exploration time of pic-
tures is quite long, probably because the sonified subwin-
dow is small and should not expand too much for reasons
related to the limits of human audio channel capacity. Thus,
the image processing techniques presented here such as the
Guido Bologna et al. 13
determination of salient points could reveal crucial for real-
time navigation. Preliminar y results with the stereoscopic
camera prototype and an individual who is very familiar with
the audio encoding has demonstrated excellent performance
in colour recognition. It was noticed that light reflections on
smooth surfaces such as balloons made recognition much
more difficult, but contrary to robots which could b e easily
misled, our brains can reach superior performance.
In the future, we would like to replace the actual depth
encoding by appropriate echoes. The main reason is that it is
natural for a visually impaired person to estimate distance to
obstacles by echo-locating sound reflections generated by her
cane, or by slapping her fingers. In our next depth encoding ,
a close object will sound without echoes, while something
placed far away will be perceived much more reverberated.
Note also that the saliency will be used as an alarm system.
While the user is focused on a particular zone of the scene,
the system will tell him that another part deserves his atten-
tion. To decide on which salient point the user should point,
the system will detect the area where the salient points are
stronger and denser.
ACKNOWLEDGMENTS
The authors would like to gratefully acknowledge the sup-
port of the Hasler Foundation, who funded this research.
Moreover, the authors would like to acknowledge the valu-
able insights and observations contributed by the following
individuals who participated in the experiments: Guillaume
Chanel, Jo
¨
elle Heldt, Julien Kronegg, Thierry Pun, Romana
Rytsar, Fedor Thonnessen.
REFERENCES
[1] R.M.Ruff and E. Perret, “Auditory spatial pattern perception
aided by visual choices,” Psychological Research, vol. 38, no. 4,
pp. 369–377, 1976.
[2] S. Lakatos, “Recognition of complex auditory-spatial pat-
terns,” Perception, vol. 22, no. 3, pp. 363–374, 1993.
[3] A. Hollander, “An exploration of virtual auditory shape per-
ception,” M.S. thesis, University of Washington, Seattle, Wash,
USA, 1994.
[4] L. Kay, “A sonar aid to enhance spatial perception of the blind:
engineering design and evaluation,” The Radio and Electronic
Engineer, vol. 44, no. 11, pp. 605–627, 1974.
[5] P. B. L. Meijer, “An experimental system for auditory image
representations,” IEEE Transactions on Biomedical Engineer ing,
vol. 39, no. 2, pp. 112–121, 1992.
[6] C. Capelle, C. Trullemans, P. Arno, and C. Veraart, “A real-
time experimental prototype for enhancement of vision reha-
bilitation using auditory substitution,” IEEE Transactions on
Biomedical Engineering, vol. 45, no. 10, pp. 1279–1293, 1998.
[7] J.Cronly-Dillon,K.Persaud,andR.P.F.Gregory,“Theper-
ception of visual images encoded in musical form: a study in
cross-modality information transfer,” Proceedings of the Royal
Society B, vol. 266, no. 1436, pp. 2427–2433, 1999.
[8]J.L.Gonzalez-Mora,A.Rodriguez-Hernandez,L.F.Rodri-
guez-Ramos,L.Dfaz-Saco,andN.Sosa,“Developmentofa
new space perception system for blind people, based on the
creation of a virtual acoustic space,” in Proceedings of Interna-
tional Work-Conference on Artificial and Natural Neural Net-
works (IWANN ’99), vol. 2, pp. 321–330, Alicante, Spain, June
1999.
[9] P. Roth, Repr
´
esentation multimodale d’images digitales dans
des syst
`
emes informatiques multim
´
edias pour utilisateur s non-
voyants, Ph.D. thesis, Computer Vision and Multimedia Lab-
oratory, University of Geneva, Geneva, Switzerland, 2002.
[10] S. L. Horowitz and T. Pavlidis, “Picture segmentation by a di-
rected split and merge procedure,” in Computer Methods in
Image Analysis, pp. 101–111, IEEE Press, New York, NY, USA,
1977.
[11] E. Forgy, “Cluster analysis of multivariate data: efficiency ver-
sus interpretability of classifications,” Biometrics, vol. 21, no. 3,
pp. 768–769, 1965.
[12] J. McQueen, “Some methods for classification and analysis of
multivariate observations,” in Proceedings of the 5th Berkeley
Symposium on Mathematical Statistics and Probability, vol. 1,
pp. 281–297, Berkeley, Calif, USA, 1967.
[13] K. Fukunaga, Introduction to Statistical Pattern Recognition,
Academic Press Professional, San Diego, Calif, USA, 2nd edi-
tion, 1990.
[14] Y. Cheng, “Mean shift, mode seeking, and clustering,” IEEE
Transactions on Pattern Analysis and Machine Intelligence,
vol. 17, no. 8, pp. 790–799, 1995.
[15] D. DeCarlo and A. Santella, “Stylization and abstraction
of photographs,” in Proceedings of the 29th Annual Confer-
ence on Computer Graphics and Interactive Techniques (SIG-
GRAPH ’02), pp. 769–776, San Antonio, Tex, USA, July 2002.
[16] F. Landragin, “Saillance physique et saillance cognitive,”
Corela, vol. 2, no. 2, 2004.
[17] D. D. Hoffman and M. Singh, “Salience of visual parts,” Cog-
nition, vol. 63, no. 1, pp. 29–78, 1997.
[18] R. Milanese, Detectingsalientregionsinanimage:frombiolog-
ical evidence to computer implementations, Ph.D. thesis, Uni-
versity of Geneva, Geneva, Switzerland, 1993.
[19] L. Itti, C. Koch, and E. Niebur, “A model of saliency-based vi-
sual attention for rapid scene analysis,” IEEE Transactions on
Pattern Analysis and Machine Intelligence, vol. 20, no. 11, pp.
1254–1259, 1998.
[20] T. Kadir and M. Brady, “Scale, saliency and image description,”
International Journal of Computer Vision, vol. 45, no. 2, pp. 83–
105, 2001.
[21] D. G. Lowe, “Object recognition from local scale-invariant
features,” in Proceedings of the 7th IEEE International Confer-
ence on Computer Vision (ICCV ’99), vol. 2, pp. 1150–1157,
Kerkyra, Greece, September 1999.
[22] H. Bay, T. Tuytelaars, and L. van Gool, “SURF: speeded up ro-
bust features,” in Proceedings of the 9th European Conference on
Computer Vision (ECCV ’06), pp. 404–417, Graz, Austria, May
2006.
[23] M. A. Gerzon, “Design of ambisonic decoders for multi-
speaker surround sound,” Journal of the Audio Engineering So-
ciety, vol. 25, p. 1064, 1977.
[24] J. S. Bamford, “An analysis of ambisonic sound systems of first
and second order,” M.S. thesis, University of Waterloo, Water-
loo, Ontario, Canada, 1995.
[25] D. G. Malham and A. Myatt, “3-D sound spatialization using
ambisonic techniques,” Computer Music Journal,vol.19,no.4,
pp. 58–70, 1995.
[26] J. Daniel, Acoustic field representation, application to the trans-
mission and the reproduction of complex sound environments in
14 EURASIP Journal on Image and Video Processing
amultimediacontext, Ph.D. thesis, University of Paris 6, Paris,
France, 2000.
[27] G. Bolog na and M. Vinckenbosch, “Eye tracking in coloured
image scenes represented by ambisonic fields of musical in-
strument sounds,” in Proceedings of the 1st International Work-
Conference on the Interplay Between Natural and Artificial
Computation (IWINAC ’05), pp. 327–337, Las Palmas, Spain,
June 2005.
[28] V. R. Algazi, R. O. Duda, D. P. Thompson, and C. Avendano,
“The CIPIC HRTF database,” in Proceedings of IEEE Workshop
on the Applications of Signal Processing to Audio and Acous-
tics (WASPAA ’01), pp. 99–102, New Platz, NY, USA, October
2001.