Báo cáo hóa học: " Research Article Biomedical Image Sequence Analysis with Application to Automatic Quantitative Assessment of Facial Paralysis" pdf
Bạn đang xem bản rút gọn của tài liệu. Xem và tải ngay bản đầy đủ của tài liệu tại đây (4.33 MB, 11 trang )
Hindawi Publishing Corporation
EURASIP Journal on Image and Video Processing
Volume 2007, Article ID 81282, 11 pages
doi:10.1155/2007/81282
Research Article
Biomedical Image Sequence Analysis with Application to
Automatic Quantitative Assessment of Facial Paralysis
Shu He,
1
John J. Soraghan,
1
and Brian F. O’Reilly
2
1
Department of Electronic and Electrical Engineering, University of Strathclyde, Royal College Building, Glasgow G1 1XW, UK
2
Institute of Neurological Scie nces, Southern General Hospital, 1345 Govan Road, Glasgow G51 4TF, UK
Received 26 February 2007; Revised 20 August 2007; Accepted 16 October 2007
Recommended by J P. Thiran
Facial paralysis is a condition causing decreased movement on one side of the face. A quantitative, objective, and reliable assessment
system would be an invaluable tool for clinicians treating patients with this condition. This paper presents an approach based on
the automatic analysis of patient video data. Facial feature localization and facial movement detection methods are discussed.
An algorithm is presented to process the optical flow data to obtain the motion features in the relevant facial regions. Three
classification methods are applied to provide quantitative evaluations of regional facial nerve function and the overall facial nerve
function based on the House-Brackmann scale. Experiments show the radial basis function (RBF) neural network to have superior
performance.
Copyright © 2007 Shu He et al. This is an open access article distributed under the Creative Commons Attribution License, which
permits unrestricted use, distribution, and reproduction in any medium, provided the original work is properly cited.
1. INTRODUCTION
Facial paralysis is a condition where damage to the facial
nerve causes weakness of the muscles on one side of the face
resulting in an inability to close the eye and dropping of the
angle of the mouth. The commonest cause of facial palsy
is a presumed herpes simplex viral infection, commonly re-
ferred to as Bell’s palsy, which causes temporary damage to
the facial nerve. Treatment of such viral infections has been
the source of controversy in the past, partly because it has
been difficult to audit the effectiveness of treatment. Facial
paralysis may also occur as a result of malignant tumors, her-
pes zoster infection, middle ear bacterial infection, following
head trauma, or during skull base surgical procedures, par-
ticular in the surgical removal of acoustic neuroma [1]. As
the facial nerve is often damaged during the neurosurgical
removal of these intracranial benign tumours of the hearing
nerve, facial nerve function is a commonly used indicator of
the degree of success of the surgical technique. As most meth-
ods of assessing facial function are subjective, there is a con-
siderable variability in the results between different assessors.
Traditional assessment of facial paralysis is by the House-
Brackmann (HB) grading system [2] which was proposed in
1983 and has been adopted as the North American standard
for the evaluation of facial paralysis. Grading is achieved by
asking the patient to perform certain movements and then
using clinical observation and subjective judgment to assign
a grade of palsy ranging from grade I (normal) to grade VI
(no movement). The advantages of the HB grading scale are
its ease of use by clinicians and that it offers a single figure
description of facial function. The drawbacks are that it re-
lies on a subjective judgment with significant inter- and in-
traobserver variation [3–5] and it is insensitive to regional
differences of function in the different parts of the face.
Several objective facial grading systems have been re-
ported recently. These predominantly involve the use of
markers on the face [5–7]. As the color of the physical mark-
ers is a contrasting color to that of the skin, then simple
threshold methods can be applied to locate the markers
throughout the subjects facial movements. This makes the
image processing simpler but there are negative implications
as a trained technician has to accurately place the markers
on the same part of the face. The success and uptake of any
automatic system will hinge on the ease of use of the tech-
nology [8]. Neely et al. [9–11] and McGrenary et al. [8]mea-
sured facial paralysis by the differences between the frames of
a video. Although their results correlate with the clinical HB
grade, this method cannot cope with irregular or paradoxical
motion in weak side. Wachtman et al. [12, 13]measuredfa-
cial paralysis by examining the facial asymmetry on static im-
ages. They define the face midline by manually labeling three
feature points: the inner canthus of each eye and philtrum
2 EURASIP Journal on Image and Video Processing
and then measuring the intensity difference and edge differ-
ence between the two sides of the face. However, this method
cannot separate the intrinsic facial asymmetry caused by fa-
cial nerve dysfunction from the extrinsic facial asymmetry
caused by orientation, illumination, shadows, and the natu-
ral bilateral asymmetry.
In this paper, we present an automated, objective, and re-
liable facial grading system. In order to assess the degree of
movement in the different regions of the face, the patient
is asked to perform five separate facial movements, which
are raising eyebrows, closing eyes gently, closing eyes tightly,
screwing up nose, and smiling. The patient is videotaped us-
ing a front face view with a clean background. The video se-
quence begins with the patient at rest, followed by the five
movements, going back to rest between each movement. A
highly efficient face feature localization method is employed
in the reference frame that is grabbed at the beginning of
the video during the initial resting phase. The image of the
subject is stabilized to compensate for any movement of the
head by using block matching techniques. Image subtraction
is then employed to identify the period of each facial move-
ment. Optical flow is calculated to identify the direction and
amount of movement between image sequences. The opti-
cal flow computation results are processed by our proposed
method to measure the symmetry of the facial movements
between each side of the face. These results combined with
the total pixel intensity changes and an illumination com-
pensation factor in the relevant facial regions are fed into
classifiers to quantitatively estimate the degree of movement
in each facial region using the normal side as the normal base
line. Finally, the regional results are then fed into to another
classifier to provide an overall quantitative evaluation of fa-
cial paralysis based on HB Scale. Three classification meth-
ods were applied. Experiments show the radial basis function
(RBF) neural network has superior performance.
The paper is organized as follows. In Section 2, the face
feature localization process is presented. In Sections 3 and
4, image stabilization and key movements detection are in-
troduced. In Section 5, the algorithms of the extraction of
motion features are developed. In Section 6, the quantitative
results obtained from three classification methods are com-
pared and Section 7 concludes the paper.
2. LOCALIZATION OF FACIAL REGIONS
Many techniques to detect faces have been developed. Yang
[14, 15] classifies them into four categories: knowledge-
based, feature-based, template-based, and appearance-based.
Template-based and appearance-based methods can be ex-
tended to detect faces in cluttered background, different
poses, and orientation. However, they need either lot of pos-
itive and negative examples to train the models or they need
to be initialized manually and their computation is either
time or memory intensive [15]. Our main objective is to de-
velop an automatic assessment of facial paralysis for clinical
use by measuring facial motion. In order to localize the facial
features quickly, accurately and without any manual interac-
tion, the patient is videotaped using a front face view with
a clean background. Knowledge-based methods are designed
F-L
F-R
E-R
E-L
N-L
N-R
M-L
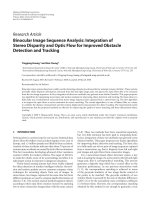
M-R
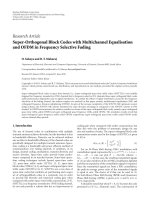
Figure 1: Illustration of facial regions. F: forehead region; E: eye
region; N: nasal region; M: mouth region, L: left, R: right.
mainly for face localization in uncluttered background but
a method is proposed for facial feature localization. It pro-
cesses a 720
× 576 image in 560 milliseconds on a 1.73 GHz
laptop. It was tested using 266 images in which faces have the
in-plane rotation within
±35 degrees and achieved a 95.11%
accuracy for all eight facial regions as shown in Figure 1 to be
localized precisely.
The face area is segmented, the pupils are localized and
the interpupil distance is then used to scale the size of each fa-
cial region. The middle point between the two pupils is used
as a fulcrum to rotate the interpupillary line to the horizon-
tal so that the face is made perpendicular in the image. Since
most subjects and especially those with a facial palsy do not
have bilateral symmetrical faces, the mouth may not be sym-
metric on the line of the pupil middle point. The mouth cor-
ners are therefore separately localized and the middle point
of the mouth is assigned. The nasal regions are initially as-
signed by the positions of the pupils and the middle point
of mouth. They are calibrated by minimizing the difference
between the left and right sides of nose. Finally, a face region
map is assigned as shown in Figure 1.
2.1. Face boundary search
The face area has to be identified before starting the search
for the face features. In our approach, the subject’s face is
viewed frontally and is the only object in the frame. The face
boundary can be detected by horizontal and vertical pro-
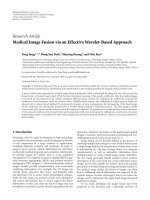
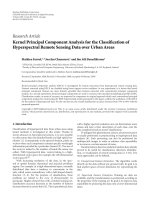
jections of an edge-detected image. Figure 2 demonstrates
that the left and right face boundaries are identified by verti-
cal projection of a Sobel-filtered image. Similarly, horizontal
projection of the binary image is used to find the top bound-
ary of face.
2.2. Detection of the ROI of eyes and mouth
All the features of a face (eyebrows, eyes, nostril, mouth) are
generally darker than the normal skin color [16]however
hair may also be darker than facial features. A Gaussian filter
is used to center weight the head area to remove the hair or
Shu He et al. 3
(a) Original frame (b) Sobel filering
8.7
37.03
Gray value
0 719
Distance (pixels)
(c) Vertical projection
Figure 2: Face boundary detection using Sobel filter and vertical projection.
the collar. The intensity values of Gaussian-weighted image
can be expressed as
I(x, y)
= I
original
(x, y)
∗
w(x, y), (1)
where I
original
(x, y) denotes the intensity value of original im-
age at pixel (x, y), and w(x, y)iscomputedas
w(x, y)
= e
−((x−x
o
)
2
+(y−y
o
)
2
)/(2∗((x
right
−x
left
)/3)
2
)
,(2)
where x
right
and x
left
are the horizontal positions of right and
left face boundaries. The center of the face (x
o
, y
o
)canbe
estimated as
x
o
= x
left
+(x
right
−x
left
)/2,
y
o
= y
top
+(x
right
−x
left
)
∗
3/4
(3)
since the height of face is approximately 1.5 times of the
width. The ROI (region of interest) of the head is assigned
with the x
right
, x
left
, y
top
.
Due to varied skin color and lighting conditions, a dy-
namic threshold is applied to the image such that only those
facial features information is included for analysis. It is ob-
tained by the solution of
1
N
∗
M
i=Threshold
C(i) = 0.1. (4)
Here, the threshold is set to a value that only 10% of pixels
present since the irises, nostrils, and the mouth border oc-
cupy no more than 10% of the ROI of head. N is the number
of pixels in the ROI of head. C(i)
= Histogram (ROI
head
).
M
= 255 if working on 8-bit images.
An example of an inverted, thresholded, Gaussian-
weighted image is shown in Figure 3(a). The vertical position
of eyebrow, eye, nostril, mouth can be determined by its hor-
izontal projection as shown in Figure 3(b). In some cases, the
eyebrow or nostril may not be identified but only the pupils
and mouth corners are the essential key points necessary to
assign the facial map. With the eyes and mouth vertical po-
sition and the face borders, the ROI of eyes and mouth on
each side can be set to allow refining of the pupils and mouth
corners positions.
2.3. Pupil search
This approach is based on the characterization of the iris and
pupil. The iris-pupil region is dark compared to the white
of the sclera of the eye ball and to the luminance values of
the skin color. The iris localization is based on an eye tem-
plate which is a filled circle surrounded by a box. The filled
circle represents the iris and pupil as one part [17]. The eye
width to eye height relation can be expressed as approxi-
mately 3 : 1, and the eye height is interpreted as the iris di-
ameter [18]. Therefore, the eye template can be created as
shown in Figure 4(a). This eye template is scaled automati-
cally depending on the size of the face area. The iris is roughly
localized by searching the minimum difference between the
template and the ROI of the eye. The pupil is darker than the
iris and therefore its position can be determined by searching
the small circle with the lowest intensity value within the iris
area. Here, the diameter of a small circle is set to be 1/3 of the
iris diameter.
2.4. Mouth corner search
The mouth corners are detected by applying the smallest uni-
value segment assimilating nucleus (SUSAN) algorithm for
corner extraction [19] to the ROI of the mouth. The deci-
sion whether or not a point (nucleus) is a corner is based on
examining a circular neighborhood centered around the nu-
cleus. The points from the neighborhood whose brightness is
approximately the same as the brightness of the nucleus form
the area referred to as univalue segment assimilating nucleus
(USAN). The point (nucleus) with smallest USAN area indi-
cates the corner. In Figure 5, the USANs are shown as grey
parts and the upper left one is SUSAN. Usually, more than
one point is extracted as a corner and these points are called
mouth corner candidates. Three knowledge-based rules are
applied to these points. First, the left corner candidates are
eliminated if their horizontal distance from the middle of the
pupil line is greater than 70% of the width of the search re-
gion and a similar rule is employed to the right candidates.
Second, the candidates are eliminated if the horizontal dis-
tance between a left- and right-corner candidate is greater
than 150% of the interpupil distance or less than 50% of the
interpupil distance. Third, among the remaining left candi-
dates, the one located furthest to the left is considered to
be the left mouth corner and a similar rule is employed to
4 EURASIP Journal on Image and Video Processing
(a) Gaussian filtering of face
Eyebrow Eye
Nostril
Mouth
(b) Horizontal projection (c) ROI of eyes and mouth
Figure 3: Detection of the vertical position of facial features.
(a) Eye template (b) Detected
pupil center
Figure 4: Pupil center detection.
n
n
n
n
n
Nucleus
USAN
Figure 5: USAN corner detector.
the right candidates [20]. An example of the detected mouth
corners is shown in Figure 6.
3. IMAGE STABILIZ ATION
Subjects will raise their head spontaneously when asked to
raise there eyebrows and also shake their head while smiling.
Before measuring facial motion, these rigid global motions
need to be removed so that only the nonrigid facial expres-
sions are kept in the image sequences for analysis. Feature
tracking is normally considered to help solve this problem. A
set of features are tracked through the image sequence and
their motion is used to estimate the stabilizing warping [21].
However, in our work there are no key features in the face
which do not change in structure when the movements are
carriedout.Therefore,allfacialfeaturesareusedfortrack-
ing. An ROI of the face encompassing the eyebrows, eyes,
nose, and mouth in the reference frame is defined by the po-
sition of the pupils, mouth corners, and interpupils distance,
as shown Figure 7. The image is stabilized by finding the best
matched ROI of the face between the reference and the subse-
quent frames. The affine transformation given by (5)isper-
(a) (b)
Figure 6: The detected mouth corners.
500
450
400
350
300
250
200
150
100
100 150 200 250 300 350 400 450 500 550 600
Figure 7:TheROIofthefaceinthereferenceframe.
formed on the subsequent frame. Image stabilization can be
formulated as a minimization problem given by (6),
x
y
=
cos θ −sin θ
sin θ cos θ
x
y
+
dx
dy
. (5)
Here, (x
, y
) is the original image coordinates, which is
mapped to the new image at (x, y). dx, dy are the horizontal
and vertical displacements. θ is the rotation angle. The scal-
ing factor is not included as the distance between the subject
and the camera is fixed and the face maintains constant size
through images sequences in our application,
(dx
n
∗
, dy
n
∗
, θ
n
∗
) = arg min
dx,dy,θ
(x,y)⊂ROI
T
n
(x, y) −I
ref
(x, y)
.
(6)
Here, dx
n
∗
, dy
n
∗
, θ
n
∗
are the optimal transformation pa-
rameters for the frame n. I
ref
(x, y) is the intensity of pixel at
(x, y) in reference frame. T
n
(x, y) is the intensity of pixel at
(x, y) in the warped frame n. ROI denotes the ROI of face.
Shu He et al. 5
dx
n
, dy
n
, θ
n
are initialized to the optimal values in the last
frame dx
n−1
∗
, dy
n−1
∗
, θ
n−1
∗
.
4. KEY MOVEMENTS DETECTION
To examine the five key movements in the relevant regions,
the timings of the five movements are identified. An algo-
rithm based on image subtraction is proposed to determine
the start and end of each movement so that information is
only extracted from the appropriate time in the videos and
from the appropriate facial region. The video sequence be-
gins with the subject at rest followed by the five key move-
ments and going back to rest in-between each movement.
Therefore, the rest frames between movements have to be
detected as splice points. This is achieved by totaling up sev-
eral smoothed and varying thresholded pixel changes until
five peaks and four valleys of sufficient separation can be ex-
tracted. The equation to produce the line from which the
splice points can be detected is given in (7) as follows:
Y(n)
= smooth
4
m=0
(x,y)⊂ROI
thresh
×
I
n
(x, y) −I
ref
(x, y)
,(0.1+0.02m)
.
(7)
Here, I
n
(x, y)andI
ref
(x, y) are the intensity of pixel (x, y)at
the nth frame and the reference frame. The ROI is the face re-
gion, defined in session III. m is index for the threshold level.
0.1 is an empirical threshold bias to keep the high-intensity
changes and remove the small pixel changes which may be
produced by noise. The varying intensity of motion can be
detected by changing m. By summing the different intensi-
ties of motions, the peak of motion is obvious and the splice
points are easy to detect.
An example of Y(n) is the highest curve in Figure 8 while
the rest five curves from up to bottom are the plots at m
= 0
to 4, respectively. The splice points are shown as the dotted
lines in Figure 8. The five displacement peaks of movement
correspond to the five key movements in the exercise: raising
eyebrows, closing eyes gently, closing eyes tightly, scrunching
nose, big smile.
5. REGIONAL FACIAL MOVEMENT ANALYSIS
5.1. Motion magnitude by image subtraction
Neely et al. showed that image subtraction is a viable
method of quantifying facial paralysis [9, 10]. This method
is therefore used to measure the motion magnitude of
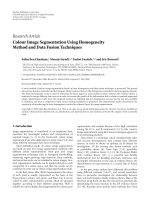
each key movement in the relevant region. Figure 9(a)
shows a reference frame grabbed with the subject at rest.
Figure 9(b) shows the frame with the subject raising eye-
brows. Figure 9(c) is the difference image between Figures
9(a) and 9(b). The pixel is bright if there have been pixel
changes and it is black if there has been no change. From
Figure 9(c) it is clear that there are some changes in the fore-
head with no difference in the areas of the nose or mouth.
0
1
2
3
4
5
6
7
8
9
Total pixel change
×10
4
0 100 200 300 400 500
Frame number
Figure 8: Total of thresholded, smoothed, pixel displacements.
It has been observed that in general the more light falls
on a region of the face, the more changes will be detected
and the results of video taken in nonhomogeneous light-
ing conditions may be skewed. In our work, after the facial
map is defined in the reference frame, the ratios of the in-
tensity mean values between left side and right side in the
relevant regions are calculated and then used as illumination
compensation factors to adjust subsequent frames. Figure 9
illustrates a frame taken in nonhomogeneous lighting con-
ditions. The original image lighting conditions are shown
in Figure 9(a). This subject has almost completely recovered
except for a mild weakness of the eye and mouth on the
right side. Figure 9(c) shows difference between images Fig-
ures 9(a) and 9(b). Note that the left side of the image is the
subject’s right side. Here, it is obvious that more changes
are detected on the left side of the forehead than on the
right side. Figure 9(d) shows that the difference between im-
ages after the illumination compensation for the forehead re-
gion has been applied. The highlighted areas have the similar
intensity, that is similar movement magnitude. The move-
ment magnitude in the relevant region can be computed by
(8)as
mag(n)
=
(x,y)⊂R
I
n
(x, y) −I
ref
(x, y)
∗
w(x, y)
∗
lum, (8)
where w is the Gaussian weights, similar to (1), but set
(x
o
, y
o
) to be the center of the region, x
right
and x
left
are right
and left boundaries of the region, and lum is the illumination
compensation factor, which is set to
lum
=
(x,y)⊂left
I
ref
(x, y)/
(x,y)⊂right
I
ref
(x, y)(9)
for right side, and lum
= 1 for left side.
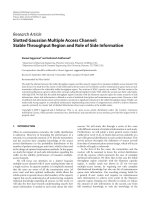
The graphs shown in Figure 9(e) demonstrate the full
displacement results for an almost recovered subject with
mild weakness at the right side of the eye and mouth. Five
6 EURASIP Journal on Image and Video Processing
(a) Reference frame (b) Raising eyebrows (c) Image difference (d) Illumination compensation
00000
0.10.10.10.10.1
0.20.20.20.20.2
0.30.30.30.30.3
0.40.40.40.40.4
0.50.50.50.50.5
0.60.60.60.60.6
0.70.70.70.70.7
0.8
0.8
0.80.80.8
0.90.90.90.
90.9
11111
0.1
0 50 100 0 50 100 0 50 100 50 1000 0 50 100
Forehead Eye gentle Eye tight Nasal Mouth
Volume of movement
Frame number
(e) Without illumination compensation
0
0.20.20.20.20.2
0.40.40.40.40.4
0.60.60.60.60.6
0.80.80.80.80.8
11
11 1
0000
0 50 100 0 50 100 0 50 100 50 1000 0 50 100
Forehead Eye gentle Eye tight Nasal Mouth
Volume of movement
Frame number
(f) With illumination compensation
Figure 9: Illustration of the solution of varying illumination.
plots in Figure 9(e) show the magnitude of the five move-
ments in the relevant facial region. The broken line indicates
the detected movement on the subject’s right side of the face
and the solid line indicates the movement detected on the
left. The x-axis shows the frame count for each movement
and the y-axis indicates the proportional volume of move-
ment from the reference frame, the normal side being stan-
dardized to 1. The output from the forehead and nose show
similar responses for the left and right sides but the move-
ment amplitude for the eye and mouth region for right side
is weaker than left side.
Figures 9(e) and 9(f) compare the results with and with-
out illumination compensation. Figure 9(e) indicates that
detected motion on the right is significantly less than the
left while Figure 9(f) shows similar movement magnitude for
both sides except for the eye and mouth, which is in keeping
with the clinical situation.
The illumination compensation factors, which are the ra-
tios of the intensity mean values between the left and right
side for each region, are between 0.56 and 1.8 for all the
subjects’ videos in our study. This illumination compensa-
tion method is very effective in correcting the magnitude
but it needs to be investigated further whether the illumi-
nation compensation factors can be used linearly to ad-
just the intensity for those videos with ratios out of this
range.
5.2. Motion measurement by optical flow
The magnitude of the movement on each side of the face (i.e.,
Figure 9(f))isaveryeffective way to compare the motion in-
tensity between the normal and the weak sides of the face.
However, it does not take into account the direction of mo-
tion. For a normal subject, the amount of motion in the rel-
ative directions on each side of the face is similar. As shown
in Figure 10(e),foranormalsubjectproducingasmile,the
amount of motion in the up-left direction on the left side
of the image is close to the amount in the up-right direc-
tion on the right side of the image. Figure 10(e) shows a left-
palsy subject asked to smile. Although the left side has a se-
vere paralysis, motion on the left side of the mouth is de-
tected as the left side is drawn to the right by the movement
of the right. Therefore, not only should the motion intensity
Shu He et al. 7
be measured but the direction should also be taken into ac-
count when assessing the degree of palsy.
Optical flow is an approximation of the velocity field re-
lated to each of the pixels in an image sequence. Such a dis-
placement field results from the apparent motion of the im-
agebrightnessintime[22]. In a highly textured region, it
is easy to determine optical flow and the computation con-
verges very fast because there are high gradients in many di-
rections at every location. Optical flow to track facial mo-
tion is advantageous because facial features and skin have
a great deal of texture. There are many methods for the es-
timation of optical flow. Barron and Fleet [23] classify op-
tical flow algorithms by their signal-extraction stage. This
provides four groups: differential techniques, energy-based
methods, phase-based techniques, and region-based match-
ing. They compared several different methods and concluded
that the Lucas-Kanade algorithm is the most accurate.
The Lucas-Kanade algorithm [24], including the pyra-
mid approach, is employed to compute optical flow on five
pairs of images, that is the reference frame and the frame
with maximum motion in each movement. Using the pyra-
mid method with reduced resolution allows us to track the
large motion while maintaining its sensitivity to subtle facial
motion and allows the flow computation to converge quickly.
Figures 10–12 show the results of optical flow estimation for
a normal subject, a left-palsy subject and a right-palsy sub-
ject. In Figure 10, the motion flows are approximately sym-
metrical between two highlighted regions. There is almost no
motion in the left side of the forehead and the nose in Figures
11(a) and 11(d), whereas there is an obvious flow towards
right on the left side of mouth in Figure 11(e). Note that the
right side of image is the subject’s left side. Figure 12 shows
a subject who cannot close his eye but when attempting to
do so his iris moves upward. Although this movement of the
iris is detected by the image subtraction method, it should
be discriminated from the motion of the eyes closing and re-
moved from the calculation of the degree of movement. Fig-
ures 12(b) and 12(c) shows little flow detected in the right
eye confirming the severe palsy in the eye region.
In each facial feature region, the flow magnitude is
thresholded to reduce the effect of small computed mo-
tions which may be either produced from textureless areas
or affected by illumination and the flow magnitude is center
weighted by a Gaussian filter. Given the thresholded flow vec-
tor
v
i
= (u
i
, v
i
) in the region, the overall flow vector of each
region can be expressed as
v
= (u, v), the components of the
vector, u and v, denote of overall displacement on the hor-
izontal and vertical direction. u
=
i
u
i∗
w
i
, v =
i
v
i∗
w
i
,
here w
i
is the Gaussian weights, similar to (1), but set (x
o
, y
o
)
to be the center of the region, x
right
and x
left
are right and left
boundaries of the region.
When subjects raise their eyebrows, close their eyes or
screw up their nose, the muscles in each relevant region
move mainly in the vertical direction. Studies have shown
that even for normal subjects neither the amplitude nor the
orientation of horizontal displacements on each side are con-
sistently symmetrical. Figure 13 shows two normal subjects
raising their eyebrows. In Figure 13(a), the mean horizon-
tal displacements are negative for both sides, that is, in the
same direction, while in Figure 13(b), the mean horizontal
displacements on each side are opposite. In Figure 13(a), the
amplitude of the mean horizontal displacements in the left
side is larger than that in the right side, while in Figure 13(b)
they are similar. The movement in the horizontal direction
does not contribute much information when measuring the
symmetry of the eyebrow, eyes, or nose movements. There-
fore, the displacements strength and the vertical displace-
ments are only used for these symmetry measurements. The
symmetry of the facial motion is quantified by
Sym
y
= 1 −
|
v
left
−v
right
v
left
+
v
right
, (10)
Sym
r
= 1 −
v
left
−
v
right
v
left
+
v
right
, (11)
where v
left
and v
right
are the overall vertical displacements for
left side and right side,
v
left
and
v
right
are the overall flow vec-
tor for left side and right side. Sym
y
and Sym
r
will be within
the range 0-1. The motions on each side of face are symmet-
ricalwhenbothapproximate1.Whenbothapproximate0
the dysfunctional side has no movement at all. While when
Sym
y
= 0andSym
r
= 1 indicate that the motion on each side
is the same amplitude but opposite direction, that is one eye
closed, the other eye cannot close but the iris moves upwards
in the presence of severe paralysis.
Themusclearoundthemouthwillmovetothesideof
face when normal people smile. The horizontal displace-
ments should be negative, that is, move towards the left on
the left side of mouth; and should be positive, that is, move
towards the right on right side. This is used as a constraint
to calculate the overall flow vector of left region and right
region, formulated as
u
left
=
u
i
<0
u
i∗
w
i
,
v
left
=
u
i
<0
v
i∗
w
i
,
u
right
=
u
i
>0
u
i∗
w
i
,
v
right
=
u
i
>0
.
(12)
In the left mouth region, each motion vector with a negative
horizontal displacement is taken into account. Only those
with the positive horizontal displacement are taken into ac-
count for the right side. This allows elimination of the ap-
parent muscle movement on the weak side produced by the
muscles on the normal side as in Figures 11(e) and 12(e).
This method was tested in 197 videos. Sym
y
and Sym
r
are correlated with HB grade around 0.83 in the forehead
and around 0.7 in the rest of the region. Details are shown
in Ta bl e 1 .
6. QUANTITATIVE ASSESSMENT AND EXPERIMENTS
6.1. Quantitative assessment
To map the motion magnitude and optical flow information
into a HB grade is a classification problem.
8 EURASIP Journal on Image and Video Processing
(a) Raise eyebrows (b) Close eye gently (c) Close eye tightly (d) Screw up nose (e) Big smile
Figure 10: Results of optical flow estimation on five frames with peak motion for a normal case.
(a) Raise eyebrows (b) Close eye gently (c) Close eye tightly (d) Screw up nose (e) Big smile
Figure 11: Results of optical flow estimation on five frames with peak motion for a left palsy case.
Table 1: Correlation analysis between Sym
y
,Sym
r
,andHPgrade.
Corr with Sym
y
Corr with Sym
r
Forehead 0.8303 0.8381
Eye gentle 0.7351 0.7603
Eye tight 0.6968 0.7071
Nose 0.6981 0.7199
Mouth 0.7158 0.7206
There are a number of classification methods. k-nearest
neighbor (k-NN), artifical neural network (ANN), and sur-
port vector machine (SVM) are the most widely used clas-
sifiers. They can be used successfully for pattern recognition
and classification on data sets with realistic sizes. These three
classification methods were employed for the quantitative as-
sessment of regional paralysis and the overall facial paralysis.
TheHBgradestheoverallfacialnervefunctionanditis
insensitive to small changes in each facial region.
The regional facial function is measured by examining
the key movements in the relevant region and classified to
six grades from 1 (normal) to 6 (total paralysis). Five clas-
sifiers are trained for the five movements, respectively. Each
has four inputs as follows.
(1) arg min(mag
left
,mag
right
)/ arg max (mag
left
,mag
right
).
Here, mag
left
,mag
right
denotes the total relative pixel
change in the region from the resting face to the peak
of the movement, which can be calculated using (8).
The input value computed here gives the ratio of the
total pixel change between the dysfunctional side and
the normal side.
(2) The illumination compensation factor, calculated by
(9), which is the ratio of mean intensities for each re-
gion between the dysfunctional side and the normal
side. Although the illumination compensation factors
can be used to correct the magnitude if it is between
0.56 and 1.8, the performance of this linear compen-
sation is not ideal. As shown in Figure 9(d), the two
highlighted regions have the similar intensity but are
not identical. In order to further compensate for the
illumination, the illumination factor is included as an
input to the classifier.
(3) Sym
y
,definedby(10), represents the symmetry rel-
ative to the vertical component of the total amount
of displacements from the resting face to the peak of
movement.
(4) Sym
r
,definedby(11), represents the symmetry rela-
tive to the strength of the total amount of displace-
ments from the resting face to the peak of movement.
Outputs are graded from 1 to 6, with 6 representing severe
palsy and 1 being normal. These regional results are then
used as the inputs for the overall classifier to analyze the HB
overall palsy grade.
6.2. Experiments
There are 197 subject videos in our database taken from sub-
jects with Bell’s palsy, Ramsey Hunt syndrome, trauma, and
Shu He et al. 9
(a) Raise eyebrows (b) Close eye gently (c) Close eye tightly (d) Screw up nose (e) Big smile
Figure 12: Results of optical flow estimation on five frames with peak motion for a right palsy case.
Table 2: Test data performance of RBF NN.
Disagreement012345≤ 1
Forehead 68.71 24.52 4.02 2.75 0 0 93.23
Eye gentle 44.36 47.90 3.23 4.51 0 0 92.26
Eye tight 41.27 51.84 3.69 3.20 0 0 93.11
Nose 61.78 24.53 10.18 3.51 0 0 86.31
Mouth 49.80 38.22 8.43 3.55 0 0 88.02
HB 63.92 30.26 5.82 0 0 0 94.18
(a) Normal subject I (b) Normal subject II
Figure 13: Results of optical flow estimation on forehead for two
normal subjects.
other aetiologies as well as normal subjects. Their HB and re-
gional gradings were evaluated by a clinician. As the dataset
was not large, the leave-k-out-cross-validation test scheme
instead of k-fold was adopted.
Multilayer perceptron (MLP) network and radial basis
function (RBF) network are the most popular neural net-
work architectures [24, 25]. Experiments show RBF networks
provide consistently better performance than MLP networks
for facial palsy grading. The centers of each RBF NN were ini-
tialized using the k-means clustering algorithm before start-
ing training.
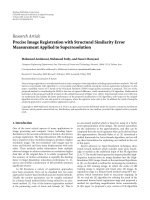
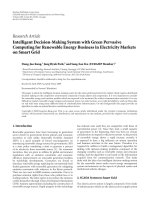
Ta bl es 2, 3,and4 present the average classification per-
formance, in percentages, for the 20 repetitions of the leave-
k-out cross-validation, with k
= 20. The numbers in the first
columns give the percentage of the results which are the
same as the clinician’s assessments. Columns 2–6 show the
percentages where the disagreement is from 1 to 5 grades,
respectively. The last columns show the percentage of the
disagreement within 1 grade. The comparison of the per-
formance is graphically illustrated in Figure 14. The results
show that the RBF NN outperforms the k-NN and SVM.
The disagreement within one grade between the results of
the RBF NN and the clinical assessment is 94.18% for the
HB overall grading, which is 5.38% higher than SVM and
70
75
80
85
90
95
100
Percentage of disagreement within 1 grade
Forehead
Eye
tight
Eye
gentel
Nasal Mouth
Overall
H-B
RBF
k-NN
SVM
Figure 14: Comparison of the performance of three RBF, k-NN,
SVM.
10.71% higher than k-NN. The variation of the performance
for RBF NN is similar to that of SVM. Both RBF NN and
SVM provide more stable results than the k-NN. The varia-
tion of the results of disagreement within 1 grade is shown in
Ta bl e 5.
The RBF network has similar structure as SVM with
Gaussian kernel. RBF networks are typically trained in a
maximum likelihood framework by minimizing the error.
SVM takes a different approach to avoid overfitting by max-
imizing the margin. Although SVM outperforms RBF net-
works from the theoretical view, they can be competitive
when the dimensionality of the input space is small. There
10 EURASIP Journal on Image and Video Processing
Table 3: Test data performance of k-NN.
Disagreement 0 1 2 3 4 5 ≤ 1
Forehead 65.33 21.12 5.79 4.61 3.15 0 86.45
Eye gentle 39.91 44.57 7.73 5.90 1.89 0 84.48
Eye tight 36.73 45.62 6.65 5.28 5.72 0 82.35
Nose 55.68 21.83 13.47 7.11 1.91 0 77.51
Mouth 44.01 35.19 11.62 8.35 0.83 0 79.20
HB 58.13 25.26 12.88 3.73 0 0 83.39
Table 4: Test data performance of SVM with Gaussian radial basis function kernel.
Disagreement012345≤ 1
Forehead 65.98 25.14 7.22 1.66 0 0 91.12
Eye gentle 41.05 44.32 9.81 4.82 0 0 85.37
Eye tight 38.79 48.33 10.88 2.10 0 0 87.12
Nose 59.28 23.45 14.32 2.95 0 0 82.73
Mouth 43.37 37.11 17.58 1.94 0 0 80.48
H-B 59.73 29.07 11.2 0 0 0 88.80
Table 5: The variation of the performance (Disagreement ≤ 1).
RBF k-NN SVM
Forehead 5.6% 8.1% 7.1%
Eye gentle 11.3% 14.6% 10.7%
Eye tight 11.0% 15.2% 10.2%
Nose 9.1% 13.5% 8.0%
Mouth 10.2% 14.2% 9.3%
HB 7.1% 13.3% 7.8%
are only 4 or 5 inputs in our work. The centers of each
RBF NN were initialized using the k-means clustering algo-
rithm before starting training. Experiments show that RBF
networks can discover the nonlinear associations better than
SVM and k-NN in our application.
6.3. Discussion
The most encouraging aspect of these results is that the dis-
agreement within one grade between the results of the RBF
NN and the clinical assessment was around 90% for regional
grading and 94% for the HB overall grading. The best that
clinical assessment alone can achieve is usually an inter- or
intraobserver variation of at least one grade. The system is
objective and stable as it provides the same regional results
and HB grade during the analysis of different videos taken
from the same subjects on the same day whereas clinicians
have inconsistent assessments.
The subjects who could not finish the prescribed move-
ments correctly failed to be correctly classified. The patients
were asked to practice the prescribed facial movements be-
fore being videotaped. These practice runs help minimize the
noncorrespondence error.
The results show that the best agreement is in the fore-
head region as in this region the optical flow can be estimated
with a high degree of accuracy. The estimation of the optical
flow in the eye region has poor performance, especially for
those faces with makeup or very irregular wrinkles on the
eyelids. The structure of the eyebrows does not change sig-
nificantly during raising of the eyebrows but the structure
of eyes changed significantly when performing eye closure.
The error of optical flow estimation in the other regions is
the major reason for their disagreement being greater than
1grade.Moreeffective algorithms for the optical flow esti-
mation should be investigated to offer more reliable results
and for better performance of the networks for regional mea-
surement. The disagreements between the clinical and the es-
timated H-B values are greater than 1 grade only when the
regional results introduce a higher average error.
The proposed algorithms have been implemented in Java
with Java Media Framework (JMF) and ImageJ. The average
video with 500 frames can be processed in 3 minutes on a
1.73 GHz laptop. This overall processing time should satisfy
the requirement of the practicing physician.
7. CONCLUSION
We have proposed an automatic system that combines facial
feature detection, face motion extraction, and facial nerve
function assessment by RBF networks. The total pixel change
was used to measure the magnitude of motion. The optical
flow is computed and analyzed to identify the symmetry rel-
ative to strength and direction on each side of the face. RBF
neural networks are applied to offer regional palsy grades
and HB overall palsy grade. The results of regional evalu-
ation in forehead and the overall HB grade are the more
reliable. The errors are mainly introduced by nonstandard
facial movements and the incorrect estimation of the opti-
cal flow. Therefore, encouraging patient to perform the key
movements correctly and a more accurate estimation of op-
tical flow should improve the performance of the system.
The present results are encouraging in that they indicate
that it should be possible to produce a reliable and objective
Shu He et al. 11
method of measuring the degree of a facial palsy in a clinical
setting.
REFERENCES
[1] C. Diamond and I. Frew, The Facial Nerve, Oxford University
Press, Oxford, UK, 1979.
[2] J. W. House, “Facial nerve grading systems,” Laryngoscope,
vol. 93, no. 8, pp. 1056–1069, 1983.
[3]C.H.G.BeurskensandP.G.Heymans,“Positiveeffects of
mime therapy on sequelae of facial paralysis: stiffness, lip mo-
bility, and social and physical aspects of facial disability,” Otol-
ogy & Neurotology, vol. 24, no. 4, pp. 677–681, 2003.
[4] J. B. Kahn and R. E. Gliklich, “Validation of a patient-graded
instrumnet for facial nerve paralysis: the FaCE scale,” Laryn-
goscope, vol. 111, no. 3, pp. 387–398, 2001.
[5] J. Linstrom, “Objective facial motion analysis in patients with
facial nerve dysfunction,” Laryngoscope, vol. 112, no. 7, pp.
1129–1147, 2002.
[6] H. Scriba, S. J. Stoeckli, D. Veraguth, and U. Fisch, “Objec-
tive evaluation of normal facial function,” Annals of Otology,
Rhinology & Laryngology, vol. 108, no. 7, part 1, pp. 641–644,
1999.
[7] P. Dulguerov, F. Marchal, and D. Wang, “Review of objective
topographic facial nerve evaluation methods,” American Jour-
nal of Otology, vol. 20, no. 5, pp. 672–678, 1999.
[8]S.McGrenary,B.F.O’Reilly,andJ.J.Soraghan,“Objective
grading of facial paralysis using artificial intelligence analy-
sis of video data,” in Proceedings of the 18th IEEE Symposium
on Computer-Based Medical Systems(CBMS ’05), pp. 587–592,
Dublin, Ireland, June 2005.
[9] J. G. Neely, A. H. Joaquin, L. A. Kohn, and J. Y. Cheung,
“Quantitative assessment of the variation within grades of fa-
cial paralysis,” Laryngoscope, vol. 106, no. 4, pp. 438–442, 1996.
[10] T. D. Helling and J. G. Neely, “Validation of objective measures
for facial paralysis,” Laryngoscope, vol. 107, no. 10, pp. 1345–
1349, 1997.
[11] J. G. Neely, “Advancement in the evaluation of facial func-
tion,” in Advances in Otolaryngology—Head and Neck Surgery,
vol. 15, pp. 109–134, Elsevier Science, New York, NY, USA,
January 2002.
[12] G. S. Wachtman, Y. Liu, T. Zhao, et al., “Measurement of asym-
metry in persons with facial paralysis,” in Proceedings of Com-
bined Annual Conference of the Robert H. Ivy and Ohio Valley
Societies of Plastic and Reconstructive Surgeons, Pittsburgh, Pa,
USA, June 2002.
[13] Y. Liu, K. L. Schmidt, J. F. Cohn, and S. Mitra, “Facial asym-
metry quantification for expression invariant human identi-
fication,” Computer Vision and Image Understanding, vol. 91,
no. 1-2, pp. 138–159, 2003.
[14] M H. Yang, D. J. Kriegman, and N. Ahuja, “Detecting faces
in images: a survey,” IEEE Transactions on Pattern Analysis and
Machine Intelligence, vol. 24, no. 1, pp. 34–58, 2002.
[15] M. H. Yang, “Recent advances in face detection,” in Proceedings
of 17th International Conference on Pattern Recognition (ICPR
’04), Cambridge, UK, August 2004.
[16] G. C. Feng and P. C. Yuen, “Multi-cues eye detection on gray
intensity image,” Pattern Recognition, vol. 34, no. 5, pp. 1033–
1046, 2001.
[17] J. Rurainsky and P. Eisert, “Template-based eye and mouth de-
tection for 3D video conferencing,” in Visual Content Process-
ing and Representation, vol. 2849 of Lecture Notes in Computer
Science, pp. 23–31, Springer, Berlin, Germany, 2003.
[18] L. G. Farkas, Anthropometry of the Head and Face, Raven Press,
New York, NY, USA, 1995.
[19] S. M. Smith and J. M. Brady, “SUSAN—a new approach to
low level image processing,” International Journal of Computer
Vision, vol. 23, no. 1, pp. 45–78, 1997.
[20] M. Hess and G. Martinez, “Facial feature extraction based on
the smallest univalue segment assimilating nucleus (SUSAN)
algorithm,” in Proceedings of the Picture Coding Symposium
(PCS ’04), San Francisco, Calif, USA, December 2004.
[21] C. Guestrin and F. Cozman, “Image stabilisation for fea-
ture tracking and generation of stable video overlays,” Tech.
Rep. CMU-RI-TR-97-42, Robotics Institute, Carnegie Mellon
University, Pittsburgh, Pa, USA, November 1997.
[22] M. Elad and A. Feuer, “Recursive optical flow estimation—
adaptive filtering approach,” in Proceedings of the 19th Con-
vention of Electrical and Electronics Engineers (EEIS ’96),pp.
387–390, Jerusalem, Israel, November 1996.
[23] J. L. Barron and D. J. Fleet, “Performance of optical flow
techniques,” International Journal of Computer Vision, vol. 12,
no. 1, pp. 43–77, 1994.
[24] S. Baker and I. Matthews, “Lucas-Kanade 20 years on: a uni-
fying framework,” International Journal of Computer Vision,
vol. 56, no. 3, pp. 221–255, 2004.
[25] W. Duch and N. Jankowski, “Transfer function : hidden possi-
bilitiesforbetterneuralnetworks,”inProceedings of the 16th
European Symposium on Artificcial Neural Networks Bruges
(ESANN ’01), pp. 81–94, Bruges, Belgium, April 2001.