Báo cáo hóa học: " Research Article Telescopic Vector Composition and Polar Accumulated Motion Residuals for Feature Extraction in Arabic Sign Language Recognition" pdf
Bạn đang xem bản rút gọn của tài liệu. Xem và tải ngay bản đầy đủ của tài liệu tại đây (1.23 MB, 10 trang )
Hindawi Publishing Corporation
EURASIP Journal on Image and Video Processing
Volume 2007, Article ID 87929, 10 pages
doi:10.1155/2007/87929
Research Article
Telescopic Vector Composition and Polar Accumulated
Motion Residuals for Feature Ex traction in Arabic Sign
Language Recognition
T. Shanableh
1
and K. Assaleh
2
1
Department of Computer Science, College of Engineering, American University of Sharjah, P.O. Box 26666,
Sharjah, United Arab Emirates
2
Department of Electrical Engineering, College of Engineering, American University of Sharjah, P.O. Box 26666,
Sharjah, United Arab Emirates
Received 9 January 2007; Revised 1 May 2007; Accepted 2 August 2007
Recommended by Thierry Pun
This work introduces two novel approaches for feature extraction applied to video-based Arabic sign language recognition, namely,
motion representation through motion estimation and motion representation through motion residuals. In the former, motion
estimation is used to compute the motion vectors of a video-based deaf sign or gesture. In the preprocessing stage for feature
extraction, the horizontal and vertical components of such vectors are rearranged into intensity images and transformed into the
frequency domain. In the second approach, motion is represented through motion residuals. The residuals are then thresholded
and transformed into the frequency domain. Since in both approaches the temporal dimension of the video-based gesture needs
to be preserved, hidden Markov models are used for classification tasks. Additionally, this paper proposes to project the motion
information in the time domain through either telescopic motion vector composition or polar accumulated differences of motion
residuals. The feature vectors are then extracted from the projected motion information. After that, model parameters can be
evaluated by using simple classifiers such as Fisher’s linear discriminant. The paper reports on the classification accuracy of the
proposed solutions. Comparisons with existing work reveal that up to 39% of the misclassifications have been corrected.
Copyright © 2007 T. Shanableh and K. Assaleh. This is an open access article distributed under the Creative Commons Attribution
License, which permits unrestricted use, distribution, and reproduction in any medium, provided the original work is properly
cited.
1. INTRODUCTION
Although used in over 21 countries covering a large geo-
graphical and demographical portion of the world, Arabic
sign language (ArSL) has received little attention in sign
language recognition research. To date, only small num-
ber of research papers has been published on ArSL. Signer-
independent recognition of Arabic sign language alphabet
using polynomial networks was reported in [1]. More re-
cently, the authors introduced the recognition of Arabic iso-
lated gestures by computing the prediction error between
successive images using either forward prediction or bidirec-
tional prediction. The Absolute differences are transformed
into the frequency domain. Feature vectors are then extracted
from the frequency coefficients [2].
Related work on recognition of non-Arabic using
temporal-domain feature extraction mainly rely on compu-
tationally expensive motion analysis approaches such as mo-
tion estimation. Moreover, since the temporal characteris-
tics are preserved, classification can be done using hidden
Markov models (HMMs).
For instance, in [3] the authors proposed to extract spa-
tial and temporal image features. The temporal features are
based on the thresholded difference between two successive
images. The spatial features are extracted from the skin color
and edge information. A logical AND is a binary opera-
tion which is known in the literature, AND is then applied
to combine the temporal and spatial features. The solution
is further enhanced by applying Fourier descriptors to ex-
tracted boundaries of hand shapes. Likewise, temporal anal-
ysis is enhanced, albeit at a high computational cost, by the
use of motion estimation. The temporal features are then ex-
tracted from the distribution of the magnitude and phase of
the motion vectors. Combining Fourier descriptors with the
motion analysis using an HMM classifier resulted in a clas-
sification accuracy of 93.5%. Classification based on Fourier
descriptors only resulted in 90.5% accuracy. In [4]feature
extraction starts by splitting sentences with limited grammar
2 EURASIP Journal on Image and Video Processing
Table 1: Arabic sign language gestures and their english meanings.
No.
1
2
3
4
5
6
7
8
9
10
11
12
No.
13
14
15
16
17
18
19
20
21
22
23
Arabic
word
Meaning
in English
Arabic
word
Meaning
in English
I/me
House
Shame
Come in
Thank you
We lc om e
Peace
upon you
Enemy
Gift
Guest
Neighbor
Friend
To c o m e
To g o
Ye s t e r d a y
To h e lp
To s m el l
To s t o p
talking
To l i st e n
To w a ke u p
To drink
To s l ee p
To e a t
into video gestures. Image segmentation is then used to seg-
ment out the hands. This task is very reasonable taking into
account the cap-mounted camera pointed downwards to-
wards the hands. The features are then extracted from the
following parameters: pixel-wise image differences, angle of
the least inertia, the length of the associated eigenvector, and
the ratio between the major axis and the minor axis of the
enclosing ellipse. Again, HMMs are used for the classifica-
tion. The reported classification accuracy is 91.9% for a re-
stricted grammar. In [5] similar regions of interest (ROI)
across frames are tracked. ROIs are identified through skin
color and geometric cues. Motion trajectories are then ex-
tracted from the concatenation of the affine transformations
associated with these regions. Time-delay neural networks
are used for classification. The reported classification accu-
racy is 96.21% based on 40 American Sign Language gestures.
This work proposes an enhancement of ArSL recognition
rates via an assortment of novel feature extraction schemes
using the same dataset as the one described in [2].
This paper is organized as follows. Section 2 describes
the compiled Arabic sign language dataset. Section 3 intro-
duces the proposed feature extraction schemes. Mainly, they
include motion representation through motion estimation,
telescopic vector composition, motion residuals, and polar
accumulated differences (ADs). Section 4 explains the exper-
imental setup and presents the experimental results. Com-
parisons against existing solutions are also elaborated upon.
Section 5 concludes the discussion.
2. DATASET DESCRIPTION
As the authors reported in [2], Arabic Sign Language does
not yet have a standard database that can be purchased or
publicly accessed. Therefore, we decided to collect our own
ArSL database. We have collaborated with (Sharjah City for
Humanitarian Services (SCHS) Sharjah, UAE) [6], and ar-
ranged for collecting ArSL data. In this first phase of our data
collection, we have collected a database of 23 Arabic gestured
words/phrases from 3 different signers. The list of words is
shown in Ta bl e 1.
Each of the three signers was asked to repeat each gesture
50 times over three different sessions resulting in a total of
150 repetitions of the 23 gestures which correspond to 3450
video segments. The signer was videotaped using an analog
camcorder without imposing any restriction on clothing or
image background. The video segments of each session were
digitized and partitioned into short sequences representing
each gesture individually. Note that the proposed feature ex-
traction schemes do not impose any restrictions on the selec-
tion of the frame sampling rate.
3. FEATURE EXTRACTION SCHEMES
Two solutions for feature extraction schemes are proposed:
motion estimation and motion residuals. Both solutions are
discussed with respect to two different extraction scenar-
ios: time-dependent and time-independent feature extrac-
tion schemes.
3.1. 1 Motion estimation
In this section the motion of video-based gestures is rep-
resented by their motion vectors. Block-based motion esti-
mation between successive images is used to generate such
vectors. The input images are divided into nonoverlapping
blocks. For each block, the motion estimation process will
search through the previous image for the “best match” area
within a given search range. The displacement between the
current block and its best match area in the previous image
is represented by a motion vector.
More formally, let C denote a block in the current image
with b
× b pixels at coordinates (m, n). Assuming that the
maximum motion displacement is w pixel per frame then the
task of the motion estimation process is to find best match
area P within the (b +2w)(b +2w) distinct overlapping b
×b
blocks of the previous image. An area in the previous image
that minimizes a certain distortion measure is selected as the
best match area. A common distortion measure is the mean
Absolute difference given by
M(Δx,Δy)
=
1
b
2
b
m=1
b
n=1
C
m,n
− P
m+Δx,n+Δy
,
− w ≤ Δx, Δy ≤ w,
(1)
where Δx, Δy refer to the spatial displacement between the
pixel coordinates of C and the matching area in the previous
image. Other distortion measures can be used such as mean-
squared error, cross correlation functions, and so forth.
Clearly the motion estimation process is computation-
ally expensive. Many suboptimal algorithms are reported to
speedup the computation at the cost of increasing the en-
tropy of the prediction error. In such algorithms, a subset of
the (b+2w)(b +2w) overlapping locations are searched, thus
no guarantees of finding the best matched area.
An example of fast motion estimation algorithms is 2D
logarithmic search with a maximum number of search po-
sitions of 2 + 7 log
2
w [7]. Other examples are the cross-
search algorithm maximum number of search positions of
3+2w [8]. More recently, a fast block-matching algorithm
T. Shanableh and K. Assaleh 3
called center-prediction and early-termination-based mo-
tion search algorithm (CPETS) was proposed [9]. The al-
gorithm reduces 95.67% of encoding time in average com-
pared with the full-search approach yet a negligible loss in
peak signal-noise ratio (PSNR) is reported. Further details
on motion estimation can be found in [10] and references
within.
3.1.1. 1 Motion vector feature extraction schemes
Feature extraction follows the estimation of motion vectors
using one of the following approaches: time-dependent and
time-independent feature extraction schemes. In the former
extraction approach, the temporal dimension of successive
images is preserved, while in the latter, the motion vectors of
successive images are accumulated into a representative and
concise set of feature vectors.
(a) Time-dependent feature extraction
In this approach, the motion vectors of each two successive
images are estimated and split into their x and y components.
Each motion vector component is then rearranged into an
intensity image. The dimensions of such an image are pro-
portional to the motion estimation block size and width and
height of the gesture images. In this work, we experiment
with a block size of 8
× 8 and the input images have a di-
mension of 360
×288 pixels. The x and y intensity images are
then concatenated into one image f having dimensions m
×n
that visually describes the location and intensity of motion
between two successive images.
The concatenated image is then transformed into the
frequency domain using 2D discrete cosine transformation
(DCT) given by
F(u, v)
=
2
√
MN
C(u)C(v)
M−1
i=0
N
−1
j=0
f (i, j)
× cos
πu
2M
·(2i +1)
cos
πv
2N
·(2j +1)
,
(2)
where N
× M are the dimensions of the input image “f ”and
F(u,v) is the DCT coefficient at row u and column v of the
DCT matrix. C(u) is a normalization factor equal to 1/
√
2
for u
= 0and1otherwise.
An attractive property of the DCT transformation is its
energy compaction. Thus, the input concatenated image f
having dimensions m
×n can be represented by zonal coding
of the DCT coefficients via a zigzag scanned path into an n-
dimensional vector [11]. This dimensionality is empirically
determined as illustrated in the experimental results section.
The block diagram of the proposed feature extraction ap-
proach is shown in Figure 1.
Note that the above feature extraction is repeated for each
pair of consecutive images, thus the temporal dimension of
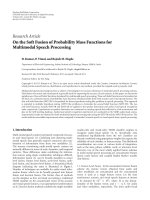
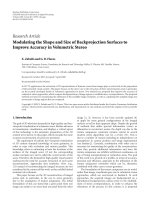
the gesture images is preserved. Figure 2 shows an example
of applying this feature extraction scheme to gesture 3. The
figure shows the vertical concatenation of the MVx and MVy
Feature vector
Zonal coding
2D DCT
Concatenate images
Rearrange
as an image
Rearrange
as an image
MVx
component
MVy
component
Motion
estimation
Image
t−1
Image
t
Figure 1: Block diagram of time-dependent feature extraction from
motion vectors.
intensity images as a result of the block-based motion esti-
mation processes.
In the experimental results section, hidden Markov mod-
els will be used to train and classify such time-dependent fea-
ture vectors.
(b) Time-independent feature extraction
On the other hand, the motion vectors of a gesture video can
be accumulated into one image prior to feature extraction.
This section proposes to compute the vectorial sum of coin-
ciding motion vectors across the motion vector intensity im-
ages. We will refer to this block-wise summation of motion
vectors as telescopic vector composition (TVC). Note that
TVC has been successfully employed in the context of tem-
poral subsampling in digital video transcoding as reported
by the author in [12]. The block-wise summed motion vec-
tors are then split into x and y components and rearranged
into separate intensity images. Again, the resultant inten-
sity images are concatenated, DCT transformed, and zonal
coded. This proposed feature extraction scheme is illustrated
in Figure 3.
In this case, the whole video-based gesture is represented
by one feature vector only. Figure 4 shows an example of ap-
plying this feature extraction scheme to gesture 3 (shown in
Figure 2(a)). The figure shows the vertical concatenation of
the telescopic vector composition of the MVx and MVy in-
tensity images as a result of the block-based motion estima-
tion processes.
In the experimental results section, simple pattern recog-
nition techniques such as K-nearest neighbor (KNN) and
linear classifier will be used to train and classify such time-
independent feature vectors.
4 EURASIP Journal on Image and Video Processing
(a) Input image sequence, gesture 3 (Guest)
(b) Resultant MVx and MVy intensity images
Figure 2: An example of time-dependent feature extraction from motion vectors.
Feature vector
Zonal coding
2D DCT
Concatenate images
Rearrange
as an image
Rearrange
as an image
MVx
component
MVy
component
MV
t
component
MV
t+n
component
Block-based
MV adder
···
···
Motion
estimation
Motion
estimation
Image
t−1
Image
t
Image
t+n−1
Image
t+n
Figure 3: Block diagram of time-independent feature extraction
from motion vectors.
Figure 4: An example of time-independent feature extraction from
motion vectors.
3.2. 2 Motion residuals
This section proposes to track the motion by examining the
intensity of the motion residuals or prediction error. This is
computed from the difference between two successive images
without the need for the computationally expensive motion
estimation process.
The image difference between two successive images is
computed and thresholded. The threshold can be the mean
of moving pixels (i.e., mean of nonzero pixel differences),
one standard deviation above the mean or zero. Clearly there
is a tradeoff between the threshold value and the accurate
representation of the motion. Setting it to zero results in
treating all pixel differences as motion; setting it to a high
value results in discarding some motion information, and so
forth. Following [2], the value of the threshold was deter-
mined empirically and set to the mean intensity of moving
pixels.
Similar to the previous section, we propose two ap-
proaches for obtaining the feature vectors using prediction
errors, namely: time-dependent and time-independent fea-
ture extraction schemes.
3.2.1. Time-dependent feature extraction
In this approach, the image differences between each pair of
successive images are computed. Only pixel differences above
the threshold are retained and the rest are set to zero. The
resultant prediction error is then transformed into the fre-
quency domain using DCT transformation. The feature vec-
tors are then generated by means of zonal coding at a given
cutoff. Since this process is repeated for each pair of succes-
sive images, then the resultant feature vectors retain the tem-
poral dimension of the video-based gesture.
On the other hand, binary thresholding can be used for
a more abstract representation of the prediction error. In
this case, the pixel differences above the threshold are set
to unity and the rest are set to zero. The resultant predic-
tion error is then transformed to the frequency domain us-
ing 2D Walsh-Hadamard transformation (WHT) rather than
DCT. The former transformation is known for its simplicity
T. Shanableh and K. Assaleh 5
and suitability for binary images. The WHT has binary ba-
sis functions thus has a higher correlation with the binary-
thresholded prediction error. The smoothly varying cosine
terms of the DCT basis functions on the other hand are not a
good choice in this case. The WHT has the following kernel:
h(x, y, u, v)
=
1
2
m
(−1)
m=1
i
=0
b
i
(x)p
i
(u)+b
i
(y)p
i
(v)
,(3)
where m is the number of bits needed to represent a pixel
value, b
i
(x) is the ith binary bit from right to left, and p
i
(u) =
b
m−i
(u)+b
m−i−1
(u). All sums are performed in modulo 2
arithmetic [13].
3.2.2. Time-independent feature extraction
This section introduces the use of polar accumulated differ-
ence (ADs) in a first tier of feature extraction. The section
also reviews two solutions for a second tier of feature extrac-
tion. Lastly, we propose a two tier feature extraction scheme
that combines the aforementioned solutions.
(a) First tier of feature extraction
During the first tier of feature extraction, the motion infor-
mation is extracted from the temporal domain of the input
image sequence through successive image differencing. Let
I
(j)
g,i
denote image index j of the ith repetition of a gesture at
index g. The image formed from the ADs can be computed
by
AD
g,j
=
n−1
j=1
∂
j
I
(j)
g,j
− I
(j−1)
g,i
,(4)
where n is the total number of images in the ith repetition of
a gesture at index g,and∂
j
is a binary threshold function of
the jth frame.
While Absolute ADs detect the motion that an object un-
dergoes regardless of its direction, polar ADs, on the other
hand, preserve the directionality of that motion. ADs can
be categorized into three types: Absolute (
|AD|), Positive
(AD
+
), and Negative (AD
−
). These can be defined as follows:
|AD|(x, y)
=
AD + 1 if
f
x, y, t
k
− f
x, y, t
k−1
≥
Th
(k,k−1)
,
AD, otherwise,
AD
+
(x, y)
=
AD
+
+1 if
f
x, y, t
k
− f
x, y, t
k−1
≥ Th
(k,k−1)
,
AD
+
, otherwise,
AD
−
(x, y)
=
AD
−
+1 if
f
x, y, t
k
−
f
x, y, t
k−1
≤
Th
(k,k−1)
,
AD
−
, otherwise,
(5)
where (x, y) are the pixel coordinates of the ADs image.
The Absolute ADs approach was proposed for sign language
recognition by the authors in [2].Here,weextendthiswork
by experimenting with polar ADs (i.e., AD
+
and AD ). Note
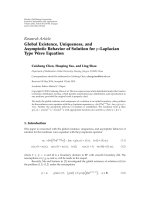
(a) Polar ADs images (b) Absolute ADs image
Figure 5: Examples of ADs images.
that the latter ADs have been successfully used in the recog-
nition of Arabic handwritten alphabets as reported in [14].
Figure 5 shows examples of applying the above ADs ap-
proaches to gesture 3 (shown in Figure 2(a)).
(b) Second tier of feature extraction
Once the ADs images are computed, a second tier of fea-
ture extraction is applied. Two different approaches are em-
ployed: (a) 2D discrete cosine transformation (DCT) fol-
lowed by zonal coding, and (b) Radon transformation fol-
lowed by lowpass filtering. Thus, in addition to 2D transfor-
mations, we also experiment with image projections through
Radon transformation. The pixel intensities of the ADs are
projected at a given angle θ using the following equation:
R
θ
(x) =
+∞
−∞
f (x
cos θ − y
sin θ, x
sin θ + y
cos θ)dy
,
(6)
where f is the input image, and the line integral is parallel to
the y
axis, where x
and y
are given by
x
y
=
cos θ sin θ
−sin θ cos θ
x
y
. (7)
The resultant projection is then coarsely represented by
transforming it into the frequency domain using a 1D DCT
followed by an ideal lowpass filter.
(c) Two-tier feature extraction
The aforementioned first and second tiers of feature extrac-
tion schemes are merged using either polar accumulated dif-
ferences or vectorized polar accumulated differences.
In the polar accumulated differences approach, the Posi-
tive and Negative ADs images are concatenated into one im-
age prior to the second tier of feature extraction as shown
in Figure 6. The second tier feature extraction follows the
methodology used in [2], where either 2D DCT or Radon
6 EURASIP Journal on Image and Video Processing
Cutoff
2D DCT & zonal
coding
or
Radon & ideal
lowpass filtering
Feature
vector
Negative
ADs
Gesture
frames
Positive
ADs
Concatenate
as an image
Figure 6: Polar accumulated differences.
Feature
vector
2D DCT &
zonal coding
or
Radon & ideal
lowpass
filtering
2D DCT &
zonal coding
or
Radon & ideal
lowpass
filtering
Concatenate
into one vector
Feature vectors
Negative
ADs
Gesture
frames
Positive
ADs
Figure 7: Vectorized accumulated differences with 2D transforma-
tion.
transformation is applied to the image formed by the ADs. In
case of 2D DCT, the transformed image is zonal coded with
different cutoff values. On the other hand, if Radon trans-
formation is applied, then the projected image is 1D DCT
transformed followed by ideal lowpass filtering.
On the other hand, in vectorized polar accumulated differ-
ences approach, the Positive and Negative ADs are computed.
A second tier of feature extraction is then applied to each of
the ADs images. The concatenation is thereafter applied to
the resultant feature vectors. This approach is illustrated in
Figure 7.
4. EXPERIMENTAL RESULTS
This section presents the experimental results for the various
feature extraction schemes described above. Training is done
in an offline mode, and model parameters are uploaded to
the recognition stage. Offline training mode is usually done
when the training data is large (due to large number of classes
or excessive variability within each class) or the recognition
is in user-independent mode. The gesture database is divided
into training and testing sets. As we mentioned in Section 2,
the database is composed of video sequences corresponding
10 20 30 40 50 60 70 80 90 100
Zonal cutoff
0.7
0.75
0.8
0.85
0.9
0.95
1
Classification rate
Motion residuals + 2D DCT
Concat MV images + 2D DCT
Motion residuals + 2D WH
2D DCT of MV images + concat vectors
Figure 8: Classification results for the proposed motion estima-
tion versus motion residuals approaches. Hidden Markov models
are used.
to 23 different gestures (classes) each of which is repeated 50
times by 3 different signers. In this classification mode, we
have used 70% of the data for training and the remaining
30% for testing. The training and testing sets contain mixed
samples of all signers. The classification results in the figures
to follow show the average classification rate of the 23 ges-
tures.
Additionally, in the following experiments, the motion
estimation search range is set to 16
×16 pixels and the blocks
size is 4
× 4 pixels. Such parameters are commonly used in
digital video compression.
4.1. 1 HMM-based classification
This section classifies the sign language data using hidden
Markov models (HMMs). Throughout the experiments, we
have used the left to right HMM architecture where a state
can only transit to its immediate right neighbor or stay in
the same state. The training method applied is the Baum-
Welch algorithm and the number of states for the training
set is empirically determined to be 2, 3, or 4 according to the
complexity of the gesture. Each gesture was visually analyzed
to determine the number of the distinct movements that a
signer makes while performing that gesture. The number of
states was estimated accordingly. As for the number of Gaus-
sian mixtures for the training set, we have experimented with
2, 3, and 4 Gaussian mixtures and obtained slight variations
in the recognition rates over the 23 gestures of the validation
set. However, we found that 3 mixtures resulted in a slight
improvement in the overall recognition rates. Further infor-
mation on HMMs can be found in [15].
In this approach, the temporal dimension of the input
image sequence is preserved. As pointed out previously, the
feature extraction step preserves the Absolute motion resid-
uals between successive images without accumulating them
into one image. The Absolute motion residuals are then
thresholded, binarized, transformed into the frequency do-
main, and converted into a sequence of feature vectors using
zonal coding.
T. Shanableh and K. Assaleh 7
10 20 30 40 50 60 70 80 90 100
Zonal cutoff
0.55
0.6
0.65
0.7
0.75
0.8
0.85
0.9
0.95
1
Classification rate
TV C + concat as vectors
Polar ADs + concat as image
TV C + concat as images
Polar ADs + concat as vectors
Figure 9: Classification results for the proposed TVC versus polar
ADs. 1NN is used for classification.
10 20 30 40 50 60 70 80 90 100
Zonal cutoff
0.55
0.6
0.65
0.7
0.75
0.8
0.85
0.9
0.95
1
Classification rate
TV C + TH(0) + concat as images
TVC + TH(mean + sigma) + concat as images
TVC + TH(mean) + concat as images
Polar ADs + concat as image
Figure 10: Classification results for the thresholded TVC versus po-
lar ADs. 1NN is used for classification.
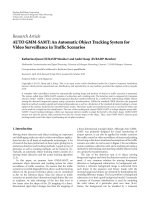
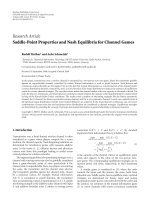
In Figure 8, a comparison of the classification results of
the motion estimation and the motion residual approaches
is presented. In the figure, “Concat MV images + 2D DCT”
and “2D DCT of MV images + concat vectors” refer to the
feature extraction schemes of Section 3.1.1(a). In the former,
the intensity images of the MVs are concatenated and trans-
formed using 2D DCT. While in the latter, each MV inten-
sity image is transformed separately. The zonal coefficients
of each transformed image are then concatenated into one
feature vector.
Despite its simplicity, the latter approach exhibits higher
classification results at all DCT zonal cutoffs. Due to its dis-
tortion measure, there are no guarantees that the motion es-
timation approach will capture the true motion in an im-
age sequence. Rather, the motion vectors will blindly point to
the location that minimizes the mean Absolute differences or
mean-squared differences. Additionally, the maximum mo-
tion displacement might exceed the w pixelsperframeasil-
lustrated in (1) hence the computed motion vector might not
capture the true motion of the sequence.
The figure also shows that concatenating the images of
the motion vector components prior to zonal coding out-
performs concatenating the feature vectors. Lastly, the fig-
ure shows that applying the 2D WHT to the binarized and
thresholded motion residuals outperforms the 2D DCT ap-
proach. As mentioned previously, the binary basis functions
60 70 80 90 100
DCT cutoff
1
2
3
4
5
Error rate (%)
Absolute ADs
Proposed polar ADs
Proposed vectorized polar ADs
Figure 11: Fisher’s linear discrimination with 2D transformation
and zonal coding.
60 70 80 90 100
DCT cutoff
8
10
12
14
16
18
Error rate (%)
Absolute ADs
Proposed polar ADs
Proposed vectorized polar ADs
Figure 12: Fisher’s linear discrimination with vertical Radon trans-
formation and ideal lowpass filtering.
of the 2D WHT, as opposed to the sinusoidal basis functions
of the DCT, correlate well with the binarized motion residues
hence the more accurate classification rate.
4.2. 2 KNN-based classification
This section presents the experimental results for the pro-
posed time-projections techniques. Here, the whole video se-
quence of motion vector images or motion residuals is pro-
jected into one image which is then 2D DCT transformed
and zonal coded. As such, HMMs are no longer needed or
even applicable to model estimation and classification rather,
simple classifiers like KNN can be used.
Figure 9 compares between the polar ADs and the tele-
scopic vector composition (TVC) techniques. It is shown that
the polar ADs of the motion residuals outperforms the TVC
approach. The KNN and HMM classification results are quite
similar, thus reinforcing the discussion in Figure 8 regarding
the differences between the motion residuals and motion es-
timation solutions. When using KNN classifiers, it is worth
mentioning that the projection of the temporal dimension
via the polar accumulated differences and the telescopic vec-
tor composition schemes yields comparable recognition re-
sults to those obtained by HMMs.
Further examination of the motion estimation approach
reveals the sensitivity of such a process. Clearly, the block
8 EURASIP Journal on Image and Video Processing
G#
1 2 3 4 5 6 7 8 9 1011121314151617181920212223
23
22
21
20
19
18
17
16
15
14
13
12
11
10
9
8
7
6
5
4
3
2
142
44
43
32
42
42
38
37
44
44
39
30
40
40
45
41
41
27
43
42
43
42
39
1
4
2
1
2
1
2
1
1
1
1
1
1
1
1
2
4
1
1
1
1
3
2
1
3
1
5
1
1
2
1
2
3
2
3
1
1
3
5
3
3
3
3
4
7
11
1
1
1
1
(a) Vectorized Radon transformation of polar accumulated difference
G#
1 2 3 4 5 6 7 8 9 1011121314151617181920212223
23
22
21
20
19
18
17
16
15
14
13
12
11
10
9
8
7
6
5
4
3
2
145
44
43
45
43
45
41
41
44
45
45
45
42
44
45
44
45
43
44
44
43
44
45
1
1
1
1
1
4
4
1
2
2
1
1
(b) Vectorized2DDCT2ofpolaraccumulateddifference
Figure 13: Confusion matrices for the vecotrized 2D DCT and Radon transformation schemes of Figures 11 and 12.
matching approach minimizes a distortion criterion for all
the blocks in a given image. Thus motion vectors might be
calculated for blocks that do not represent the motion of a
gesture. Such motion vectors can belong to the body, rather
than the hands of the signer or can even belong to the back-
ground in cases of luminance changes for instance. However,
it is observed that such motion vectors have a relatively small
magnitude, therefore, can be detected and thresholded for
better representation of the motion.
This idea is implemented and its results are shown in
Figure 10. We experiment with 3 thresholds: the mean value
of nonzero motion vector components, one standard devia-
tion above the mean, and no thresholding. The figure shows
that setting the threshold to the mean generates the best clas-
sification results. An average increase of more than 10% in
classification accuracy is reported. Clearly setting the thresh-
old to one standard deviation above the mean generates
lower classification results. This is so because actual motion
T. Shanableh and K. Assaleh 9
information, which is accumulated into one intensity image,
is underrepresented by such a rather high threshold. The fig-
ure also shows that the thresholded TVC solution approaches
the classification results of the polar ADs at high zonal cut-
offs.
4.3. 3 Linear discrimination
In the following classification experiments, Fisher’s linear
discrimination is employed. The proposed polar ADs ap-
proaches are compared against the work reported in [2]
(thereafter referred to as “Absolute ADs”). For comparison
reasons in the following experiments, we plot the classifica-
tion error rates and elaborate upon the reduction in mis-
classifications brought by the proposed feature extraction
schemes.
In Figure 11, 2D transformations and zonal coding are
used for the second tier of feature extraction as explained in
Section 3.2.2. The proposed vectorized ADs of Figure 7 out-
perform the Absolute ADs. The figure also shows that re-
sults of concatenating the Positive and Negative ADs images
prior to the second tier of feature extraction (as proposed in
Figure 6) is comparable to the results of Absolute ADs up to
aDCTcutoff of 90 coefficients. In all cases, the figure shows
that a cutoff of 90 coefficients minimizes the classification er-
ror rate.
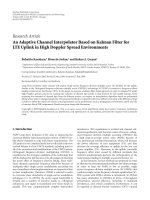
On the other hand, the classification gain of the pro-
posed solution is more pronounced with Radon transforma-
tion and ideal low pass filtering. Figure 12 shows that both
approaches of concatenating ADs images and concatenating
the feature vectors outperform the Absolute ADs for all val-
ues of DCT cutoff. For instance, at a cutoff of 60, the misclas-
sifications is reduced by 39.4%. The figure also shows that the
proposed polar ADs approach maintains stable linear separa-
bility even at low DCT cutoffs.
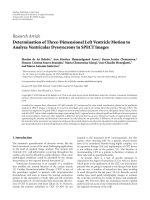
Comparing the classification results of Figures 11 and
12, it is clear that the feature extraction schemes based on
2D DCT are more accurate than the Radon transformation
schemes. Recall that in the latter schemes the ADs images
are projected at a given angle. Thus ADs images with similar
pixel intensities alongside the projection angle will have sim-
ilar Radon transform coefficients. Such ADs images might or
might not belong to the same gesture hence lower classifica-
tion results. This observation is further clarified in Figure 13
which displays the confusion matrices for both the vectorized
2D DCT approach of Figure 11 and the vectorized Radon
transform of Figure 12. For instance, part a of the figure
shows that gesture 18 (which translate to “To stop talking”)
is mainly confused with gesture 19 (which translate to “To
smell”). Figure 13(b) shows that such confusion is alleviated
with the 2D DCT approach. Other examples are also evident
in gestures 12 and 4.
5. CONCLUSION
In this paper we have proposed a number of feature ex-
traction schemes for Arabic sign language recognition. The
proposed schemes are categorized into time-dependent and
time-independent feature extractions. In the former, the
temporal dimension of the video-based gesture is retained.
The gesture’s motion is extracted by either motion estima-
tion or motion residuals. Hidden Markov models are then
used for model estimation and classification. It was shown
that feature extraction through motion residuals is superior
to the motion estimation scheme in terms of reducing the
computational complexity and achieving higher sign lan-
guage classification rates.
On the other hand, we have shown that the temporal di-
mension of the input video gesture can be removed by ac-
cumulating either the motion vectors or motion residuals
into one or two intensity images. This time-independent ap-
proach to feature extraction facilitates the use of simple clas-
sifiers such as KNN and linear classifiers instead of HMMs.
Lastly, it was shown that preserving the directionality of the
motion via the use of polar ADs outperformed the existing
solution based on Absolute ADs. It was shown that up to
39% of the misclassifications caused by the use of Absolute
ADs have been corrected.
ACKNOWLEDGMENTS
The authors acknowledge Mr. Salah Odeh of the Sharjah City
for Humanitarian Services (SCHS) and Mr. W. Zouabi and
F. Siam from the American University of Sharjah (AUS) for
their invaluable assistance in the facilitation of the ArSL data
collection. The authors would also like to thank (AUS) for a
research grant in support of this work (2006-2007).
REFERENCES
[1] K. Assaleh and M. Al-Rousan, “Recognition of Arabic sign lan-
guage alphabet using polynomial classifiers,” EURASIP Journal
on Applied Signal Processing, vol. 2005, no. 13, pp. 2136–2145,
2005.
[2] T. Shanableh, K. Assaleh, and M. Al-Rousan, “Spatio-temporal
feature-extraction techniques for isolated gesture recognition
in Arabic sign language,” IEEE Transactions on Systems, Man,
and Cybernetics, Part B, vol. 37, no. 3, pp. 641–650, 2007.
[3] F S. Chen, C M. Fu, and C L. Huang, “Hand gesture recog-
nition using a real-time tracking method and hidden Markov
models,” Image and Vision Computing, vol. 21, no. 8, pp. 745–
758, 2003.
[4] M H. Yang, N. Ahuja, and M. Tabb, “Extraction of 2D motion
trajectories and its application to hand gesture recognition,”
IEEE Transactions on Pattern Analysis and Machine Intelligence,
vol. 24, no. 8, pp. 1061–1074, 2002.
[5] T. Starner, J. Weaver, and A. Pentland, “Real-time American
sign language recognition using desk and wearable computer
based video,” IEEE Transactions on Pattern Analysis and Ma-
chine Intelligence, vol. 20, no. 12, pp. 1371–1375, 1998.
[6] Sharjah City for Humanitarian Services (SCHS), http://www
.sharjah-welcome.com/schs/about/.
[7] J. R. Jain and A. K. Jain, “Displacement measurement and its
application in interframe image coding,” IEEE Transactions on
Communications, vol. 29, no. 12, pp. 1799–1808, 1981.
[8] M. Ghanbari, “The cross-search algorithm for motion estima-
tion,” IEEE Transactions on Communications,vol.38,no.7,pp.
950–953, 1990.
10 EURASIP Journal on Image and Video Processing
[9]Y.L.Xi,C.H Y.Haoa,Y.Y.Fana,andH.Q.Hua,“Afast
block-matching algorithm based on adaptive search area and
its VLSI architecture for H.264/AVC,” Signal Processing: Image
Communication, vol. 21, no. 8, pp. 626–646, 2006.
[10] M. Ghanbari, Video Coding: An Introduction to Standard
Codecs, IEE Telecommunication Series 42, Institution Electri-
cal Engineers, London, UK, 1999.
[11] W H. Chen and W. Pratt, “Sense adaptive coder,” IEEE Trans-
actions on Communications, vol. 32, no. 3, pp. 225–232, 1984.
[12] T. Shanableh and M. Ghanbari, “Heterogeneous video
transcoding to lower spatio-temporal resolutions and different
encoding formats,” IEEE Transactions on Multimedia, vol. 2,
no. 2, pp. 101–110, 2000.
[13] R. Gonzalez and R. Woods, Digital Image Processing, Prentice
Hall, Upper Saddle River, NJ, USA, 2nd edition, 2002.
[14] K. Assaleh, T. Shanableh, and H. Hajjaj, “Online video-based
handwritten arabic alphabet recognition,” in The 3rd AUS In-
ternat ional Symposium on Mechatronics (AUS-ISM ’06),Shar-
jah, UAE, April 2006.
[15] L. R. Rabiner, “Tutorial on hidden Markov models and se-
lected applications in speech recognition,” Proceedings of the
IEEE, vol. 77, no. 2, pp. 257–286, 1989.