Báo cáo hóa học: " Research Article Color Targets: Fiducials to Help Visually Impaired People Find Their Way by Camera Phone" ppt
Bạn đang xem bản rút gọn của tài liệu. Xem và tải ngay bản đầy đủ của tài liệu tại đây (3.9 MB, 13 trang )
Hindawi Publishing Corporation
EURASIP Journal on Image and Video Processing
Volume 2007, Article ID 96357, 13 pages
doi:10.1155/2007/96357
Research Article
Color Targets: Fiducials to Help Visually Impaired
People Find Their Way by Camera Phone
James Coughlan
1
and Rober to Manduchi
2
1
Rehabilitation Engineering Research Center, Smith-Kettlewell Eye Research Institute, San Francisco, CA 94115, USA
2
University of California, Santa Cruz, CA 95064, USA
Received 16 January 2007; Revised 10 May 2007; Accepted 2 August 2007
Recommended by Thierry Pun
A major challenge faced by the blind and visually impaired population is that of wayfinding—the ability of a person to find his or
her way to a given destination. We propose a new wayfinding aid based on a camera cell phone, which is held by the user to find
and read aloud specially designed machine-readable signs, which we call color targets, in indoor environments (labeling locations
such as offices and restrooms). Our main technical innovation is that we have designed the color targets to be detected and located
in fractions of a second on the cell phone CPU, even at a distance of several meters. Once the sign has been quickly detected, nearby
information in the form of a barcode can be read, an operation that typically requires more computational time. An important
contribution of this paper is a principled method for optimizing the design of the color targets and the color target detection
algorithm based on training data, instead of relying on heuristic choices as in our previous work. We have implemented the system
on Nokia 7610 cell phone, and preliminary experiments with blind subjects demonstrate the feasibility of using the system as a
real-time wayfinding aid.
Copyright © 2007 J. Coughlan and R. Manduchi. This is an open access article distributed under the Creative Commons Attri-
bution License, which permits unrestricted use, distribution, and reproduction in any medium, provided the original work is
properly cited.
1. INTRODUCTION
There are nearly 1 million legally blind persons in the United
States, and up to 10 millions with significant visual impair-
ments. A major challenge faced by this population is that of
wayfinding—the ability of a person to find his or her way to
a given destination. Well-established orientation and mobil-
ity techniques using a cane or guide dog are effective for fol-
lowing paths and avoiding obstacles, but are less helpful for
finding specific locations or objects.
We propose a new assistive technology system to aid in
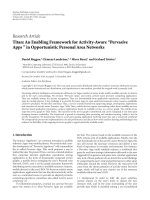
wayfinding based on a camera cell phone (see Figure 1),
which is held by the user to find and read aloud specially de-
signed signs in the environment. These signs consist of bar-
codes placed adjacent to special landmark symbols. The sym-
bols are designed to be easily detected and located by a com-
puter vision algorithm running on the cell phone; their func-
tion is to point to the barcode to make it easy to find w ithout
having to segment it from the entire image. Our proposed
system, which we have already prototyped, has the advan-
tage of using standard off-the-shelf cell phone technology—
which is inexpensive, portable, multipurpose, and becoming
nearly ubiquitous—and simple color signs which can be eas-
ily produced on a standard color printer. Another advantage
of the cell phone is that it is a mainstream consumer product
which raises none of the cosmetic concerns that might arise
with other assistive technology requiring custom hardware.
Our system is designed to operate efficiently with cur-
rent cell phone technology using machine-readable signs.
Our main technological innovation is the design of special
landmark symbols (i.e., fiducials), which we call color targets,
that can be robustly detected and located in fractions of a
second on the cell phone CPU, which is considerably slower
than a typical desktop CPU. The color targets allow the sys-
temtoquicklydetectandreadalinearbarcodeplacedad-
jacent to the symbol. It is important that these symbols be
detectable at distances up to several meters in cluttered en-
vironments, since a blind or visually impaired person can-
not easily find a barcode in order to get close enough to it to
be read. Once the system detects a color target, it guides the
user towards the sign by providing appropriate audio feed-
back.
This paper builds on our prev ious work [1], in which the
color target patterns and detection algorithm were designed
2 EURASIP Journal on Image and Video Processing
Figure 1: Camera cell phone held by blind user.
heuristically, by describing a principled method for optimiz-
ing the design parameters. This method uses training data
containing images of different colors rendered by different
printers and photographed under multiple lighting condi-
tions, as well as negative examples of typical real-world back-
ground images where color targets are not present, to deter-
mine which color target pattern is both maximally distinctive
and maximally invariant with respect to changing environ-
mental conditions (such as illumination). Once an optimal
pattern has been selected, an algorithm that detects the pat-
tern as reliably and quickly as possible can be easily deter-
mined.
We have implemented a real-time version of our wayfind-
ing system, which works with any camera cell phone running
the Symbian OS (such as the Nokia 7610, which we are cur-
rently using). The system is set up to guide the user towards
signs using audio beeps, and reads aloud the sign informa-
tion using prerecorded speech (which will eventually be re-
placed by text-to-speech). Sign information can either be en-
coded directly as ASCII text in the barcode, or can encode a
link to an information database (which is what our prototyp e
does on a small scale). The signs are affixed to the walls of a
corridorinanoffice building to label such locations as partic-
ular office numbers and restrooms. Preliminary experiments
with blind subjects demonstrate the feasibility of using the
system as a real-time wayfinding aid (see Section 4).
2. RELATED WORK
A number of approaches have been explored to help blind
travelers w ith orientation, navigation, and wayfinding, most
using modalities other than computer vision. The most
promising modalities include infrared signage that broad-
casts information received by a hand-held receiver [2], GPS-
based localization, RFID labeling, and indoor Wi-Fi-based
localization (based on signal strength) and database access
[3]. However, each of these approaches has significant lim-
itations that limit their attractiveness as stand-alone solu-
tions. Infrared signs require costly installation and mainte-
nance; GPS has poor resolution in urban settings and is un-
available indoors; RFIDs can only be read at close range and
would therefore be difficult to locate by blind travelers; and
Wi-Fi localization requires extensive deployment to ensure
complete coverage, as well as a time-consuming calibration
process.
Research has been undertaken on computer vision algo-
rithms to aid in wayfinding for such applications a s navi-
gation in traffic intersections [4] and sign reading [5]. The
obvious advantage of computer vision is that it is designed
to work with little or no infrastructure or modification to
the environment. However, none of this computer vision re-
search is yet practical for commercial use because of issues
such as insufficient reliability and prohibitive computational
complexity (which is especially problematic when using the
kind of portable hardware that these applications require).
Our approach, image-based labeling, is motivated by the
need for computer vision algorithms that can run quickly
and reliably on portable camera cell phones, requiring only
minor modifications to the environment (i.e., posting spe-
cial signs). Image-based labeling has been used extensively
for product tagging (barcodes) and for robotic positioning
and navigation (fiducials) [6–10]. It is important to recog-
nize that a tag reading system must support two complemen-
tary functionalities: detection and data embeddings. These
two functionalities pose different challenges to the designer.
Reliable detection requires unambiguous target appearance,
whereas data embedding calls for robust spatial data encod-
ing mechanisms. Distinctive visual features (shapes and tex-
tures or, as in this proposal, color combinations) can be used
to maximize the likelihood of successful detection. Compu-
tational speed is a c ritical issue for our application. We argue
that color targets have a clear advantage in this sense with
respect to black and white textured patterns.
Variations on the theme of barcodes have become popu-
lar for spatial information encoding. Besides the typical ap-
plications of merchandise or postal parcel tagging, these sys-
tems have been demonstrated in conjunction with camera
phones in a number of focused applications, such as linking a
product or a flyer to a URL. Commercial systems of this type
include the Semacode, QR code, Shotcode, and Nextcode. An
important limitation of these tags is that they need to be seen
from a close distance in order to decode their dense spatial
patterns. Our approach addresses both requirements men-
tioned above by combining a highly distinctive fiducial with
abarcode.
Direct text reading would be highly desirable, since it re-
quires no additional environment labeling. Standard OCR
(optical character recognition) techniques are effective for
reading text against a blank background and at a close dis-
tance [11], but they fail in the presence of clutter [12]. Re-
cently, developed algorithms address text localization in clut-
tered scenes [13–16], but they currently require more CPU
power than is available in an inexpensive portable unit, our
preliminary tests show cell phone processing speed to be 10–
20 times slower than that of a portable notebook computer
for integer calculations (and slower still if floating point
calculations are performed). Barcodes suffer from a simi-
lar limitation in that they must be localized, typically by a
J. Coughlan and R. Manduchi 3
hand-held scanner, before they can be read. We note that our
color target approach solves both the problems of quickly lo-
calizing barcodes or text and of designating the specific in-
formation that is useful for wayfinding.
We originally introduced the concept of a color target for
wayfinding, along with a fast barcode reader, in [1]. However,
in [1], the target was designed based on purely heuristic cri-
teria. In this paper, we provide a sound approach to the joint
design and testing of the color target and of the detection al-
gorithm.
3. COLOR TARGETS
We have designed the color targets to solve the problem of lo-
calizing information on signs. The targets are designed to be
distinctive and difficult to confuse with typical background
clutter, and are detectable by a robust algorithm that can run
very quickly on a cell phone (i.e., up to 2 or more frames/sec.
depending on resolution). Once the targets are detected, bar-
codes or text adjacent to them are easily localized [1]. A vari-
ety of work on the design and use of specially designed, eas-
ily localized landmarks has been undertaken [6, 7], but to the
best of our knowledge, this is the first cell phone-based appli-
cation of landmark symbols to the problem of environmental
labeling.
We use a cascade filter desig n (such as that used in [17])
to rapidly detect the color target in clutter. The first filter in
the cascade is designed to quickly rule out regions of the im-
age that do not contain the target, such as homogeneous re-
gions (e.g., blue sky or white wall without markings). Subse-
quent filters rule out more and more nontarget locations in
the image, so that only the locations containing a target pass
all the filter tests in the cascade (with very few false positives).
Rather than relying on generic edge-like patterns, which
are numerous in almost ever y image of a real scene, we se-
lect a smaller set of edges: those at the boundaries of par-
ticular color combinations, identified by certain color gr adi-
ents. Some form of color constancy is required if color is to
be a defining feature of the target under var ied illumination.
One solution would be to preprocess the entire image with a
generic color constancy algorithm, but such processing gen-
erally makes restrictive assumptions about illumination con-
ditions and/or requires significant computational resources.
Fortunately, while the appearance of individual colors varies
markedly depending on illumination, color gradients tend to
vary significantly less [18]. We exploit this fact to design a
cascade of filters that threshold certain color gradient com-
ponents. The gradients are estimated by computing differ-
ences in RGB channels among three or four pixels in a suit-
able configuration. The centroid of the three pixels, (x, y), is
swept across the entire pixel lattice.
3.1. Target color and test design
A critical task of this project is the selection of a small set of
color patches forming our target, along with the design of the
visual detect ion algorithm. The ideal color target should sat-
isfy two main requirements. It should be dist inctive, meaning
that it should be easily recognizable. At the same time, its ap-
pearance should be invariant with respect to changing envi-
ronmental conditions (illumination, viewing angle, distance,
camera noise). Distinctiveness and invariance are important
characteristics of feature detection algorithms for numerous
vision tasks (stereo [19], wide-baseline matching [20], object
recognition [21, 22], tracking [23]). Compared to typical vi-
sion applications, however, we have one degree of freedom
more, namely, the choice of the target that we w ant to recog-
nize. It is clear that target design should be undertaken j ointly
with algorithm optimization, with the goal of minimizing the
likelihood of missing the target (false negative) while main-
taining a low rate of false alar ms (targets mistakenly detected
where there is none).
As mentioned above, our targets display a pattern with
a small number of N contiguous color patches. In order to
detect the target, the image is scanned by a moving window,
which samples N-tuples of pixels (probes) in a suitable ar-
rangement.Thecolorpatchesareshapedasradialsectors,
placed so as to form a full circle (see, e.g., Figure 7). Accord-
ingly, the probes are arranged uniformly on a circumference
with suitable radius R (see Figure 7). Suppose that the slid-
ing window is placed at the center of the projection of the
target in the image. In ideal conditions (i.e., when there is
no motion blur, sampling effects can be neglected and the
camera is fronto-parallel with the target at the correct ori-
entation), this probing arrangement will sample exactly one
pixel per color patch, regardless of the distance to the target
(as long as the target projection has radius larger or equal to
R). This important feature motivated our choice for the tar-
get shape. We will discuss issues related to the optimal choice
of R in Section 3.3.Itsuffices here to observe that sampling
artifacts and motion blur are directly related to the distance
between probing pixels: the closer the probes, the more sig-
nificant these effects.
The number of color patches in the target should be cho-
sen c arefully. Too many patches make detection challeng-
ing, because in this case, the radial sectors containing the
color patches become narrow, and therefore the distance be-
tween probing pixels becomes small. On the contrary, de-
creasing the number of patches reduces the distinctiveness
of the pattern (other “background” patches may contain the
same color configuration). The notion of distinctiveness is
clearly related to the false positive rate (FPR), which can be
estimated over a representative set of images that do not con-
tain any targets.
Another important design decision is the choice of
the detection algorithm. Due to the limited computational
power of a cell phone, and the real-time requirement of the
system, it is imperative that the algorithm involves as few
operations per pixel as possible. For a given algorithm, we
can design the target so as to optimize its detection perfor-
mance. Hence, even a simple algorithm has the potential to
work well with the associated optimal target. In comparison,
in typical real-world vision applications, the features to be
observed may be, and often are, highly ambiguous, requir-
ing more complex detection strategies. Our algorithm per-
forms a cascade of one-dimensional “queries” over individ-
ual color channels of pairs of color patches. More specifi-
cally, let c
m
= (c
1
m
, c
2
m
, c
3
m
) represent the RGB color vector
4 EURASIP Journal on Image and Video Processing
(a)
Fluorescent light-type 1
(b)
(c)
(d)
Fluorescent light-type 2
(e)
(f)
(g)
Direct sunlight
(h)
(i)
(j)
Incandescent light
(k)
(l)
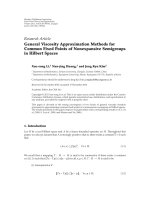
Figure 2: The figure shows a sample of the 24 images taken with the 5 possible color patches under different lighting conditions. Each row
contains images of the patches generated by three different printers under the same illumination condition. Empirical statistics from this
dataset are used to determine optimal query thresholds.
as measured by the probing pixel for the mth patch. Then,
a query involving the mth and nth color patches over the kth
color channels (k
= 1, 2, 3 designates the red, green, and blue
color channels, resp.) can b e expressed as follows:
c
k
m
− c
k
n
≥
T
k
m,n
,(1)
where T
k
m,n
is a suitable threshold. The quadruplet Q =
(m, n, k, T
k
m,n
) fully characterizes the query. The detection
algorithm is thus defined by the sequence of J queries
(Q
1
, Q
2
, , Q
J
). Only if a pixel satisfies the whole cascade of
queries, it is considered to be a candidate target location. The
advantage of using a cascade structure is that if the first few
queries are ver y selec tive, then only a few pixels need to be
tested in the subsequent queries.
For fixed values N of color patches and J of queries,
the joint target-algorithm design becomes one of finding
patch colors and quer ies that give low values of FPR as well
as of FNR (false negative rate, or missed target detection).
We decided to tackle the problem via exhaustive testing on
carefully chosen image sets. In order to make the problem
tractable, we confined the choice of color patches to a set con-
taining the following colors:
{red, green, blue, black, white}.
More precisely, when creating an 8 bit image to be printed
out, we select colors from the following RGB representations:
{(255, 0, 0), (0, 255, 0), (0, 0, 255), (255, 255, 255), ( 0, 0, 0)}.
White and black are obvious choices due to their different
brightness characteristics and to the fact that they can be eas-
ily reproduced by a printer. As for the other three colors, the
following argument suggested their choice. First, note that an
ideal surface with monochromatic reflectance spectrum has
optimal color constancy characteristics: a change in the illu-
minant spectrum only determines a change in the intensity of
the reflected light (and therefore of the measured color). Sec-
ondly, if the camera’s spectral sensitivities are unimodal, with
peaks centered at wavelengths matching the monochromatic
light reflected by the color patches, then for each color patch
the camera generates a response in only one color channel
(the remaining two channels being negligible) [24]. In other
words, the use of red, green, and blue is motivated by the fact
that we are using an RGB camera.
Unfortunately, the colors produced by a typical printer
are far from monochromatic. Furthermore, different print-
ers produce di fferent results for the same input image. The
color values read by the camera also depend on the illumi-
nant spectrum, on the white balancing operation in the cam-
era, on the nonlinear transfer function (gamma), and on any
brightness adjustment via exposure and gain control. Note
that we do not have control over exposure, gain, and white
balancing for our camera phone. Finally, specularities may be
present as well, but we will neglect them in this work (as they
did not seem to be a major problem in our experiments).
Rather than attempting to compensate for the different
lighting and exposure conditions via a color constancy algo-
rithm, which may require additional modeling and compu-
tation, we decided to use a set of exemplars and to choose tar-
get colors and queries that prove robust against varying illu-
mination and background. In addition, we considered three
different printer models for our target.
Twenty four images of the five possible color patches,
printed on a sheet of paper by three differ ent printers, were
taken by our camera phone under very different lighting con-
ditions, b oth indoor and outdoor. A sample of these images
is shown in Figure 2. We will use empirical statistics about
this image dataset to determine “optimal” query thresholds,
described later in this section.
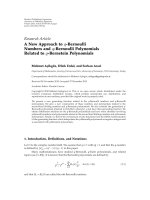
In order to evaluate the false positive ratio, we also con-
sidered the seven “background” images (not containing a tar-
get) shown in Figure 3. This image set represents a sample of
J. Coughlan and R. Manduchi 5
(a) (b) (c)
(d) (e) (f)
(g)
Figure 3: The “background” images used to evaluate the false positive rate.
different representative situations, including cluttered indoor
and outdoor scenes. Ideally, these images would provide ad-
equate information about the statistical characteristics of the
background. We reckon that seven images may not represent
an adequate sample for representing the environment. Nev-
ertheless, we use this data set as a simple working reference
on which to assess our system’s performance, aware that the
results may change using a different data set. In a practical
implementation of our wayfinding system, it may be possi-
ble to collect images of the environment (e.g., the corridors
in an office building) where targets are placed.
Given the set C
={C
1
, C
2
, , C
N
} of color patches form-
ing the target and a query Q
i
= (m, n, k, T
k
m,n
), we estimate
the associated FNR by running the algorithm on the set of
target images. For each image, we pick a pixel from color
patch m and one from color patch n, and check whether they
verify (1). We repeat this test for all pixel pairs from the two
patches for the same image, counting the number of pixels
that do not pass the test. We then compute the sum of these
numbers for all images and divide the result by the overall
number of pixel pairs, obtaining the FNR associated with
Q
i
. We can compute the FNR associated to a query sequence
Q
= (Q
1
, Q
2
, , Q
J
) in a similar fashion. Likewise, we can
compute the associated FPR by running the detection algo-
rithm on the background images and counting the number
of pixels mistakenly classified as target. Note that the value of
the threshold T
k
m,n
determines the values of FNR and FPR for
the query Q
i
.
There are several p ossible criteria to specify an “optimal”
threshold for query Q
i
.Weuseaverysimpleapproach:select
the largest value of T
k
m,n
such that the associated FNR is equal
to 0. In other words, we choose the most stringent threshold
that ensures that a ll pixel pairs from color patches m and n
pass test (1). This is achieved by setting T
k
m,n
to the minimum
value of the color difference (c
k
m
− c
k
n
) over the dataset of the
known color patches (see Figure 2). (The minimum is chosen
with respect to all pairs of pixels f alling within color patches
m and n, over all printers and illumination conditions.) As
we will see shortly, this criterion provides us with a straight-
forward optimization technique. A potential disadvantage of
the unbalanced weight placed on the FNR and FPR is that the
resulting FPR may be too high for prac tical use. Our experi-
ments show that this does not seem to be the case. It should
also be pointed out that there are subsequent layers of pro-
cessing to validate whether a candidate pixel belongs to a tar-
get image or not. Hence, it is critical that in this first phase,
no target pixel is missed by the algorithm.
A convenient feature of our optimization algorithm is
that, by forcing FNR
= 0, we can separate the computation
of thresholds T
k
m,n
from the choice of color patches and of the
query sequence. Indeed, for each pair (m, n) of color patches,
T
k
m,n
is chosen based only on the color patch training images.
6 EURASIP Journal on Image and Video Processing
Table 1: The best colors for targets with N = 3 or 4 patches and the lower bounds for the false positive rate (FPR
LB
) using thresholds derived
from images from each individual printer and from images from all printers.
N = 3 patches N = 4 patches
Colors FPR
LB
Colors FPR
LB
Printer 1 (White, red, black) 9.2 · 10
−6
(White, red, green, blue) 0
Printer 2
(White, red, green) 5.6 · 10
−5
(White, red, green, blue) 0
Printer 3
(White, red, green) 5.8 · 10
−4
(White, red, green, black) 7.5 · 10
−6
All printers (White, red, black) 1.6 · 10
−3
(White, red, blue, black) 5.6 · 10
−5
Once the set of thresholds has been computed, we can pro-
ceed to estimate the set of colors C and the set of queries
Q. We are considering only targets with a number of colors
equal to N
= 3orN = 4 in this work. Since there are 5 colors
to choose from, the number of possible targets
1
is
5
N
.Given
a target and the length J of the query sequence, and noting
that the order of the queries does not affect the final result, it
is easy to see that the number of possible different query se-
quences is equal to
3N(N−1)
J
, since there are 3 color channels
and N(N
−1) possible ordered pairs of distinct color patches.
For example, for a given 3-color target, there are 3.060 differ-
ent quadruplets of queries. Although the problem of optimal
query sequence selection is NP-hard, it is possible to solve it
exhaustively in reasonable time for small values of sequence
lengths J. We have considered a maximum value of J
= 5in
this work for the 3-color target, and J
= 4 for the 4-color
target (since the number of possible queries is much greater
in this case). This choice is justified by the experimental ob-
servation that the decline in FPR resulting in an increase of
J from4to5(orfrom3to4inthe4-colortargetcase)is
normally modest, hence larger values of J may not improve
performances significantly (details are given later in this sec-
tion). Thus, for a given color set C, we proceed to test all
possible J-plets of queries, and select the one with the lowest
associated FPR.
In order to reduce the computational cost of optimiza-
tion, we select the set of colors C before query optimization,
based on the following suboptimal strategy. For each combi-
nation of N colors, we consider the FPR associated with the
sequence comprising al l possible 3N(N
− 1) queries. This se-
quence being unique (modulo an irrelevant permutation),
the associated FPR is computed straightforwardly. The re-
sulting value (FPR
LB
) has the property that it represents an
achievable lower bound for the FPR of any query sequence
using those colors. We then select the combination of colors
with associated smallest values of FPR
LB
. By comparing this
value with a predetermined threshold, one can immediately
check whether the number N of colors is large enough, or if
alargerN should be used.
Tab le 1 shows the best colors and the lower bounds
FPR
LB
using thresholds derived from images from each in-
dividual printer, as well as using thresholds derived from the
whole collection of images over all printers. The latter case
1
Note that we are neglecting the order of color patches in the target, al-
though it may be argued that the order may play a role in the actual FPR.
can b e seen as an attempt to find an algorithm that is robust
against the variability induced by the printer type. It is inter-
esting to note how different printers give rise to different val-
ues of FPR
LB
. In particular, Printer 1 seems to create the most
distinctive patterns, while Printer 3 creates the most ambigu-
ous ones. As expected, the algorithm that gives zero false neg-
atives (no misses) from targets created from all printers is
also the algorithm that creates the highest rate of false pos-
itives. As for the color choice, the w hite and red patches are
always selec ted by our optimization procedure, while the re-
maining color(s) depends on the printer type. Note also that
the 3-color target has higher FPR
LB
than the 4-color target
for all cases.
As an example of optimal query sequence, we computed
the optimal quadruplet of queries associated with the opti-
mal 3-color set for Printer 1 (white, red, black). The queries
are (note that the color channels are labeled 1,2,3 to represent
red, green, and blue) Q
1
= (1,2,2,89); Q
2
= (2,3,1,69);
Q
3
= (3,2,2,−44); Q
4
= (2,1,1,−69). In simple words, a
triplet of probes passes this query sequence if the first patch
is quite greener but not much redder than the second patch,
and if the second patch is quite redder but not much greener
than the third patch. The queries are ordered according to
increasing FPR, in order to ensure that most of the pixels
are ruled out after the first queries. The average number of
queries per pixel before a pixel is discarded (i.e., rejected as a
target pixel) is 1.037. The FPR associated with this query se-
quence is equal to 1.4
· 10
−3
. By comparison, note that if five
queries are used, the FPR decreases only by a small amount
to 1.2
· 10
−3
.
Here is another example, involving a quadruplet of
queries associated with the optimal 4-color set with thresh-
olds computed over the whole set of printers. In this case,
the optimal colors are (white, red, blue, black), and the query
sequence is Q
1
= (1,2,2,58); Q
2
= (2,4,1,33); Q
3
=
(2,3,1,22);Q
4
= (2,1,1,−90). This query sequence ensures
that the first patch is significantly greener but not much red-
der than the second patch, and that the second patch is sig-
nificantly redder than both the third and the fourth patches.
This query sequence has FPR
= 2.2 · 10
−4
.(TheFPRisonly
slightly higher, 3.1
·10
−4
, when three queries are used instead
of four.) On average, the algorithm computes 1.08 queries
per pixel before recognizing that a pixel is not a target. De-
tection results examples using these two query sequences are
shown in Figures 4 and 5.
Additional postprocessing is needed to rule out the few
false positives that survive the query cascade. A simple and
J. Coughlan and R. Manduchi 7
(a) (b)
(c) (d)
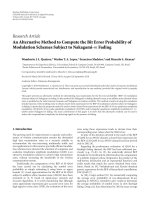
Figure 4: Some detection results using the sequences with 4 queries described in this section, with 3-color targets. Pixels marked in red were
detected by the color-based algorithm but discarded by the subsequent clustering validation test. Pixel marked in blue survived both tests.
(a) (b)
(c) (d)
Figure 5: Some detection results using the sequences with 4 quer ies described in this section, with 4-color targets. See caption of Figure 4.
fast clustering algorithm has given excellent results. Basically,
for each pixel that passed the query sequence, we compute
how many other passing pixels are in a 5
× 5 window around
it. If there are less than 13 other passing pixels in the window,
this pixel is removed from the list of candidates. Finally, re-
maining candidate pixels are inspected for the presence of a
nearby barcode, as discussed in [1].
We implemented this simple prototype algorithm in C++
on a Nokia 7610 cell phone running the Symbian 7.0 OS. The
camera in the phone has a maximum resolution of 1152 by
8 EURASIP Journal on Image and Video Processing
(a) (b)
(c) (d)
Figure 6: Left, sample scene photographed by different cameras (7610 on top, 6681 on bottom). Right, false positives of zoomed-in region
of image shown in red. This example illustrates the similarity of the pattern of false positives between cameras.
864 pixels, although we normally operate it at VGA resolu-
tion. The algorithm detects multiple targets in a fraction of
a second to about half a second (depending on camera reso-
lution). The detection is invariant to a range of scales (from
about 0.5 m to as far as 10 m), and accommodates significant
rotations (up to about 30 degrees in the camera plane), slant
and background clutter.
Note that the color targets need to be well illuminated to
be detected, or else image noise will obscure the target col-
ors. One way to overcome this limitation might be to op-
erate a flash with the camera, but this approach would use
significant amounts of battery power, would fail at medium
to long range, and would be annoying to other people in
the environment. Another possibility might be to increase
the exposure time of the camera, but this would make the
images more susceptible to motion blur; similarly, increas-
ing the camera gain would increase pixel noise as well as
the brightness. (Note that the exposure time and gain are
set automatically and cannot be specified manually.) In addi-
tion, white balancing is set automatically and the background
of the color target may affect the color target’s appearance
in an unpredictable way. Overall, it seems most practical to
site the targets at locations that are already well lit; accord-
ingly, we have emphasized the application of our system to
indoor environments such as office buildings, which are usu-
ally well lit throughout common areas such as corridors and
lobbies.
3.2. Comparisons between different cameras
The color target patterns and color target detection algo-
rithms were designed and tested for a variety of illumina-
tion conditions and printers. However, all the preceding ex-
periments were conducted using a single camera cell phone
model, the Nokia 7610, and it is important to determine
whether the results of the experiments generalize to differ -
ent camera models. In general, we might expect that differ-
ent cameras will have different imaging characteristics (such
as color matching functions), which could necessitate the use
of different color difference thresholds. It is impractical to
test every possible combination of illumination condition,
printer, and camera model, especially given the enormous
(and constantly growing) selection of camera models, so in
this section, we describe some simple experiments demon-
strating that our color target detection algorithm works sim-
ilarly for three different Nokia models: the 7610, 6681, and
N80.
In these experiments, we examined the FPR obtained
by the same color target detection algorithm applied to im-
ages of background scenes not containing color target pat-
terns, photographed by the three different cameras (see, e.g.,
Figure 6). Four scenes were used, each under a different il-
lumination condition: an indoor scene illuminated only by
outdoor daylight (indirect sunlight through a window), nor-
mal indoor (fluorescent) illumination, dark indoor (also
J. Coughlan and R. Manduchi 9
Table 2: Comparing FPRs for images of scenes taken by different
cameras (Nokia 6681, 7610, and N80). For each scene, note that
the FPR usually varies by no more than about a factor of two from
camera to camera.
6681 7610 N80
Scene 1 1.02 · 10
−4
5.99 · 10
−5
9.88 · 10
−5
Scene 2 1.63 · 10
−4
2.03 · 10
−4
4.37 · 10
−4
Scene 3 2.78 · 10
−3
2.78 · 10
−3
1.57 · 10
−3
Scene 4 2.58 · 10
−3
1.90 · 10
−3
2.69 · 10
−3
fluorescent) illumination, and an outdoor scene (also indi-
rect sunlight). It is difficult to make direct comparisons be-
tween images of the same scene photographed by different
cameras; not only is it hard to ensure that the photographs
of each scene are taken with the camera in the exact same
location and at the exact same orientation, but the cameras
have different resolutions and slightly different fields of view.
To address this problem, we performed a simple procedure
to “normalize” the images from the different cameras. In this
procedure, we chose scenes of planar surfaces that commonly
appear on walls, such as posters and printouts (in our expe-
rience, these are a common source of false positives in in-
door environments), and held each camera from approxi-
mately the same distance to the scenes. We resampled the im-
ages from each camera to the same resolution (1152
× 864,
the resolution of Nokia 7610). Finally, we placed a featureless
rectangular frame against these surfaces to define a region of
interest to analyze; after resampling the image to the stan-
dard resolution, the image was manually cropped to include
everything inside the frame but nothing outside it.
The FPRs, shown numerically in Table 2 and illustrated
in Figure 6, were estimated by running the four-color tar-
get detector described in the previous section (using the four
queries and thresholds obtained for the 7610 camera) across
each normalized image. (Results were similar for the three-
color target, which we do not include here.) For each scene,
note that the FPR usually varies by no more than about a
factor of two from camera to camera, despite differences of
over two orders of magnitude in the FPR from one scene to
the next. These results demonstrate that a color target detec-
tor trained on one camera should have similar performance
on other cameras. However, in the future, the color target
detector can be tailored to each individual camera model or
manufacturer if necessary.
3.3. Theoretical and empirical bounds
3.3.1. Maximum detection distance (stationary)
The width of the color target, together with the resolution
and the field of view (FOV) of the camera, determine the
maximum distance at which the target can be detected. For
simplicity’s sake, we will only consider 3-color targets in the
following. For the Nokia 7610 cell phone, the instantaneous
horizontal FOV (IFOV) of a single pixel is approximately
1.5 mrads for the 640
×480 resolution, and 0.82 mrads for the
1152
×864 resolution. The pixels can be considered square to
x
xx
Figure 7: The layout of a 3-patch color target, with the location of
the “probing” pixels. The lower two pixels are separated by a buffer
of M
= 7 pixels.
a good approximation. In order to detect a target at a distance
d, it is necessary that all three color patches be correctly re-
solved. The color at a pixel location, however, is computed by
interpolation from the underlying Bayer mosaic, which typ-
ically involves looking at color values within a 3
× 3 window
centered at the pixel. (We note that our algor ithm processes
uncompressed image data, without any JPEG artifacts that
could complicate this analysis.) This means that, in order to
correctly measure the color of a patch, the patch must project
onto a square of at least 3
× 3 pixels, so that at least one pixel
represents the actual patch color. In fact, we found out that as
long as at least half of the pixels within the 3
× 3 window re-
ceive light from the same color patch, detection is performed
correctly.
Now, suppose that two measurement pixels are separated
by a buffer zone of M pixels as in Figure 7. In our imple-
mentation, we chose M
= 7. The importance of these buffer
pixels in the context of motion blur will be discussed in
Section 3.3.2.ItisclearfromFigure 7 that the diameter D
of the color t arget should project onto at least M + 4 pix-
els for color separation. This is obviously an optimistic sce-
nario, with no blurring or other forms of color bleeding and
no radial distortion. In formulas, and remembering that the
tangent of a small angle is approximately equal to the angle
itself:
d
≤
D
IFOV · (M +4)
. (2)
We have considered two target diameters in our experi-
ments, D = 6cm and D = 12 cm. Table 3 shows the theo-
retical bounds, computed using (2), as well as empirical val-
ues, obtained via experiments with a color target under two
different incident light intensities (175 lux and 10 lux, resp.).
A lower detection distance may be expected with low light
due to increased image noise. The maximum distances re-
ported in the table include the case when no postprocessing is
performed (such as the clustering algorithm of Section 3.1).
This provides a fairer comparison with the model of Figure 7,
which only requires one-point triplet detection. Of course,
postprocessing (which is necessary to reject false positives)
reduces the maximum detection distance, since it requires
10 EURASIP Journal on Image and Video Processing
Table 3: Maximum distances (in meters) for color target detection. Theoretical bounds are reported together with experimental values with
and without the postprocessing (PP) module. Values in the case of poor illumination are shown within parentheses.
D = 6cm D = 12 cm
Theor. Exp No PP. Exp PP. Theor. Exp No PP. Exp PP.
640 × 480 3.6 3.5(3) 2.7(2.4) 7.2 6.7(5.7) 5.6(4.7)
1152
× 864 6.6 5.5(4.5) 4.3(3) 13.2 11.1(8.5) 9.3(6.4)
that a certain number of triplets is found. The experiments
were conducted while holding the cell phone still in the user’s
hand. Note that the experimental values, at least for the case
of well-lit target and without postprocessing, do not differ
too much from the theoretical bounds, which were obtained
using a rather simplistic model.
3.3.2. Maximum detection distance (panning)
Searching for a color target is typically performed by piv-
oting the cell phone around a vertical axis (panning) while
in low-resolution (640
× 480) mode. Due to motion, blur
can and will arise, especially when the exposure time is large
(low-light conditions). Motion blur affects the maximum
distance at which the target can be detected. A simple theo-
retical model is presented below, providing some theoretical
bounds.
Motion blur occurs because, during exposure time, a
pixel receives light from a larger surface patch than when the
camera is stationary. We will assume for simplicity’s sake that
motion is rotational around an axis through the focal point
of the camera (this approximates the effectofauserpivoting
the cell phone around his or her wrist). If ω is the angular ve-
locity and T is the exposure time, a pixel effectively receives
light from a horizontal angle equal to IFOV + ωT.Thisaf-
fects color separation in two ways. Firstly, consider the ver-
tical separation between the two lower patches in the color
target. For the two lower probing pixels in Figure 7 to re-
ceive light from different color patches, it is necessary that
the apparent image motion be less than
2
M/2−1 (this
formula takes the Bayer color pattern interpolation into ac-
count). The apparent motion (in pixels) due to panning is
equal to ωT/IFOV, and therefore the largest acceptable an-
gular velocity is (
M/2−1) · IFOV/T.Forexample,for
M
= 7andT = 1/125 s, this corresponds to 21.5
◦
/s. The sec-
ond way in which motion blur can affect the measured color
is by edge effects. This can be avoided by adding a “buffer
zone” of
ωT/IFOV pixels to the probing pixels of Figure 7.
This means that the diameter of the target should project
onto M +2
· (2 + ωT/IFOV) pixels. Hence, the maximum
distance for detection decreases with respect to the case of
Section 3.3.1.
In fact, these theoretical bounds are somewhat pes-
simistic, since a certain amount of motion blur does not nec-
essarily mean that the target cannot be recognized. In order
2
The symbol · represents the largest integer smaller than or equal to the
argument.
Table 4: Rates (in frames per minute) attained for di fferent im-
age resolutions with and without target detection module (proc./no
proc.) and with and without display in the viewfinder (disp./no
displ.).
No proc./displ. Proc./displ. Proc./no displ.
640 × 480 114 110 154
1152
× 864 21 19 20
to get some more realistic figures, we ran a number of exper-
iments, by pivoting the cell phone at different angular veloc-
ities in front of a 12 cm target from a distance of 2 meters.
Since we could neither control nor measure exposure time,
comparison with the theoretical bounds is difficult. When
the color target was lit with average light intensity (88 lux),
detection was obtained with probability larger than 0.5 at an-
gular speeds of up to 60
◦
/s. With lower incident light (10 lux),
this value was reduced to 30
◦
/s, presumably due to larger ex-
posure time.
3.3.3. Detection rates
The rate at which target detection is performed depends on
two factors: the image acquisition rate, and the processing
time to implement the detection algorithm. Tabl e 4 shows
the rates attained with and without processing and display
(in the viewfinder). Image display is obviously not necessary
when the system is used by a blind person, but in our case it
was useful for debugging purposes. Note that image display
takes 44% of the time in the VGA detection loop. If the im-
ages are not displayed, the frame rate in the VGA resolution
mode is more than 2.5 frames per second. However, for the
high-resolution case, image acquisition represents a serious
bottleneck. In this case, even without any processing, the ac-
quisition/display rate is about 2 1 frames per minute. When
processing is implemented (without display), the rate is 20
frames per minute.
Given the extremely low acquisition rate for high-
resolution images provided by this cell phone, we use the fol-
lowing duty cycle strategy. The scene is searched using VGA
resolution. When a target is detected over a certain number
F (e.g., F
= 5) of consecutive frames, a high-resolution snap-
shot is taken. Barcode analysis is then implemented over the
high-resolution data [1]. The number F of frames should be
large enough to allow the user to stop the panning motion,
thereby stabilizing the image and reducing the risk of motion
blur when reading the barcode.
J. Coughlan and R. Manduchi 11
4. EXPERIMENTS WITH BLIND SUBJECTS
We have conducted four proof-of-concept experiments to
demonstrate the feasibility of a blind person using a cell
phone to obtain l ocation information using a color target.
These experiments were performed by three blind volunteers
who were informed of the purpose of the experiments. To
guide the subjects towards color targets using the system, we
devised a simple three-pitch audio feedback strategy: low,
medium, or high tones signified the target appearing in the
left, center, or right part of the camera’s field of view, respec-
tively, and silence signified that no target was visible to the
system. We used 640
× 480 camer a resolution in the experi-
ments, which allowed the system to process a few frames per
second, and a 4-color target.
For the first three experiments, the subjects were in-
formed that the goal of the experiments was to measure their
ability to use the color target (and/or associated barcode) to
perform simple wayfinding tasks. They were given a brief
(approximately, 10-minute) training session in which the ex-
perimenter explained the operation of the color target system
and had them try it out for themselves (initially with assis-
tance, and then unassisted). During this session, the exper-
imenter advised the subjects that they needed to move the
cell phone slowly and smoothly to avoid motion blur, and
that they had to hold the cell phone upright and horizontal,
taking care not to cover the camera lens with their fingers.
In the first experiment, a blind subject was seated near
the wall of a small conference room (approximately, 7 meters
by 5 meters), and a color target was placed on another wall in
one of four possible locations relative to the subject: left, far
left, right, or far right. For each trial, the color target location
was chosen at random by the experimenter. The subject was
asked to use the cell phone target detector to identify which
location the target was in. After a practice session, he iden-
tified the location for ten consecutive trials without making
any mistakes.
A second experiment featuring a more challenging task
was conducted with another blind subject, testing his ability
to locate, walk to, and touch a color target in an unknown lo-
cation. For each trial, the experimenter placed a color target
at a random location (at shoulder height) on the walls of the
same conference room (which was free of obstacles). Begin-
ning in the center of the room, the second blind subject used
the color target detector to find the color target, walk towards
it, and touch it. In 20 trials, it took him anywhere from 13
to 33 seconds to touch the target. In 19 of the 20 trials, he
touched only the target, while in one trial, he first touched
the wall several inches away before reaching the target.
The third experiment was designed to test the ability of a
blind subject to find locations of interest in an office corridor
using the color target system augmented with barcodes. The
goal was to find four locations along the walls of a straight
corridor (about 30 meters long) using the cell phone system;
he was advised that the labels did not correspond to the ac-
tual building layout, so that his familiarity with the building
would not affect the outcome of the experiment. A color tar-
get with 5-bit barcode was affixed at waist height near each
of the four locations in the corr idor. The barcodes encoded
Table 5: Results of a color target experiment with blind subjects.
The task was to locate Braille signs in the environment (either a
corridor or conference room) using the color target detector, and to
then read them aloud. Each cell shows the time (in seconds) it took
the subject to perfor m the task in two separate trials.
Subject 1 Subject 2
Corridor 164, 145 281, 84
Conference room
61, 65 68, 67
four separate numbers which were associated with four pre-
recorded sounds (“elevator,” “restroom,” “room 417,” and
“staircase”). The subject was instructed to walk along the cor-
ridor to scan for all four labels. When the camera was close
enough to the color target, the barcode next to it was read
and the appropriate recording was played back. After a train-
ing session, the labels were moved to new locations and the
subject was able to find all four of them in about two m inutes.
No false positives or false barcode readings were encountered
during the experiment.
Finally, a fourth experiment was recently conducted (see
[25] for details) to measure the performance of the color tar-
get system as a tool for finding Braille signs, and in addi-
tion to investigate the strategies that worked best for blind
subjects using this system to explore their environment. The
subjects were informed of these experimental go als and given
a brief (approximately 10 minute) t raining session as in the
previous experiments. The task in this experiment was to lo-
cate and read aloud Braille signs bearing a single letter cho-
sen at random (A through J) located either in the corridor
or the conference room (the same locations as in the pre-
vious experiments). (For comparison, we repeated the same
experiment without the use of the cell phone system, so that
the subjects relied exclusively on their sense of touch; details
on that experiment are not relevant to this paper and are re-
ported in [25].) The experiment was performed by two blind
subjects, each of whom read Braille. Randomization of the
placement and content of the Braille signs minimized the ef-
fects of familiarity with the layout of the environment.
For each trial in the experiment, two different Braille
signs were placed randomly at shoulder height in two differ-
ent places. In the corridor trials, the Braille sig ns were placed
at seven possible locations (which were described to the sub-
jects in the training session), covering existing Braille signs
(designating rooms and office numbers) running the length
of the corridor. For the conference room trials, two different
Braille letter signs were placed randomly at shoulder height,
with the two signs on different walls (also randomly chosen).
We recorded the total time for the subject to find and read
aloud b oth Braille letter signs in each trial; the results are
shown in Ta ble 5. An important finding of the experiment
is that both subjects adopted similar search strategies for
searching with the cell phone system: walking slowly down
the corridor with the cell phone camera pointed at one wall
(and pointing the camera at the other wall on the way back),
and panning the camera in a circle in the middle of the con-
ference room to find the directions to the color targets before
advancing towards them.
12 EURASIP Journal on Image and Video Processing
This finding provides valuable insight into how blind
subjects actually use the cell phone system, and suggests the
most important areas for improvement. To operate the cell
phone system, the subjects had to walk slowly and/or pan the
camera slowly to avoid motion blur. Walking was an appro-
priate strategy for exploring walls at close range, as in cor-
ridors (in which the subject was never far from the walls);
the walking speed had to be fairly slow, since the apparent
motion of the walls would otherwise cause excessive motion
blur, which would be exaggerated at close range. Conversely,
panning allowed subjects to explore wide expanses of walls at
greater distances, as from the vantage point in the center of a
room.
Another finding is that, while the subjects were instructed
to hold the camera as level as possible, the inability to main-
tain a level orientation (which is difficult for a blind or vi-
sually impaired person to estimate) was the most common
cause of problems: if the camera was sufficiently off the hor-
izontal, the subject could walk by a color target without de-
tecting it. (This scenario explains an outlier in our data in
Tab le 5 , the inordinately long time that it took Subject 2 to
complete the first cell phone trial, 281 seconds.)
While these four experiments are preliminary, they show
that blind subjec ts are able to use a simple cell phone inter-
face to locate signs at a range of distances and orientations
and that they are capable of orienting the camera properly
and moving it smoothly and slowly enough to prevent inter-
ference from motion blur. These results provide direct evi-
dence of the feasibility of our proposed system.
However, the experimental results also underscore the
need to address the problems of motion blur and limited ro-
tation invariance in the future. Barring future improvements
in cell phone camera technology (i.e., faster exposure times),
we could make the system less sensitive to motion blur—and
thereby allow the user to walk or pan more quickly—by using
larger color targets. This would permit a larger separation be-
tween the probe pixels, which would allow greater amounts
of motion blur without sacrificing long-distance detection.
A more aesthetically acceptable alternative may be to use the
same size targets as before but to adopt a multiscale detection
approach: a greater probe pixel separation could be used in a
first stage of detection for each image, and if nothing is de-
tected in the image, a second stage could be executed with a
narrower separation (to detect targets at a greater distance).
One way to improve the system’s range of rotation in-
variance is to use a target w ith three colors rather than four,
since under ideal conditions, the former is invariant to ori-
entation deviations of
±60
◦
, while the range for the latter is
±45
◦
. However, we have found that using three colors creates
more false positives than using four colors. Another possibil-
ity is to use the usual four-color target but to expand the color
target search by including multiple orientations of the probe
pixels (e.g., over the three orientations 0
◦
,+20
◦
,and−20
◦
). It
is unclear whether this approach can be implemented with-
out slowing down the detection process too much.
In the future, we will conduct experiments to test the
performance of our system under more complicated—but
typical—real-world conditions, including unfamiliar build-
ings and locations, in corridors and rooms of different shapes
and sizes, with signs placed at varying heights. These experi-
ments will help us to improve the user interface, which may
combine the use of vibratory signals, audio tones, and syn-
thesized speech.
5. CONCLUSION
We have demonstrated a camera cell phone-based wayfi nd-
ing system that allows a visually impaired user to find signs
marked with color targets and barcodes. A key challenge of
the system is the limited computational power of the cell
phone, which is about 10–20 times slower than a typical
notebook computer. O ur solution is to place a distinctive
color target pattern on the sign, which may be rapidly de-
tected (using integer arithmetic) even in cluttered scenes.
This swiftly guides the system to an adjacent barcode, which
we read using a novel algorithm that is robust to poor res-
olution and lighting. An important contribution of this pa-
per is a principled method for optimizing the design of the
color targets and the color target detection algorithm based
on training data, instead of relying on heuristic choices as in
our previous work. Preliminary exper iments with blind sub-
jects confirm the feasibility of the system.
A priority for future work is to minimize susceptibility
to motion blur and to improve the rotation invariance of the
color target detection, for which we have described possible
solutions. In addition, we will test the system with more blind
subjects (and will need to include low-vision subjects) un-
der more complicated—but typical—real-world conditions
to help us to improve the user interface, which may com-
bine the use of vibratory signals, audio tones, and synthesized
speech.
Even with these future improvements, some drawbacks
of our wayfinding system will remain. For instance, color
targets (and associated barcodes) can only be detected when
they are in the direct line of sight of the camera, and obvi-
ously cannot be detected in the dark; even w hen minimized,
motion blur prevents rapid panning by the cell phone user,
and hence limits the speed with which he or she can ex-
plore the environment; and oblique viewing angles (which
are commonly encountered in corridors) and limitations on
the size of the color target signs (imposed by space con-
straints and cosmetic considerations) restrict the detection
range of the system. However, despite these drawbacks, we
stress that our proposed system provides wayfinding infor-
mation that is otherwise completely inaccessible to blind and
visually impaired persons in a portable, low-cost package
based solely on off-the-shelf hardware. Moreover, in the fu-
ture we envisage integrating our computer vision-based color
target system with alternative modalities such as GPS and
Wi-Fi (which we note are becoming increasingly common
features on cell phones), in order to combine the comple-
mentary strengths of each technology and to maximize the
power and ease of use of the wayfinding system.
ACKNOWLEDGMENTS
The authors would like to acknowledge support from NIH
grant 1 R21 EY017003-01A1, and the first author would also
J. Coughlan and R. Manduchi 13
like to acknowledge useful discussions with Dr. Joshua Miele
and programming assistance from Dr. Huiying Shen.
REFERENCES
[1] J. Coughlan, R. Manduchi, and H. Shen, “Cell phone-based
wayfinding for the visually impaired,” in The 1st International
Workshop on Mobile Vision, Graz, Austria, May 2006.
[2] W.Crandall,B.Bentzen,L.Myers,andJ.Brabyn,“Neworien-
tation and accessibility option for persons with visual impair-
ment: transportation applications for remote infrared audible
signage,” Clinical and Experimental Optometry,vol.84,no.3,
pp. 120–131, 2001.
[3] A. M. Ladd, K. E. Bekris, A. P. Rudys, D. S. Wallach, and L. E.
Kavraki, “On the feasibility of using wireless ethernet for in-
door localization,” IEEE Transactions on Robotics and Automa-
tion, vol. 20, no. 3, pp. 555–559, 2004.
[4] M. S. Uddin and T. Shioyama, “Bipolarity- and projective
invariant-based zebra-crossing detection for the visually im-
paired,” in Proceedings of the 1st IEEE Workshop on Computer
Vision Applications for the Visually Impaired (CVAVI ’05), p. 22,
San Diego, Calif, USA, June 2005.
[5] P. Silapachote, J. Weinman, A. Hanson, R. Weiss, and M. A.
Mattar, “Automatic sign detection and recognition in natural
scenes,” in Proceedings of the 1st IEEE Workshop on Computer
Vision Applications for the Visually Impaired (CVAVI ’05), p. 27,
San Diego, Calif, USA, June 2005.
[6] Y. Cho and U. Neumann, “Multi-ring color fiducial systems
for scalable fiducial tracking augmented reality,” in Proceed-
ings of the IEEE Virtual Reality Annual International Sympo-
sium (VRAIS ’98), p. 212, Atlanta, Ga, USA, March 1998.
[7] D. Claus and A. W. Fitzgibbon, “Reliable fiducial detection in
natural scenes,” in Proceedings of the 8th European Conference
on Computer Vision (ECCV ’04), vol. 4, pp. 469–480, Prague,
Czech Republic, May 2004.
[8] L. Naimark and E. Foxlin, “Circular data matrix fiducial sys-
tem and robust image processing for a wearable vision-inertial
self-tracker,” in Proceedings of t he International Symposium on
Mixed and Augmented Reality (ISMAR ’02), pp. 27–36, Darm-
stadt, Germany, September-October 2002.
[9] D. Scharstein and A. J. Briggs, “Real-time recognition of self-
similar landmarks,” Image and Vision Computing, vol. 19,
no. 11, pp. 763–772, 2001.
[10] A. State, G. Hirota, D. Chen, W. Garrett, and M. Livingston,
“Superior augmented reality registration by integrating land-
mark tracking and magnetic tracking,” in Proceedings of the
23rd Annual Conference on Computer Graphics and Interactive
Techniques (SIGGRAPH ’96), pp. 429–438, New Orleans, La,
USA, August 1996.
[11] A. Zandifar, P. R. Duraiswami, A. Chahine, and L. S. Davis,
“A video based interface to textual information for the visually
impaired,” in Proceedings of the 4th IEEE Internat ional Confer-
ence on Multimodal Interfaces (ICMI ’02), pp. 325–330, Pitts-
burgh, Pa, USA, October 2002.
[12] J. Liang, D. Doermann, and H. Li, “Camera-based analysis of
text and d ocuments: a survey,” International Journal on Doc-
ument Analysis and Recognition, vol. 7, no. 2-3, pp. 84–104,
2005.
[13] X. Chen and A. L. Yuille, “Detecting and reading text in natu-
ral scenes,” in Proceedings of the IEEE Computer Society Confer-
ence on Computer Vision and Pattern Recognition (CVPR ’04),
vol. 2, pp. 366–373, Washington, DC, USA, June-July 2004.
[14] J. Gao and J. Yang, “An adaptive algorithm for text detection
from natural scenes,” in Proceedings of the IEEE Computer So-
ciety Conference on Computer Vision and Pattern Recognition
(CVPR ’01), vol. 2, pp. 84–89, Kauai, Hawaii, USA, December
2001.
[15] A. K. Jain and B. Yu, “Automatic text location in images and
video frames,” Pattern Recognition, vol. 31, no. 12, pp. 2055–
2076, 1998.
[16] H. Li, D. Doermann, and O. Kia, “Automatic text detection
and tracking in digital video,” IEEE Transactions on Image Pro-
cessing, vol. 9, no. 1, pp. 147–156, 2000.
[17] P. Viola and M. Jones, “Rapid object detection using a boosted
cascade of simple features,” in Proceedings of the IEEE Com-
puter Society Conference on Computer Vision and Pattern
Recognition (CVPR ’01), vol. 1, pp. 511–518, Kauai, Hawaii,
USA, December 2001.
[18] B. V. Funt and G. D. Finlayson, “Color constant color index-
ing,” IEEE Transactions on Pattern Analysis and Machine Intel-
ligence, vol. 17, no. 5, pp. 522–529, 1995.
[19] R. Manduchi and C. Tomasi, “Distinctiveness maps for im-
age matching,” in Proceedings of the 10th International Confer-
ence on Image Analysis and Processing, pp. 26–31, Venice, Italy,
September 1999.
[20] A. Baumberg, “Reliable feature matching across widely sep-
arated views,” in Proceedings of the IEEE Computer Soci-
ety Conference on Computer Vision and Pattern Recognition
(CVPR ’00), vol. 1, pp. 774–781, Hilton Head Island, SC, USA,
June 2000.
[21] D. G. Lowe, “Distinctive image features from scale-invariant
keypoints,” International Journal of Computer Vision, vol. 60,
no. 2, pp. 91–110, 2004.
[22] C. Schmid, R. Mohr, and C. Bauckhage, “Evaluation of inter-
est point detectors,” International Journal of Computer Vision,
vol. 37, no. 2, pp. 151–172, 2000.
[23] J. Shi and C. Tomasi, “Good features to track,” in Proceedings of
the IEEE Computer Society Conference on Computer Vision and
Pattern Recognition (CVPR ’94), pp. 593–600, Seattle, Wash,
USA, June 1994.
[24] G. Shar ma and H. J. Trussell, “Digital color imaging,” IEEE
Transactions on Image Processing, vol. 6, no. 7, pp. 901–932,
1997.
[25] J. Coughlan and R. Manduchi, “Functional assessment of a
camera phone-based wayfinding system operated by blind
users,” in Conference of IEEE Computer Society and the Bio-
logical and Artificial Intelligence Society (IEEE-BAIS), Research
on Assistive Technologies Symposium (RAT ’07), Dayton, Ohio,
USA, April 2007.