Báo cáo hóa học: " Research Article Optimum Detection of Ultrasonic Echoes Applied to the Analysis of the First Layer of a Restored Dome" pot
Bạn đang xem bản rút gọn của tài liệu. Xem và tải ngay bản đầy đủ của tài liệu tại đây (1.66 MB, 10 trang )
Hindawi Publishing Corporation
EURASIP Journal on Advances in Signal Processing
Volume 2007, Article ID 26560, 10 pages
doi:10.1155/2007/26560
Research Article
Optimum Detection of Ultrasonic Echoes Applied to
the Analysis of the First Layer of a Restored Dome
Luis Vergara, Ignacio Bosch, Jorge Gos
´
albez, and Addisson Salazar
Departamento de Comunicaciones, Universidad Polit
´
ecnica de Valencia, 46022 Valencia, Spain
Received 26 February 2007; Accepted 19 June 2007
Recommended by William Allan Sandham
Optimum detection is applied to ultrasonic signals corrupted with significant levels of grain noise. The aim is to enhance the echoes
produced by the interface between the first and second layers of a dome to obtain interface traces in echo pulse B-scan mode. This
is useful information for the restorer before restoration of the dome paintings. Three optimum detectors are considered: matched
filter, signal gating, and prewhitened signal gating. Assumed models and practical limitations of the three optimum detectors are
considered. The results obtained in the dome analysis show that prewhitened signal gating outperforms the other two optimum
detectors.
Copyright © 2007 Luis Vergara et al. This is an open access article distributed under the Creative Commons Attribution License,
which permits unrestricted use, distribution, and reproduction in any medium, provided the original work is properly cited.
1. INTRODUCTION
In [1], the authors have considered the ultrasonic echo pulse
technique to help in the analysis of a dome. The first four
layers of the dome were, respectively, mortar (0.3 cm), plas-
ter (1.2 cm), mortar (1.5 cm), and bricks. The work pre-
sented in paper [1] was devoted to the problem of determin-
ing the state of adhesion of the interface between the third
and fourth layers. The depth of such an interface (3 cm) and
the type of materials (mortar-bricks) allowed working with
a transducer of 1 MHz so that grain noise, due to reflec-
tions from the micro-grains of the involved materials, is not
present at all. No sophisticated signal processing techniques
were required in [1]. Actually, the first two interfaces were
not detected at 1 MHz of operating frequency, and the only
echoes were obtained from the mortar-bricks interface.
The problem considered in this paper is outlining the first
interface which is only at a depth of 0.3 cm. This implies the
need for increasing spatial resolution and we require trans-
ducers with higher operating frequencies to reduce the wave-
length. The consequence will be the apparition of significant
amounts of grain noise, thus leading to the need of using the
statistical signal processing techniques presented in this pa-
per.
The first layer of the dome is a 0.3 cm st ratum of mortar,
and the second one consists of a 1.2 cm stratum of plaster.
The objective is to trace the interface between the first and
second layers to provide valuable information to the restor-
ers. Information about the state of conservation of the first
layer is especially important, as this is usually painted over.
Essentially, we want to determine if the layer of mortar is
present or not in a given location of the dome under anal-
ysis. This is needed by the restorer before to proceed with
the restoration to paint. If the layer of mortar is not present
in a given location, it is necessary to add some mortar and
then painting over it. Mortar layer could not be present be-
cause of deterioration due to the pass of time. It i s not always
easy to visually determine the presence or absence of the layer
of mortar, hence ultrasonic information may be valuable for
the restorer. Note that the technique is not intended to detect
variation in mortar thickness, although, in principle, it could
be possible to obtain such information if more than one suc-
cessive echoes of the mortar-plaster interface could be traced
and the ultrasound speed of propagation in mortar could be
assumed or estimated. The minimal detectable mortar thick-
ness will depend on the pulse time duration.
We thus carried out a nondestructive ultrasonic analysis
using the echo pulse inspection mode: an ultrasonic pulse is
sent into the first layer of the mortar, expecting reception of
the echo from the mortar-plaster interface. We successively
locate the sensor along a vertical linear array of locations. At
every location we collect an A-scan (a record of the signal
echoed by the material). Finally, aligning the A-scans one un-
der the other, we built a B-scan where, hopefully, the interface
2 EURASIP Journal on Advances in Signal Processing
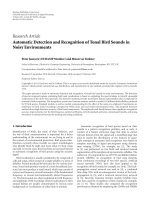
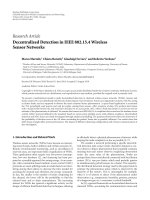
T
Mortar Plaster
Figure 1: Schematic representation of the first layer interface.
76543210
Time (μs)
−5
−4
−3
−2
−1
0
1
2
3
4
5
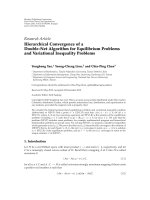
5 MHz through/transmission signal over
a testing probe-mort ar layer (0.3cm)
Amplitude (V)
Established arrival point
Flight time:
1.92 μs
Figure 2: A-scan corresponding to the estimation of the delay in
0.3 cm mortar thickness.
would be outlined (see the scheme in Figure 1, where pos-
sible multiple reflections in the interface have been consid-
ered). Gel contact was used for coupling the sensor to the
wall.
With the aim of selecting the most appropriate trans-
ducer, some experiments were made with 1 and 2 MHz, but
the spatial resolution was too low. We also tested a 10 MHz
transducer, but attenuation was too high to allow reception
of the interface echoes. Finally, a 5 MHz transducer was se-
lected to give an adequate balance between resolution and
the capacity to penetrate into the mortar. It should be noted
that mortar is a material composed of sand and cement paste.
Two essential parts of its microstructure are air pores (sizes
mayvaryfrom10
−10
to 10
−4
m) and sand grains (10
−4
to
10
−3
m). On the other hand, we have estimated the speed
of propagation in this type of mortar by using transmis-
sion mode in a cylindrical section which was built specif-
ically for this goal. A value c
= 1562, 5 (the received sig-
nal and the corresponding delay are shown in Figure 2)was
obtained so that the wavelength corresponding to 5 MHz,
λ
= c/ f = 1562.5/5 · 10
6
= 0, 312 · 10
−3
m, is of the or-
der of the sand grains diameter. That means that significant
201816141210864
t (μs)
10
20
30
40
50
60
70
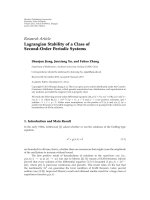
Figure 3: A portion of the original B-scan; the ar rows indicate the
delays where the trace of the mort ar layer interface should be out-
lined.
amounts of grain noise should b e expected, probably hiding
the echoes from the first and second layer interface.
The expectation was certainly true, as one can verify by
observing Figure 3 where we represent a portion of the orig-
inal B-scan and two arrows indicating delays where the in-
terface should be outlined (the details of the experiment are
described in Section 4). Hence, signal processing is necessary
in this case to enhance the presence of the interface echoes (if
possible). This problem may be approached in an optimum
manner in different ways. The most obvious way is that of
maximizing signal-to-noise r atio (SNR) at the output of the
processor, but it is also possible to think about maximiza-
tion of the probability of detection of the interface echoes in
a grain noise background. This latter approach is the one se-
lected here, although, for an appropriate definition of SNR
maximization, both approaches are equivalent, as we men-
tion in Section 2.
The paper is set out as follows. First, in the next section
we define the problem from an optimum detection perspec-
tive. Then in Section 3 we derive the different solutions cor-
responding to different assumptions about the implicit mod-
els. Finally, in Section 4 we apply the optimum detection al-
gorithms to the problem in hand. Some conclusions end the
paper.
2. OPTIMUM DETECTION APPROACH
We wish to detect the presence of a possible ultrasonic echo
pulse p(n) in a segment of the recorded and sampled ultra-
sonic signal r(n). Therefore, we have two possible hypotheses
H
1
r(n) = p(n)+g(n),
H
2
r(n) = g(n),
n
= n
s
, , n
s
+ N − 1, (1)
where n
s
, n
s
+N −1 are, respectively, the starting and the final
sample numbers delimiting the segment (i.e., N is the seg-
ment length), and g(n) corresponds to the grain noise sam-
ples under hypothesis i.
Luis Vergara et al. 3
Detecting the presence of p(n) implies some processing
f [
·] on the segment
z
n
s
=
f [r], r =
r
n
s
···
r
n
s
+ N − 1
T
,(2)
and comparison with a threshold
if
z
n
s
>t decide H
1
,
if
z
n
s
<t decide H
2
.
(3)
If we move the value n
s
along the recorded signal, we may
obtain a nonbinary output signal in the form
r
out
n
s
=
r
n
s
if H
1
is decided,
0ifH
2
is decided,
(4)
which is the output sequence after processing the input se-
quence r(n
s
).
Optimum design of f [
·] can be made by maximizing the
signal-to-noise ratio enhancement (SNRE) factor
SNRE
=
SNR
out
SNR
in
,
SNR
out
=
E
r
out
n
s
H
1
E
r
out
n
s
2
H
2
,
SNR
in
=
E
r
n
s
H
1
E
r
n
s
2
H
2
,
(5)
where E[
·] means statistical expectation. It can be easily
shown (see, e.g., [2, page 111]) that
SNRE
=
PD
PFA
0.5
,(6)
where PD and PFA are, respectively, the probability of de-
tection and the probability of false alarm corresponding to
the detection problem defined in (1)–(3). Hence, maximiz-
ing PD for a given PFA (Neyman-Pearson optimum detec-
tor) in (1)-(3) implies maximization of SNRE for all the pos-
sible gating post-processors of the type (4). Thus, optimum
design of f [
·] implies solving an optimum detection prob-
lem, and this will be the approach adopted in this paper.
3. OPTIMUM DETECTORS
Let us start from the detection problem defined in (1). We
will consider in the following the Neyman-Pearson criterion
for the design of the optimum detectors. Note that maximiz-
ing PD for a given PFA is more suitable for ultrasonic pulse
detection, as it is in other related areas like radar or sonar,
where the “a priori” probability of H
1
is much smaller than
the “a priori” probability of H
2
. Let us consider the differ-
ent models, their corresponding optimum solutions, and the
practical limitations.
Model 1
We assume the following:
(i) perfect knowledge of vector s defined by p
= a · s;
s
T
s = 1, p = [p(n
s
) ···p(n
s
+ N − 1)]
T
.
(ii)
{g(n)} is locally stationary Gaussian inside every inter-
val [n
s
, n
s
+ N − 1] having the power spectrum S
g
(ω).
The optimum solution is the well-known matched filter
detector ([3] and the appendix)
z
n
s
=
f (r) = r
T
C
−1
g
s,(7)
where C
g
= E[gg
T
] is the grain noise local covariance matrix.
Note that the value a in model 1 is not required. It will
depend on the object reflectivity and on the attenuation of
the pulse in the go and return path through the first layer.
Besides, it will be affected by the surface and by the pressure
on the transducer in the manual measurement. In detection
theory, the test is said to be uniformly most powerful (UMP)
in the unknown parameter a.
On the other hand, the spectrum of the grain noise S
g
(ω)
(and so the covariance matrix C
g
)canbeestimatedtosome
extent if some training material samples, resembling the ac-
tual operating materials under test, were available. It could be
estimated also from sample records measured on the speci-
men under test if they are mostly composed by grain noise.
Finally, the vector s , which represents the form of the
pulse to be detected, depends on the pulse arriving at the
possible reflector, which, due to the propagation effects, is
a distorted version of the actual pulse sent into the material.
It also depends on the reflector itself. Some approximation
to s could be obtained by “offline” estimation of the pulse
waveform using a material with good propagation properties
for ultrasound at the corresponding operating frequency. But
good knowledge of s cannot be assumed in general. Let us
consider some simple forms to overcome the need for esti-
mating s.
Model 2
Same as Model 1 regarding the grain noise model, but we
assume, with respect to the pulse, that: C
−1
g
s = k, k =
[k 0 ···0]
T
.
From (7), the optimum solution is a simple gating of the
original signal
z
n
s
= f (r) = r
T
k = k · r
n
s
. (8)
The above assumption is a simple form to overcome the need
for estimating s (note that knowledge of k is not required as
this factor can be absor b ed by the threshold t in (3)). Unfor-
tunately, there are no arguments justifying that the assump-
tion, which makes optimum the gating detector, will be ver-
ified in general. Hence, one should not expect good results
using a simple gating detector except for cases of high signal-
to-noise ratio (but in these cases all detectors work fine).
4 EURASIP Journal on Advances in Signal Processing
Model 3
Same as Model 1 regarding the grain noise model, but we
assume, with respect to the pulse, that C
−1/2
g
s = k, k =
[k 0 ···0]
T
.
From (7), the optimum solution is a gating of the signal
pre-whitened by matrix C
−1/2
g
,
z
n
s
=
f (r) = r
T
C
−1/2
g
C
−1/2
g
s = r
T
w
k = k · r
w
n
s
,(9)
where r
w
= C
−1/2
g
r.
The above assumption is again a simple form to over-
come the need for estimating s. In this case, some justifica-
tion may be found about the general verification of the as-
sumed pulse model. It is clear that matrix C
−1/2
g
implements
a linear transformation that “whitens” the grain noise com-
ponent in r (1):
E
g
w
g
T
w
=
C
−1/2
g
E
gg
T
C
−1/2
g
= C
−1/2
g
C
g
C
−1/2
g
= I ⇐⇒ S
gw
(ω) = 1.
(10)
But the assumption with respect to the pulse implies that
C
−1/2
g
also “whitens” the spectrum of the pulse (it changes
s to a delta vector k). This suggests that this assumption is
equivalent to consider that grain noise has a generative model
consisting in white noise filtered by a linear filter having im-
pulse response s. This is a simple but a reasonable model if
we take into account that grain noise could be considered
the result of the superposition of many echoes coming from
the material grains, that is, the result of convolving the ma-
terial reflectivity with the ultrasonic pulse sent into it [4]. As
far as this linear generative model of grain noise could be a
good approximation of the actual behavior of the material,
one should expect good results by using the optimum detec-
tor (9).
In the following, we will consider the three optimum de-
tectors for the problem in hand.
4. ANALYSIS OF THE FIRST L AYER OF
ARESTOREDDOME
The research of this work is done under the framework of a
collaboration between our Signal Processing Group and the
Institute for Cultural Heritage Conservation of the Polytech-
nic University of Valencia. A final goal was to develop a ver-
satile prototype for ultrasonic nondestructive testing which
could b e applied to different problems relative to restora-
tion of domes or walls in historical buildings. Versatility was
achieved by allowing the use of different sensors and by de-
veloping different signal processing modules, both things
adapted to every particular problem. That is, for example,
in [1]wedescribedadifferent problem which was worked
with essentially the same equipment, but using a different
sensor and different (simpler) signal processing algorithms.
Of course some parameters to set up the equipment must be
also selected for every problem (amplifier gain, analog filter,
sampling frequency, etc.). On the other hand, a requirement
is that this equipment could be used by people with no spe-
cial skills in ultrasonics or in signal processing: the user inter-
face must be simple and the calibration must be essentially
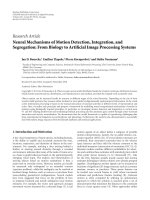
Figure 4: Picture of the 1 : 1 dome scale model.
automatic for every problem. Requirements of both versa-
tility and ease of operation justify not using more advanced
systems that could be more adapted to the particular prob-
lem considered in this manuscript. Moreover, developing our
own signal processing algorithms allows us a total control of
the work.
The study was made on a 1 : 1 scale model of the actual
dome to overcome the problems of accessibility and the dan-
ger of damaging paintings. A photograph of the 1 : 1 scale
modelisshowninFigure 4. Model dimensions are 2.5m
width, 2 m height, and 0.5 m thick. There is a convex curve
in the wall, as in the actual dome.
Relevant information on the acquisition follows:
(i) ultrasonic pulse generation: PR5000 Matec Instru-
ments with a 2500 watts maximum power output;
(ii) transducer: 5.0 MHz/.250 KB-A 66492, Krautkramer,
excitation signal 5 MHz burst tone;
(iii) amplifier gain 65 dB;
(iv) analog filter: 2.5 MHz–6 MHz;
(v) tektronix TDS3012 digitalization equipment, sam-
pling frequency 20 MHz, amplitude resolution 16 bits,
dynamic range
±2.5V;
(vi) labtop PC for signal transferring and storage.
Note that a 5 MHz burst tone excitation signal was used
with the aim of tuning most of the emitted ultrasonic en-
ergy in a band centred at 5 MHz. Every ultrasonic pulse sent
into the material is the result of convolving an (approximate)
five cycles segment of a 5 MHz sinusoid with the impulse re-
sponse of the piezoelectric crystal.
We collected 75 A-scan of 100 microseconds in the lo-
cations indicated in Figure 5. The vertical array of locations
(separation between two consecutive locations was 2 cm)
crossed some areas where modifications had been made to
the surface (a special type of paper was attached to the
wall after preparation of the paintings). This affected the
transducer-wall coupling in such a way that different sig-
nals were recorded in the affected locations. Note that, except
Luis Vergara et al. 5
Modified surface
Modified surfaces
Figure 5: Photographic composition indicating the vertical array
where the A-scans were collected, and the locations where some
modifications were observed in the surface.
for significant changes of the surface, variability of coupling
(due, e.g., to different hand pressure on the sensor) may pro-
duce variability in the injected ultrasonic energy. But signal-
to-grain-noise ratio will be the same, so that, in pr inciple, all
thefourdetectorswillbeaffected in a similar manner. The
only concern is that ultrasonic energy could reduce in such a
manner that reflections from the interface could not be de-
tectable at all.
Normally, the restorer has the prior knowledge about the
layer structure of the dome because some destructive inspec-
tions have been done in appropriate parts of it, because part
of the dome is deteriorated and the inner structure of lay-
ers is visible or because there are documents available de-
scribing the dome. T hus, the scale model was built after that
prior knowledge of the actual dome. The interest for the re-
storer is to have information about the state of the layers in
some specific areas of the domes; in this particular case to
know the presence or absence of the mortar layer in every
part where painting is to be restored, as explained before. We
know that the first layer of mortar (if present) is 0.3 cm thick,
so we can predict what the results should be if the ultra-
sonic technique could be a ble to trace the interface between
the first and second layers after the first, second, third,
or nth reverberant echoes. We need an estimate of the ex-
pected delay between echoes from the interface (the value
T in Figure 1). This was done in a small cylindrical section
(0.3 cm height) of the same type of mortar, by measuring
the transmission delay between two identical 5 MHz trans-
ducers, each located on the opposite face of the cylinder. A
value of 1.92 microseconds was obtained (see Figure 2), so
we considered a raw estimate T
= 2 × 1.92 = 3.84 microsec-
onds. This meant that a possible first reflection from the in-
terface should arrive at 3.84 microseconds, a second one at
2
× 3.84 = 7.68 microseconds, a third one at 11.52 micro-
seconds, and so on.
Figure 3 showed the orig inal B-scan (75 A-scans) in the
delay interval of 4 to 20 microseconds. This is because the
idle time of the receiver is approximately 4 microseconds,
and that after 20 microseconds ultrasonic energy practically
disappears. This means that the only expected indications (if
any) from the interface would be due to a second reflection
at a delay of 7.68 microseconds and/or the third reflection
at a delay of 11.52 microseconds. This is indicated by two
arrows in the axis time of Figure 3. It should be noted that
no echo trace from the interface is apparent in the origi-
nal B-scan, which is composed of multiple echoes, proba-
bly coming from surface irregularities and from the mor-
tar grain noise. Note that in the locations corresponding
to modified surfaces, the backscattered ultrasonic energy is
much lower than in the other locations, hence when we rep-
resent all the A-scan together, using a common amplitude
scale, it seems that there are no ultrasonic responses at these
locations. It should be mentioned that the received signals
were prefiltered by an analog bandpass filter adapted to the
useful bandwidth (2.5 MHz–6 MHz), previously to digital-
ization. However, looking at Figure 3 where we represent the
digital records, it can be appreciated that magnitude of grain
noise is still comparable to magnitude of the echoes from the
interface. That is the essence of the justification for using sta-
tistical digital signal processing to extract relevant informa-
tion. It should be noted that grain noise is due to echoes from
small grains of the materials, thus the grain noise power spec-
tral density overlaps with the interface echoes spectrum. That
is why the analog pre-filtering does not help us too much in
this problem.
Before presenting the results of the processing, we will
consider some aspects of the selection of the parameters in-
volved in the algorithms. We need to fit N and C
g
. The length
of the moving window N depends on the duration of the
pulse; hence we have estimated “offline” the ultrasonic pulse
by using a piece of a material having good ultrasound prop-
agation properties (methacrylate). We measured a duration
of the pulse of 1 microseconds (i.e., 5 cycles of the nominal
frequency of the 5 MHz transducer). This duration seems to
be a correct estimate also for mortar (see the first part of the
received signal in Figure 2). In any case, this is not a critical
parameter and a raw estimate of the pulse duration suffices.
Adifferent matter is the capability for measuring an appro-
priate waveform for implementing matched filtering; this is
the problem with model 1, as we il lustrate with the results
below.
On the other hand, we tested different alternatives for es-
timating the grain noise matrix C
g
, which produced rather
similar results in this application. In the case of the results
shown below, they were obtained by estimating a grain noise
matrix for every A-scan using the classical sample estimate
C
g
=
1
R
R
i=1
r
i
r
T
i
, (11)
where r
i
, i = 1 ···R, indicate all the possible intervals to be
processed in the corresponding A-scan.
6 EURASIP Journal on Advances in Signal Processing
181614121086
t (μs)
10
20
30
40
50
60
70
(a)
181614121086
t (μs)
10
20
30
40
50
60
70
(b)
181614121086
t (μs)
10
20
30
40
50
60
70
(c)
181614121086
t (μs)
10
20
30
40
50
60
70
(d)
Figure 6: Detection results: (a) matched filter (Model 1), (b) gating of the original s ignal (Model 2), (c) gating of the prewhitened signal
(Model 3), (d) suboptimum technique.
In the Figures 6(a), 6(b),and6(c), we show the detec-
tions (binary B-scan), respectively, obtained with the opti-
mum detectors corresponding to models 1, 2, and 3. The re-
quired vector s needed in the matched filter detector was ob-
tained from the ultrasonic pulse measured in the methacry-
late piece; PFA
= 0.001 in all cases. Detectors corresponding
to models 1 and 2 ( Figures 6(a) and 6(b))arenotabletoob-
tain the trace of the third reflection. However, the detector of
model 3 (Figure 6(c)), which corresponds to a gating of the
prewhitened signals, is able to outline the interface. The sec-
ond reflection is too corrupted by multiple surface and inner
reflections to allow reconstruction of the interface trace. A
possible fourth reflection seems to be too attenuated to ap-
pear. It is noticeable in Figure 6(c) that some detections are
also obtained in those scans corresponding to modified sur-
faces, even though it was no apparent backscattered energy
(Figure 3).
For completeness, we have also tried some suboptimum
techniques. We use the term suboptimum in the sense that
these algorithms do not come from optimum solutions cor-
responding to a well-defined model as 1, 2 or 3. But they
may have general applicability even when the assumptions
of models 1, 2, and 3 are not appropriate. For example,
Gaussianity is not a correct hypothesis for some coarse-
grained materials [5], due to the obtained “spiky” grain noise
records, or for materials exhibiting regular spreading of the
grains [6]. It is also reasonable to assume that the presence
of the interface may alter the grain noise statistics, so that we
should consider a different grain noise model under every
hypothesis.
These techniques [2, 7] decompose the signal into dif-
ferent narrowband frequency channels and nonlinearly pro-
cess the channel outputs in different forms depending on the
particular algorithm selected. Enhancing of the possible pres-
ence of the echo is based in the assumption that grain noise
will exhibit large level v ariation at the different channel out-
puts, meanwhile the possible target echo distr ibutes its en-
ergy uniformly among the different channels. In essence, this
is a similar assumption to that one made in model 3, because
frequency sensitive of the grain noise appears with the linear
Luis Vergara et al. 7
Table 1: Quantitative comparison of the results obtained with the different methods (interface vicinity is defined after Figure 6 as the delay
interval from 10 to 12.5 microseconds).
Mean of number of detections
per scan inside the interface
vicinit y
Standard deviation of number of
detections per scan inside the interface
vicinit y
Mean/Std
Matched filter
(Model 1)
0.84 1.15 0.730
Gating of the
original signal
(Model 2)
0.97
1.16 0.836
Gating of the
prewhitened signal
(Model 3)
1.52
1.29
1.178
Suboptimum
technique
11.15
12.98 0.859
generative model mentioned above: the echoes due to the
grains of the material may add in a constructive (synchro-
nized phase) or destructive manner for every frequency com-
ponent, thus affecting the grain noise level at every channel
output. The difference with model 3 is that now Gaussianity
and identical noise distribution under both hypotheses are
not assumed. Moreover, there is not any assumption about
the pulse waveform s except its insensitivity to the center fre-
quency of the channel.
For a better comparison we have also adopted a detec-
tion approach to the suboptimum algorithms. First, we com-
pute the discrete Fourier transform (DFT) of every vector
r
w
= C
−1/2
g
r. This is a simple form of implementing the
frequency channels. On the other hand, prewhitening is re-
quired to equalize the pulse spec trum. Second, a given band
centred at the transducer nominal frequency is selected and a
detector is applied to every frequency bin inside the selec ted
band. Finally, hypothesis H
1
(presence of interface echo) is
accepted when all the individual detectors are in favor of
H
1
. The corresponding algebraic expression of the algorithm,
preserving as much as possible the notation used until now,
is given by
z
i
n
s
=
f
i
(r) = r
T
w
e
i
,
e
i
=
1 e
− j(2π/N)i
e
− j(2π/N)i·2
···e
− j(2π/N)i·(N−1)
T
,
0 <i
l
≤ i ≤ i
u
<N− 1;
if
z
i
n
s
>tfor all i,decideH
1
, otherwise, decide H
2
.
(12)
Note that e
i
is the DFT vector tuned to normalized frequency
i/N and that i
l
and i
u
are respectively the lower and upper
bins delimiting the band of analysis. This latter must coincide
with the band of the pulse, so that actually some knowledge
about s is also required.
We have tested the detector of (12) in the dome appli-
cation. The band of analysis has b een determined from the
same “offline” pulse estimate used in the matched filter and
it coincides with the useful bandwidth established by the ana-
log filter (2.5–6 MHz). The sampling frequency was 20 MHz.
This implies a useful normalized bandwidth of (6
−2.5)/20 =
0.175. On the other hand, the pulse duration was 1 microsec-
onds, that is, 20 samples at a sampling frequency of 20 MHz,
hencewefittedN
= 20. Therefore, in the normalized in-
terval of 0.175, we have 20
× 0.175 = 3.5 independent bins
available for implementing (12). Actually we used bins 3, 4,
and 5 corresponding respectively to the analog frequencies
3, 4 and 5 MHz. Results are shown in Figure 6(d).Itcanbe
seen that there are no significant improvements with respect
to a gating of the prewhitened signal. Although, in general,
the suboptimum technique produces a “cleaner” B-scan, the
trace of the third reflection is worse outlined. With respect to
the second reflection, we see again that it is not detected at
all. As we already mentioned, it seems to be too corrupted by
multiple surface and inner reflections to allow reconstruc-
tion of the interface trace. Note that surface reflections are
produced only once, but interface reflections have a rever-
beration effect and (except for the progressive echo attenua-
tion) could appear several times along the ultrasonic records.
On the other hand, attenuation model of grain noise could
be different from the attenuation model of interface echoes,
thus justifying the possibility of detecting the third reflection
but not the second one, because this later could be more cor-
rupted by grain noise, in spite of its larger amplitude.
We have also computed some values from Figure 6 with
the aim of having some quantitative comparison among the
different methods. These values should be considered com-
plementary information to the (qualitative) direct obser-
vation of Figure 6. The computed values are indicated in
Tabl e 1. For every method we had counted the number of
detections inside the vicinity of the interface (defined after
Figure 6, as the delay interval from 10 to 12.5 microseconds).
Then, we have computed the mean number of detections per
A-scan inside the interface vicinity (i.e., total number of de-
tections inside the vicinity divided by 75, the total number of
A-scans) and the corresponding standard deviation. This lat-
ter value gives us some insight into the degree of uniformity
in the distribution of detections among the different scans.
8 EURASIP Journal on Advances in Signal Processing
201816141210864
t (μs)
46
47
48
49
50
51
52
53
54
55
56
(a)
201816141210864
t (μs)
46
47
48
49
50
51
52
53
54
55
56
(b)
181614121086
t (μs)
46
47
48
49
50
51
52
53
54
55
56
(c)
181614121086
t (μs)
46
47
48
49
50
51
52
53
54
55
56
(d)
Figure 7: Processed A-scans (46 to 56): (a) original A-scans, (b) matched filter (Model 1), (c) gating of the prewhitened signal, (Model 3),
(d) suboptimum technique.
Note that, in principle, we should receive echoes from the
interface in all the scans, as we know a priori that the mor-
tar layer is always present in the scale model of the dome. In
consequence, the normalized mean (last column in Tab le 1 )
may be a valuable figure of merit to evaluate the quality of
the corresponding method in conjunction with the qualita-
tive information. Model 3 gives the largest normalized mean.
The suboptimum technique gives significantly more detec-
tions per scan than the optimum techniques, but variance is
very large (see in Figure 6(d) that there are a lot of detections
in some scans but only a little or even zero in many other).
To gain further insights into the capability of the methods
to deal with the grain noise problem, we have represented in
Figure 7 the processed A-scans. This has been done after (4),
that is, every time a detection is produced, we keep the (mag-
nitude) of the sample value, otherwise a zero is given. We
have selected in Figure 7 the scans 46 to 56, which includes
the modified surface section where, apparently, there was no
ultrasonic energy. Note that only model 3 and suboptimum
techniques exhibit a significant signal level at the delays cor-
responding to the third echo, including some of the A-scans
corresponding to the modified surf ace.
We conclude that in this application, the hypothesis as-
sumedinmodel3seemstobeappropriateforareasonable
extraction of the interface trace.
5. CONCLUSIONS
We have presented in this paper the application of opti-
mum detectors to the problem of outlining the interface be-
tween the first and second layer of a dome. From a signal
processing perspective, the problem is automatic detection
of pulses embedded in a grain noise background. We have
considered three models and their corresponding solutions:
matched filter, gating of the original signal, and gating of the
prewhitened original signal. The use of a matched filter re-
quires knowledge of the waveform of the signal which is to
be detected. Gating of the original signal is optimum only
Luis Vergara et al. 9
if the pulse verifies a condition which cannot be justified by
physical arguments of grain noise generation. However, gat-
ing of the prewhitened original signal is optimum if the grain
noise admits a linear generative model consisting in the con-
volution of the material reflectivity and the pulse waveform.
A suboptimum technique exploiting frequency sensitivity of
grain noise has also been tested with no significant improve-
ments with respect to the prewhitening of the original signal.
Therefore, model 3 seems to be appropriate in the considered
application.
Although focused to dome analysis, the general proce-
dure followed in this work may be applied in other non-
destructive analysis involving materials which produce high
levels of grain noise.
APPENDIX
Let us express the hypotheses of (1) in vector form (to ease
the notation dependence on n
s
of the different vectors is not
expressed)
H
1
r = p + g, p =
p
n
s
···
p
n
s
+ N − 1
T
,
H
2
r = g, g =
g
n
s
···
g
n
s
+ N − 1
T
.
(A.1)
The optimum detector is obtained by comparing the log-
likelihood ratio with a threshold λ [3]. The log-likelihood
ratio is the quotient of the probability density functions of
the observation vector r conditioned to hypotheses H
1
and
H
2
, respectively, that is,
log
P
r/H
1
P
r/H
2
H
1
>
<
H
2
λ. (A.2)
Given the conditions of Model 1, we have that both P(r/H
1
)
and P(r/H
2
) wil l be multivariate Gaussian having vector
mean 0 and as,respectively
P
r/H
1
=
1
(2π)
N
C
g
exp
−
1
2
(r
− as)
T
C
−1
g
(r − as)
,
P
r/H
2
=
1
(2π)
N
C
g
exp
−
1
2
r
T
C
−1
g
r
.
(A.3)
Substituting in (A.2), we arrive to
ar
T
C
−1
g
s − a
2
s
T
C
−1
g
s
H
1
>
<
H
2
λ ⇐⇒ r
T
C
−1
g
s
H
1
>
<
H
2
λ
a
+ as
T
C
−1
g
s = λ
.
(A.4)
Under H
2
, the statistic z(n
s
) = r
T
C
−1
g
s is a zero mean Gaus-
sian random variable having unit variance so that λ
can be
easily computed to obtain a given PFA. Optimality guaran-
teesthatPDwillbemaximum.
ACKNOWLEDGMENTS
This work has been supported by Spanish Administration,
under Grant TEC2005-01820, and by European Community,
FEDER program.
REFERENCES
[1] J. Gos
´
albez, A. Salazar, I. Bosch, R. Miralles, and L. Vergara,
“Application of ultrasonic nondestructive testing to the diagno-
sis of consolidation of a restored dome,” Materials Evaluation,
vol. 64, no. 5, pp. 492–497, 2006.
[2] M. G. Gustafsson, “Nonlinear clutter suppression using split
spectrum processing and optimal detection,” IEEE Transactions
on Ultrasonics, Ferroelectrics, and Frequency Control, vol. 43,
no. 1, pp. 109–124, 1996.
[3] L. L. Scharf, Statistical Signal Processing, Addison-Wesley, Read-
ing, Mass, USA, 1991.
[4] L. Vergara, J. Gos
´
albez, J. V. Fuente, R. Miralles, and I. Bosch,
“Measurement of cement porosity by centroid frequency pro-
files of ultrasonic grain noise,” Signal Processing, vol. 84, no. 12,
pp. 2315–2324, 2004.
[5]L.VergaraandJ.M.P
´
aez, “Backscattering grain noise mod-
elling in ultrasonic non-destructive testing ,” Waves in Random
Media, vol. 1, no. 1, pp. 81–92, 1991.
[6] V. M. Narayanan, R. C. Molthen, P. M. Shankar, L. Vergara,
and J. M. Reid, “Studies on ultrasonic scattering from quasi-
periodic structures,” IEEE Transactions on Ultrasonics, Ferro-
electrics, and Frequency Control, vol. 44, no. 1, pp. 114–124,
1997.
[7] L. Ericsson and T. Stepinski, “Algorithms for suppressing ul-
trasonic backscattering from material structure,” Ultrasonics,
vol. 40, no. 1–8, pp. 733–734, 2002.
Luis Vergara was born in Madrid (Spain)
in 1956. He received the Ingeniero de Tele-
comunicaci
´
on and the Doctor Ingeniero de
Telecomunicaci
´
on degrees from the Uni-
versidad Polit
´
ecnica de Madrid (UPM) in
1980 and 1983, respectively. Until 1992, he
worked at the Departamento de Se
˜
nales,
Sistemas y Radiocomunicaciones (UPM) as
an Associate Professor. In 1992 he joined the
Departamento de Comunicaciones, Univer-
sidad Polit
´
ecnica de Valencia (UPV), Spain, where he became Pro-
fessor and where he was Department Head until April 2004. From
April 2004 to April 2005 he was Vicerector of New Technologies at
the UPV. He is now responsible for the Signal Processing Group
of the UPV, a member group of the Institute of Telecommuni-
cation and Multimedia Applications (I-TEAM) of UPV. His re-
search concentrates in the statistical signal processing area, where
he has worked in different theoretical and applied problems, many
of them under contract w ith the industry. His theoretical aspects of
interest are signal detection and classification, independent com-
ponent analysis, and spectral analysis. Currently, he is involved in
ultrasound signal processing for nondestructive evaluation, in in-
frared signal processing for fire detection and in cognitive audio for
surveillance applications. He has published more than 150 papers
including journals and conference contributions.
10 EURASIP Journal on Advances in Signal Processing
Ignacio Bosch wasborninValencia(Spain)
in 1975. He received the Ingeniero de Tele-
comunicaci
´
on and the Doctor Ingeniero de
Telecomunicaci
´
on degrees from the Univer-
sidad Polit
´
ecnica de Valencia (UPV) in 2001
and 2005, respectively. He is an Assistant
Professor at Departamento de Comunica-
ciones, UPV and member of the Signal Pro-
cessing Group of the Institute of Telecom-
munication and Multimedia Applications
(I-TEAM) of UPV. His research concentrates in the statistical signal
processing area, where he has worked in different theoretical and
applied problems, many of them under contract with the industry.
His theoretical aspects of interest are signal detection and classifica-
tion and decision fusion. Currently, he is involved in infrared signal
processing for early warning of forest fires. He has published more
than 40 papers including journals and conference contributions.
Jorge Gos
´
albez wasborninValencia
(Spain) in 1975. He received the Inge-
niero de Telecomunicaci
´
on and the Doc-
tor Ingeniero de Telecomunicaci
´
on degrees
from the Universidad Polit
´
ecnica de Valen-
cia (UPV) in 2000 and 2004, respectively.
He is an Assistant Professor at Departa-
mento de Comunicaciones UPV and mem-
ber of the Sig nal Processing Group of the
Institute of Telecommunication and Multi-
media Applications (I-TEAM) of UPV. His research concentrates
in the statistical signal processing area, where he has worked in dif-
ferent theoretical and applied problems, many of them under con-
tract with the industry. His theoretical aspects of interest are time-
frequency analysis, signal detection, and array processing. Cur-
rently, he is involved in ultrasound signal processing for nonde-
structive evaluation of materials, in surveillance systems based on
acoustic information and in acoustic source location and tr acking
based on sensor and array signal processing. He has published more
than 50 papers including journals and conference contributions.
Addisson Salazar is working towards the
Doctorate degree in Telecommunications at
Universidad Polit
´
ecnica de Valencia (UPV).
He has received the B.S. and M.S. de-
grees in Informatics from Universidad In-
dustrial de Santander and the D.E.A. degree
in Telecommunications from UPV in 2003.
He is a researcher of the Signal Processing
Group of the Institute of Telecommunica-
tion and Multimedia Applications at UPV.
His research interest is focused on statistical signal processing, pat-
tern recognition, data mining, and knowledge discovery, where he
has worked in different theoretical and applied problems, many of
them under contract with the industry. His theoretical aspects of
interest are signal classification, time-frequency analysis, indepen-
dent component analysis, and algorithms for data mining. He has
published more than 70 papers including journals and conference
contributions.