Báo cáo hóa học: " Research Article Performance Evaluation of Super-Resolution Reconstruction Methods on Real-World Data" potx
Bạn đang xem bản rút gọn của tài liệu. Xem và tải ngay bản đầy đủ của tài liệu tại đây (2 MB, 11 trang )
Hindawi Publishing Corporation
EURASIP Journal on Advances in Signal Processing
Volume 2007, Article ID 43953, 11 pages
doi:10.1155/2007/43953
Research Article
Performance Evaluation of Super-Resolution Reconstruction
Methods on Real-World Data
A. W. M. van Eekeren,
1
K. Schutte,
1
O. R. Oudegeest,
2
and L. J. van Vliet
2
1
Electro-Optics Group, TNO Defence, Security and Safety, P.O. Box 96864, 2509 JG The Hague, The Netherlands
2
Quantitative Imaging Group, Department of Imaging Science and Technology, Faculty of Applied Sciences,
Delft University of Technology, Lorentzweg 1, 2628 CJ Delft, The Netherlands
Received 19 September 2006; Accepted 16 April 2007
Recommended by Russell C. Hardie
The performance of a super-resolution (SR) reconstruction method on real-world data is not easy to measure, especially as a
ground-truth (GT) is often not available. In this paper, a quantitative performance measure is used, based on triangle orientation
discrimination (TOD). The TOD measure, simulating a real-observer task, is capable of determining the performance of a specific
SR reconstruction method under varying conditions of the input data. It is shown that the performance of an SR reconstruction
method on real-world data can be predicted accurately by measuring its performance on simulated data. This prediction of the
performance on real-world data enables the optimization of the complete chain of a vision system; from camer a setup and SR
reconstruction up to image detection/recognition/identification. Furthermore, different SR reconstruction methods are compared
to show that the TOD method is a useful tool to select a specific SR reconstruction method according to the imaging conditions
(camera’s fill-factor, optical point-spread-function (PSF), signal-to-noise ratio (SNR)).
Copyright © 2007 A. W. M. van Eekeren et al. This is an open access article distributed under the Creative Commons Attribution
License, which permits unrestricted use, distribution, and reproduction in any medium, provided the original work is properly
cited.
1. INTRODUCTION
During the last decade, numerous super-resolution (SR) re-
construction methods have been reported in the literature.
Reviews can be found in [1, 2]. SR reconstruction is the
process of combining a set of undersampled (aliased) low-
resolution (LR) images to construct a high-resolution (HR)
image or image sequence. A typical solution for SR recon-
struction of an image sequence involves two subtasks: reg-
istration and fusion. Occasionally, an additional deblurring
step is performed afterwards. First, the LR images are reg-
istered against a common reference with subpixel accuracy.
During the fusion, an image at a higher resolution is con-
structed from the scattered input samples. Nonlinear deblur-
ring is needed to extend the frequency spectrum be yond the
cut-off limit of the imaging sensor.
Although SR reconstruction has received significant at-
tention over the past few years, not much work has been
done in the field of performance ( limits) of SR. Relevant
works are reported in [3, 4]. Both study the problem of
SR from an algebraic point of view. Robinson and Milan-
far [5] recently analyzed the performance limits from sta-
tistical first principles using Cram
´
er-Rao inequalities. This
analysis has the advantage that the performance bottlenecks
can be related to the subtask level of an SR reconstruction
method.
This paper discusses the performance of an SR recon-
struction method under different conditions such as number
of input frames and signal-to-noise ratio (SNR), for a spe-
cific vision task, using the char acteristics of modern infrared
(IR) imagers. This vision task is the discrimination of small
objects/details in an image and is measured quantitatively us-
ing triangle orientation discrimination ( TOD) [6, 7]. TOD is
a task-based evaluation method, which measures the ability
to discriminate the orientation of an equilateral triangle un-
der a specific condition.
The performance of an SR reconstruction method on
real-world data is especially interesting to measure, as it
shows the capability of the algorithm in practice. In this pa-
per, it is shown that with the TOD method a quantitative per-
formance measure of an algorithm on real-world data can be
obtained. Moreover, it is shown that the results of this mea-
sure can be predicted accurately by measuring the TOD per-
formance on simulated data. This enables the optimization
and selection of the algorithm in advance given a real-world
camera.
2 EURASIP Journal on Advances in Signal Processing
The paper is organized as follows. In Section 2, the reg-
istration of the real-world and simulated data is discussed.
In Section 3, the different SR reconstruction methods are
discussed. In Section 4, the TOD method is explained and
the setup of the measurements is given. The results are pre-
sented in Section 5 and finally conclusions will be provided
in Section 6.
2. REGISTRATION
The scenes (real-world and simulated) in our experiments
are static and captured with a moving camera. Therefore, the
scene movement between two frames can be described with
a single shift. All LR frames of an image sequence are regis-
tered to a reference frame, which is typically the first frame of
the image sequence. The registration of the LR frames is per-
formed with an iterative gradient-based shift estimator [8].
A gradient-based shift estimator [9] finds the displacement
t
x
between two shifted signals as the least squares solution of
MSE
=
1
N
R
s
2
(
x ) −s
1
(
x ) −t
x
∂s
1
∂
x
2
(1)
with s
2
a shifted version of s
1
,
x the sample positions, and N
the number of samples in supported region R.
The solution of (1) is biased, which is corrected in an iter-
ative way. In the first iteration, s
2
is shifted with the estimated
subpixel displacement, which is accumulated in the next it-
eration with the estimated displacement between s
2
(shifted
s
2
)ands
1
. This schema is iterated until convergence, finally
resulting in a very precise (σ
disp
≈ 0.01 pixel for noise free
data) unbiased registration, which approaches the Cram
´
er-
Rao bound [10].
In our experiments, the set of registered LR frames is
processed by each of the SR fusion/deblurring methods de-
scribed in the following section. It is important to note that
all methods use the same set of registered LR frames. This
implies that differences in overall performance are not due
to differences in registration.
3. SUPER-RESOLUTION FUSION/DEBLURRING
METHODS
This section briefly describes the different SR reconstruction
methods used in the performance evaluation. The first three
methods perform only fusion, w hereas the last three methods
also incorporate deblurring.
3.1. Elad’s shift and add method
After registration of all LR frames, Elad’s [11] reconstruction
method assigns each LR sample to the nearest HR grid point.
When this is done for all LR samples, the mean is taken of all
LR samples on each HR grid point. Note that the shift and
add method is only a fusion method and does not incorpo-
rate deblurring.
3.2. Lertrattanapanich’s triangulation-based method
In [12], Lertrattanapanich proposes a t riangle-based surface
interpolation method for irregular sampling. First, a Delau-
nay triangulation of all registered LR samples is performed,
followed by an approximation of each triangle surface with a
bicubic polynomial function. The pixel value z(x, y)atanew
HR grid location (x, y) is expressed as in (2):
z(x, y)
=c
1
+c
2
x+c
3
y+c
4
x
2
+c
5
y
2
+c
6
x
3
+c
7
x
2
y+c
8
xy
2
+ c
9
y
3
.
(2)
Note that the monomial xy is omitted to maintain the
geometric isotropy. The nine parameters c
i
can be solved
with three vertices (LR samples) and their corresponding
estimated gradients along x and y directions. Lertrattana-
panich’s triangulation-based method performs fusion only.
3.3. Kaltenbacher’s least-squares method
without regularization
This method [13] is based on the idea of estimating the
“underlying” unaliased frequency spectrum from multiple,
aliased spectra. For sake of clarity, the 1D case will be ex-
plained below. With the shift property, the Fourier transform
F
i
of a shifted frame i before sampling is
F
i
(ω) = F(ω)e
jδ
i
ω
,(3)
where δ
i
is the shift of frame i and F(ω) is the Fourier trans-
form of the original image. After sampling by the camera the
transform in (3)convertsto
F
i
(n) =
1
S
∞
m=−∞
F
i
2π
NS
n
− mω
s
. (4)
Here,
F
i
(n) is the discrete Fourier transform of LR input
frame i
= 1, , P. S is the sampling period and ω
s
= 2π/S is
the sampling frequency, N is the amount of samples per LR
frame, and n
= 1, , N is the sample index (here S = 1and
ω
s
= 2π).
If the sampling frequency is increased by a factor K
(zoom factor) such that Kω
s
> 2ω
c
(cutoff frequency), the
limits in the summation of (4) can be changed to
−K/2+1
and
K/2. When all shifts δ
i
are known and K is chosen, for
each sample n a set of equations can be written:
G
n
= Φ
n
F
n
,(5)
where G
n
is a column vector with the nth Fourier component
of each LR frame,
G
n
(i) =
F
i
(n), (6)
and Φ
n
is the (P ×K) t ransformation matrix defined by
Φ
n
(i, k) = e
j2πδ
i
(n/N+(K/2−k))
. (7)
F
n
is the column vector with the K-target Fourier com-
ponents dependent on n. This method needs at least 2K LR
input frames. When more than 2K frames are used, a least-
squares solution of the target Fourier components is ob-
tained by the Moore-Penrose inverse of Φ
n
:
F
n
=
Φ
T
n
Φ
n
−1
Φ
T
n
G
n
. (8)
A. W. M. van Eekeren et al. 3
3.4. Hardie’s method using a regularized
inverse observation model
Hardie et al. [14] employ a discrete observation model that
relates the ideally sampled image z and the obser ved frames
y:
y
m
=
H
r=1
w
m,r
z
r
+ η
m
,(9)
where w
m,r
represents the contribution of the rth HR pixel
in z to the mth LR pixel in y. This contribution depends on
the frame-to-frame motion and on the blurring of the point
spread function (PSF). η
m
denotes additive noise.
The HR image estimate
z is defined as the z that mini-
mizes
C
z
=
L
m=1
y
m
−
H
r=1
w
m,r
z
r
2
+ λ
H
i=1
H
j=1
α
i, j
z
j
2
(10)
with L the number of LR samples and H the number of HR
grid points.
Thecostfunctionin(10) balances two types of errors.
The left term is minimized when a candidate z,projected
through the observation model (9), matches the observed
data. The right term is a regularization term, which is nec-
essary as directly minimizing the first term is an ill posed
problem. The parameters α
i, j
(11) are selected to perform a
Laplacian oper ation on z and ensure that the regularization
term is minimized when z is smooth:
α
i, j
=
⎧
⎪
⎪
⎨
⎪
⎪
⎩
1fori = j
−1
4
for j : z
j
is a cardinal neighbor of z
i
.
(11)
3.5. Farsiu’s robust method
In comparison with Hardie’s method, the reconstruction
method proposed by Farsiu et al. [15] separates the fusion
and deblurring processes of an SR reconstruction method:
(1) the LR frames are fused with median shift and add (sim-
ilar as described in Section 3.1, but now the median, rather
than the mean, is taken of the samples at each HR grid point),
(2) the fusion result z
0
is deblurred using an iterative mini-
mization method. The cost function that must be minimized
to obtain the SR image
z from fusion result z
0
is shown in
(12):
C
z
=
A
Gz − z
0
1
+ λ
P
l=0
P
m=0
α
m+l
z − S
l
h
S
m
v
z
1
. (12)
Here, matrix A is a diagonal matrix with diagonal val-
ues equal to the square root of the number of measurements
that contributed to make each element of z
0
. Therefore, un-
defined pixels in z
0
will have no influence on the SR estimate
z.MatrixG is a blur matrix that models the PSF of the cam-
era system. The regularization term on the right-hand side is
based on the bilateral total variation (TV) criterion [15]. Ma-
trices S
l
h
and S
m
v
shift z by l and m pixels in horizontal and ver-
tical directions, respectively. The scalar weight α,0<α<1,
is applied to give a spatial decaying effect.
3.6. Pham’s structure-adaptive and robust method
Pham et al. [16] recently proposed an SR reconstruction
method using adaptive normalized convolution (NC). NC
[17] is a technique for local signal modeling from projections
onto a set of basis functions. Pham uses a first-order polyno-
mial basis as shown:
f
s, s
0
=
p
0
s
0
+ p
1
s
0
x + p
2
s
0
y, (13)
where
f is the approximated intensity value at sample s,
(x, y) are the local coordinates of s with respect to the cen-
ter of analysis, s
0
and p
i
are the projection coefficients. In
contrast with a polynomial expansion like the Haralick facet
model [18], NC uses (1) an applicability function to local-
ize the polynomial fit and (2) allows each input sample to
have its own certainty value. To determine the projection co-
efficients at an output position s
0
, the approximation error
is minimized over the extent of an applicability function a
centered at s
0
:
ε
s
0
=
f (s) −
f
s, s
0
2
c(s)a
s − s
0
ds, (14)
with a the applicability function and c the certainty of each
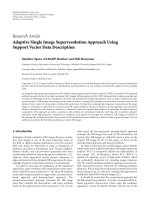
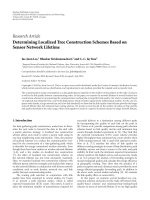
sample within the extent. A schematic overv iew of Pham’s
methodisdepictedinFigure 1.
After registration of the LR samples, the first step of the
fusion process consists of estimating an initial polynomial
expansion (using a flat model at a locally weighted median
level), which results in I
HR
0
. Next, NC using a robust cer-
tainty (15) is performed, which results in a better estimate
I
HR
1
and two corresponding derivatives I
HR
x
and I
HR
y
,
c
s, s
0
= exp
−
f (s) −
f
s, s
0
2
2σ
2
r
. (15)
Here, the photometric spread σ
r
defines an acceptable
range of the residual error
|f −
f |.Thederivativesareused
in the last fusion step to construct anisotropic applicability
functions for adaptive NC. Such an applicability function is
an anisot ropic Gaussian function whose main axis is rotated
to align with the local dominant orientation. Deblurring is
done with bilateral TV regularization (as in Farsiu’s method).
4. PERFORMANCE EVALUATION EXPERIMENTS
To measure the performance of SR reconstruction, several
quantitative measures such as mean squared error (MSE) and
modulation transfer function (MTF) are often used. How-
ever, we use the triangle orientation discrimination (TOD)
measure as proposed in [6]. The TOD method determines
the smallest triangle size in an image of which the orientation
can be discriminated. This evaluation method is preferred
4 EURASIP Journal on Advances in Signal Processing
I
LR
0
I
LR
1
.
.
.
I
LR
n
Registration
I
LR
i
δ
i
Weig hte d
median
I
HR
0
Robust
NC
I
HR
1
I
HR
x
I
HR
y
Adaptive
NC
I
HR
2
Deblur
I
SR
Robust and adaptive fusion
Figure 1: Flow diagram of Pham’s structure-adaptive and robust SR reconstruction method.
Up
(a)
Right
(b)
Down
(c)
Left
(d)
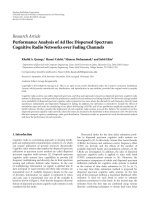
Figure 2: The four different stimuli used in the TOD method.
over methods like MSE and MTF because (1) the measure-
ment is done in the spatial domain and is well localized, and
(2) it employs a specific vision task. This vision task is di-
rectly related to the acquisition of real targets, which was first
shown by Johnson [19]. Such a relationship is relevant for
determining the limitations of your camera system including
the image processing for recognition purposes. The MSE and
MTF are neither localized nor task related. The MTF method
is also not suited for evaluating nonlinear algorithms, which
most SR reconstruction methods are.
4.1. TOD method
The TOD method is an evaluation method designed for sys-
tem performance of a broad range of imaging systems. It is
based on the observer task to discriminate four different ori-
ented equilateral triangles (see Figure 2).
The observer task is a four-alternative forced choice, in
which the observer has to indicate which of the four orien-
tations is perceived, even when he is not sure. In the experi-
ments, an automatic observer is used which makes its choice
θ based on the minimum MSE between the triangle in the SR
result I
HR
and a triangle model M:
θ = min
θ,s
1
N
x
I
HR
x; θ
f
, s
f
−
M
x; θ, s
2
. (16)
Here, θ indicates the orientation, s indicates the size of
the triangle,
x are the sample positions, and N is the number
of samples. Note that θ is limited to the four different orien-
tations and s is quantized in steps of 4/17th of the LR pixel
pitch. The subscript f denotes one member of these sets. Al-
though (16) is minimized for θ and s, only the estimated ori-
entation
θ is used as a result. Note that triangle model M can
also incorporate a gain and offset parameter.
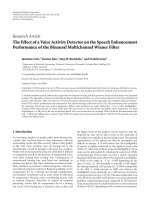
The probability of a correct observer response increases
with the triangle size. In [6] it is shown that this increase can
be described with a Weibull distribution:
p
c
(x) = 0.25 +
0.75
1.5
(α/x)
β
, (17)
where α is x at 0.75 probability correct and β defines the
steepness of the transition. Such a Weibull distribution can
be fitted to a number of observations for different triangle
sizes as depicted in Figure 3. From this fit the triangle size
that corresponds with an 0.75 probability correct response
(T
75
) is determined. T
75
(in LR pixels) is a performance mea-
sure, where a smaller T
75
indicates a better performance.
When for different conditions, for example, SNR, T
75
sare
determined, a performance curve can be plotted. Such curves
will be used in Section 5 to show the results.
4.2. Real-world data experiment
In this experiment the performance of an SR reconstruction
method on real-world data is measured.
4.2.1. Setup
The setup of the experiment (including TOD) is depicted in
Figure 4. The LR data I
LR
comes from a real-world thermal
IR camera (FLIR SC2000) with a rotating mirror in front of
the lens. In the scene a thermal camera acuity tester (T-CAT
[20]) is present as depicted in the left-hand side of Figure 4.
This apparatus contains an aluminium plate with 5 rows of
4 equilateral triangle shaped cutouts. A black body plate is
placed 3 cm behind this plate. Between the plates several tem-
perature differences can be created. By controlling the tem-
perature difference, different contrast levels (SNRs) are ob-
tained. Although the triangle shaped cutouts on the plate
vary in size, more size variation can be obtained by changing
the distance from the apparatus to the camera. Real-world
data sequences (40 frames) are processed with three different
SR reconstruction methods with optimized parameter set-
tings: Elad’s method, Hardie’s method, and Pham’s method.
From both the I
LR
data and the reconstructed I
HR
data the orientation of the triangles is determined. This is
done using (16) with gain and offset estimation in trian-
gle model M. The triangle model M is implemented with
shifted, blurred, and downsampled triangles in the triangle
database. T he triangle database contains equilateral triangles
with sides 12, 16, , 280 pixels. In our evaluation each tri-
angle is equidistantly shifted, blurred (σ
= 0.9 × S), and
A. W. M. van Eekeren et al. 5
00.51 1.522.5
Triangle size (LR pixels)
0
0.2
0.4
0.6
0.8
1
Probability correct
T
75
Fit
Measurements
Figure 3: Example of a possible Weibull distribution of probability
correct observer response.
downsampled (S = 17) resulting in 25 realizations for each
triangle. Here the blurring with σ
= 0.9 × S is chosen
such that these reference triangles will have a right balance
between residual aliasing and high-frequency content [21].
The orientation of the triangle obtained from the triangle
database that results in the smallest mean-square error with
the triangle in the data is selected. In the final step of the ex-
periment setup the obtained orientation in the previous step
is compared with the known ground-truth (GT) orientation
of the triangle in the original real-world data.
4.2.2. Measurements on real-world data
To validate the performance on real-world data of the SR re-
construction methods with simulations, some measurements
are needed of the real-world data: (1) SNR, (2) point-spread-
function (PSF) of the lens, and (3) fill factor (ff), which is the
percentage of photo-sensitive area of the pixels on the focal
plane array sensor.
The real-world data was recorded with three differ ent
temperature differences of the T-CAT, which results in three
SNRs. Here, the SNR dB is defined as
SNR
= 20 log
10
I
TR
− I
BG
σ
BG
, (18)
with I
TR
is the triangle intensity, I
BG
the background intensity
on the T-CAT plate, and σ
BG
the standard deviation of I
BG
.
Our measurements resulted in SNRs 7 dB, 30 dB, and 48 dB.
The parameters of the camera (PSF and ff ) are obtained
by estimating the overall blur (LR pixels), σ
tot
, in the real-
world data by fitting an erf model to several edges in the data
(with highest SNR). Measurements on edges of large trian-
gles resulted in an overall blur of σ
tot
≈ 0.7, whereas on
medium-sized triangles an overall blur of σ
tot
≈ 0.5 was mea-
sured. When comparing these measurements with the spec-
ifications of the camera (FLIR SC2000), the smallest overall
Infrared
camera
Shift,
blur,
I
LR
Determine
orientation
I
HR
Compare with
original
SR
reconstruction
Orientation
Triangle
database
I
LR
Figure 4: Left: example of real-world data I
LR
. Right: flow diagram
of the real-world data experiment.
I
HYP
i
Translation
PSF
blurring
S
· δ
i
G(S · σ
PSF
) U(S ·
√
ff )
Fill factor
Downsample
S
Σ
Noise
I
LR
i
Camera model
Figure 5: Camera model used in the experiments.
blur seems more likely. Given the camera model as depicted
in Figure 5, the PSF blur can be determined from the overall
blur for a certain fill fac tor. In modern infrared cameras a re-
alistic fill factor is approximately 80% [22, page 101]. Given
a σ
tot
= 0.5 the blurring of the lens is σ
PSF
= 0.4.
4.3. Simulated data experiment 1
Based on the estimates of the camera’s parameters, simulated
data sets have been generated. After processing the simulated
data sets with the same SR reconstruction methods as in the
previous experiment an indication can be obtained of the
predictability of the real-world performance of these algo-
rithms.
4.3.1. Camera model
A data set is simulated with a camera model as depicted in
Figure 5,whereI
HYP
i
is a discrete representation of a scene
sampled at the Nyquist rate with an S
× smaller sampling dis-
tance than the observed frames I
LR
i
. δ
i
represents the trans-
lation of the camera, the PSF of the lens is modeled with a
2D Gaussian func tion G with standard deviation S
·σ
PSF
and
the fill factor are modeled with a unifor m filter U with width
S
·
√
ff. The overall noise in the camera model is assumed to
be Gaussian distributed.
In this experiment two simulated data sets I
LR
are gener-
ated: (1) σ
PSF
= 0.3, ff = 0.8, which results in a less-blurred
data set as derived in Section 4.2.2 and (2) σ
PSF
= 0.55, ff =
0.8, which results in a more-blurred data set. The downsam-
pling factor is chosen as S
= 17. The shift vectors S·δ
i
are ran-
dom integer shifts ([0,S] pixels in the hyper-resolution (HY)
domain) such that this results in subpixel shifts in the sim-
ulated data. Different amounts of Gaussian noise are added,
resulting in a SNR varying from 12 dB to 42 dB.
6 EURASIP Journal on Advances in Signal Processing
Scene
generator
I
HYP
Camera
model
Shift,
blur,
I
LR
Determine
orientation
I
HR
Compare with
original
SR
reconstruction
Orientation
Triangle
database
I
LR
Figure 6: Left: example of simulated data I
LR
. Right: flow diagram
of the simulated data experiment.
4.3.2. Setup
The setup of the experiment on simulated data is depicted in
Figure 6. The scene generator produces HY scenes I
HYP
con-
taining different triangle sizes and orientations from the tri-
angle database. The camera model converts the I
HYP
data to
I
LR
data in such a way that for each triangle size 16 realiza-
tions are present in the data set. Note that the number of real-
izations determines the statistical validity of the experiment.
The I
LR
data, of which an example is shown in the left-hand
side of Figure 6, is the input for the SR reconstruction meth-
ods. Note that the settings of these methods are the same as
for processing the real-world data. From both the I
LR
data
and the reconstructed I
HR
data the triangle orientation is de-
termined using (16). Note that for this experiment no gain
and offset estimation is used in the triangle model M.
4.4. Simulated data experiment 2
This experiment is done to show that the TOD method is a
useful tool to select a specific SR reconstruction method ac-
cording to the imaging conditions (camera’s fill factor, opti-
cal PSF, SNR). Here, camera model parameters (σ
PSF
= 0.2,
ff
= 1) that result in a more-aliased data set than the previous
simulated data sets are chosen. These parameters are cho-
sen to enhance the differences between the SR reconstruction
methods. To measure the performance of each method, the
same setup is used as in “simulated data experiment 1” (see
Figure 6). The p erformance of the SR reconstruction meth-
ods is measured for the following conditions
(1) Different number of frames.
(2) Different SNRs.
(3) Different zoom factors.
Note that the first two conditions are determined by the sim-
ulated data and the last one (ratio between resulting HR grid
and original LR grid) is determined by the algorithm. Only
Hardie’s, Farsiu’s, and Pham’s methods are tuned to perform
optimally under the varying conditions. For all three meth-
ods the parameter λ is tuned. The tuning criterium is to ob-
tain a smallest T
75
triangle size under the condition at hand.
Note that the parameter λ in Hardie’s method has a slightly
different meaning than in the other two methods. The pa-
rameter σ, which is the standard deviation of a Gaussian
function and represents both the PSF due to the optics and
the sensor blur due to the fill factor, is chosen in such a way
that it fitted best to the blurring of our used camera model.
The results of all experiments are discussed in the follow-
ing section.
4.5. TOD versus MSE
An alternative measure to TOD is the MSE:
MSE
=
1
N
x
I
HR
(
x; θ
f
, s
f
− M
x; θ
f
, s
f
2
. (19)
To show the difference between both measures, the fol-
lowing experiment is performed. Simulated LR data (varying
SNR) is processed with the Hardie SR reconstruction method
with different settings (varying λ andnumberofframes).
The resulting images are fi rst scored with the TOD
method and subsequently the MSE is calculated between the
SR results and a triangle model M of size s
f
closest to the tri-
angle threshold (T
75
) found. Contour plots of both measures
are depicted in Figure 7.
It is clear from Figure 7 that the profiles of the TOD mea-
sure differ from the corresponding MSE profiles. Analyzing
the profiles for a fixed frame number shows that the “opti-
mal” λ resulting in the lowest T
75
is significantly smaller than
the “optimal” λ resulting in the lowest MSE: 10
−2
and 1, re-
spectively. The corresponding SR results (not depicted in this
paper) show that a small λ result in steep edges with some
ringing at the boundary of the triangles. Note that TOD and
thereby correct identification does not solely depend on the
lowest MSE found, but rather on the separability (
= expected
difference in MSE between the observation and the correct
assignment and the MSE between the observation and an
incorrect assignment divided by the variance of the MSE).
Hence, the ringing imposes a positive influence on this mea-
sure of separability.
5. RESULTS
All results of the experiments can be found at the end of this
paper. Note that the vertical axis in the plots indicate the tri-
angle threshold size at 75% probability correct. A smaller
triangle threshold size (T
75
) corresponds with a better per-
formance, hence the lower the curve, the better the perfor-
mance.
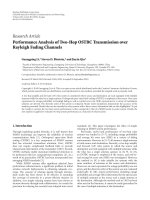
5.1. Results of real-world data and simulated
data experiment 1
The results of the “real-world data experiment” and the “sim-
ulated data experiment 1” can be seen in Figure 8. These
graphs show that the performance on real-world data can
be approximated by the performance of a simulated data
set. The depicted performance of the two simulated data sets
form a performance lower bound (σ
PSF
= 0.55 and ff = 0.8,
resulting in an “overall” σ
tot
≈ 0.6) and a perfor mance upper
bound (σ
PSF
= 0.3andff = 0.8, resulting in σ
tot
≈ 0.4) on
the real-world performance. Note that in Figure 8 the per-
formance upper bound is visually a lower bound and the
A. W. M. van Eekeren et al. 7
41664
Frame number
T
75
,Hardie,zoom2,σ = 0.37, SNR = 42 dB
10
−4
10
−3
10
−2
10
−1
10
0
10
1
λ
1
1.5
2
2.5
3
(a)
41664
Frame number
T
75
, Hardie, zoom 2, σ = 0.37, SNR = 24 dB
10
−4
10
−3
10
−2
10
−1
10
0
10
1
λ
1
1.5
2
2.5
3
(b)
41664
Frame number
MSE, Hardie, zoom 2, σ
= 0.37, SNR = 42 dB
10
−4
10
−3
10
−2
10
−1
10
0
10
1
λ
0
50
100
150
200
250
300
(c)
41664
Frame number
MSE, Hardie, zoom 2, σ
= 0.37, SNR = 24 dB
10
−4
10
−3
10
−2
10
−1
10
0
10
1
λ
0
200
400
600
800
1000
1200
1400
(d)
Figure 7: (a) Contour plot T
75
, SNR = 42 dB, (b) contour plot T
75
, SNR = 24 dB, (c) contour plot MSE, SNR=42 dB, (d) contour plot MSE,
SNR
= 24 dB.
performance lower bound is visually an upper bound. Elad’s
method shows that for all SNRs the performance on the real-
world data is close to the performance upper bound. For
Hardie’s method we see the opposite for high SNRs: here
the real-world performance is equal to the performance lower
bound. Furthermore, it can be seen that the performance on
real-world data of the three algorithms is s imilar for low and
medium SNR, whereas for high SNR P ham’s and Hardie’s
methods perform slightly better.
5.2. Results of simulated data experiment 2
In Figure 9 the performance of all SR reconstruction meth-
ods with zoom factor 2 for different number of LR input
frames is compared. Here the black line indicates the per-
formance on “raw” unprocessed LR input data and therefore
should be taken as baseline reference. From these plots it is
clear that the performance of all SR reconstruction meth-
ods improves when processing more frames. For high SNRs
this improvement is only marginal, but for low SNRs it is
significant. Kaltenbacher’s method performs poorly when
processing only 4 LR frames. This can be explained by
the fact that the shifted LR frames are nonevenly spread,
which results in an unstable solution. When 64 LR frames
are processed, Lertrattanapanich’s method performs worst
for low SNRs. For high SNRs the performance of Elad’s
method performs worst. The best performing SR recon-
struction methods (when many LR frames are available)
are Kaltenbacher’s method and Hardie’s method, closely fol-
lowed by the method of Pham.
8 EURASIP Journal on Advances in Signal Processing
0 1020304050
SNR (dB)
0
1
2
3
4
5
6
T
75
(LR pixels)
LR, real d ata
Real data
Simulated data (σ
= 0.55)
Simulated data (σ
= 0.3)
Real versus simulated data, Elad’s method, zoom 2, 40 frames
(a)
0 1020304050
SNR (dB)
0
1
2
3
4
5
6
T
75
(LR pixels)
LR, real data
Real data
Simulated data (σ
= 0.55)
Simulated data (σ
= 0.3)
Real versus simulated data, Hardie’s method, zoom 2, 40 frames
(b)
01020304050
SNR (dB)
0
1
2
3
4
5
6
T
75
(LR pixels)
LR, real data
Real data
Simulated data (σ = 0.55)
Simulated data (σ
= 0.3)
Real versus simulated data, Pham’s method, zoom 2, 40 frames
(c)
Figure 8: Performance measurements on real-world and simulated
data (40 frames). Blue line: simulated data created with σ
PSF
= 0.55
and ff
= 80%, green line: simulated data created with σ
PSF
= 0.3
and ff
= 80%. (a) Elad, (b) Hardie (σ = 0.55, λ = 0.01), (c) Pham
(σ
= 1, λ = 10
−3
, β = 10). All data is processed with zoom factor 2.
0
0.5
1
1.5
2
2.5
3
3.5
4
T
75
(LR pixels)
0 1020304050
SNR (dB)
LR
Elad
Lertrattanapanich
Kaltenbacher
Hardie
Farsiu
Pham
4frames
(a)
0
0.5
1
1.5
2
2.5
3
3.5
4
T
75
(LR pixels)
0 1020304050
SNR (dB)
LR
Elad
Lertrattanapanich
Kaltenbacher
Hardie
Farsiu
Pham
16 frames
(b)
0
0.5
1
1.5
2
2.5
3
3.5
4
T
75
(LR pixels)
0 1020304050
SNR (dB)
LR
Elad
Lertrattanapanich
Kaltenbacher
Hardie
Farsiu
Pham
64 frames
(c)
Figure 9: Performance measurements on simulated LR data (σ
PSF
=
0.2, ff = 100%) processed with different SR reconstruction methods
(zoom factor 2) with optimized settings, (a) 4 frames, (b) 16 frames,
(c) 64 frames.
A. W. M. van Eekeren et al. 9
0
0.5
1
1.5
2
2.5
3
3.5
4
T
75
(LR pixels)
0 1020304050
SNR (dB)
LR
Zoom 1
Zoom 2
Zoom 4
Elad’s method, 64 frames
(a)
0
0.5
1
1.5
2
2.5
3
3.5
4
T
75
(LR pixels)
0 1020304050
SNR (dB)
LR
= zoom 1
Zoom 2
Zoom 4
Lertrattanapanich’s method, 64 frames
(b)
0
0.5
1
1.5
2
2.5
3
3.5
4
T
75
(LR pixels)
0 1020304050
SNR (dB)
LR
Zoom 2
Zoom 4
Kaltenbacher’s method, 64 frames
(c)
0
0.5
1
1.5
2
2.5
3
3.5
4
T
75
(LR pixels)
0 1020304050
SNR (dB)
LR
Zoom 1
Zoom 2
Zoom 4
Hradie’s method, 64 frames
(d)
0
0.5
1
1.5
2
2.5
3
3.5
4
T
75
(LR pixels)
01020304050
SNR (dB)
LR
Zoom 1
Zoom 2
Zoom 4
Farsiu’s method, 64 frames
(e)
0
0.5
1
1.5
2
2.5
3
3.5
4
T
75
(LR pixels)
01020304050
SNR (dB)
LR
Zoom 1
Zoom 2
Zoom 4
Pham’s method, 64 frames
(f)
Figure 10: Performance measurements on simulated LR data (σ
PSF
= 0.2, ff = 100%, 64 frames), processed with different methods with
optimized settings for zoom factors 1, 2, and 4. (a) Elad, (b) Lertrattanapanich, (c) Kaltenbacher (no zoom factor 1 results could be obtained
with our implementation), (d) Hardie, (e) Farsiu, (f) Pham.
10 EURASIP Journal on Advances in Signal Processing
To illustrate the effect of an increasing zoom factor,
Figure 10 shows performance curves of all SR reconstruction
methods for zoom factors 1, 2, and 4. All methods processed
the same 64 LR frames (σ
PSF
= 0.2andff = 100%). From
Figure 10 it is clear that the performance of zoom factors 2
and 4 for most methods (except for Kaltenbacher’s method
and Farsiu’s method) is comparable. For low SNRs the per-
formance of each method (for all zoom factors) is signifi-
cantly better compared to LR performance. Here, the tem-
poral noise reduction is visible. For high SNRs the results
show an improvement of a factor 2, which approximately
equals the amount of aliasing in the LR data. This explains
why zoom factor 4 does not yield a significant better per-
formance. Note that the bad performance of Kaltenbacher
with zoom factor 4 compared with zoom factor 2 can be ex-
plained by the fact that this method has no regular ization
and hence becomes ill posed. Furthermore, an improvement
by a factor 2 (between zoom factor 1 and zoom factors 2 and
4) is not obtained for low SNRs. Here, the temporal noise
reduction is more relevant than the antialiasing. The perfor-
mance of some SR reconstruction methods, when processed
with zoom factor 1 under high SNR, is slightly worse com-
pared to baseline LR performance. This could be explained
by blurring in the fusion process and/or blurring as a result
of registration errors.
6. CONCLUSIONS
From the results in the previous section, the following con-
clusions can be derived.
(1) From the results of the real-world data experiment it
can be concluded that the performance of different
SR reconstruction methods on real-world data can be
predicted accurately by measuring the performance on
simulated data, if a proper estimate of the parameters
of the real-world camera system is available.
(2) With the ability to predict the performance of an SR re-
construction method on real-world data, it is possible
to optimize the complete chain of a vision system. The
parameters of the camera and the algorithm must be
chosen such that the performance of the vision task is
optimized.
(3) It is shown that with the TOD method the perfor-
mance of SR reconstruction methods can be compared
for a specific condition of the LR input data. Consid-
ering the imaging conditions (camera’s fill factor, op-
tical PSF, SNR) the TOD method enables an objective
choice on which SR reconstruction method to use.
(4) Comparing the performance of the unregularized
Kaltenbacher’s method with the regularized methods
of Hardie, Farsiu, and Pham (see Figure 9), it can
be concluded that in general regularization is not re-
quired for good performance when many input frames
are available.
(5) The relative performance of the various methods
change a little as a function of SNR.
(6) The results presented in Figure 10 show that a larger
zoom factor does not yield a better performance. This
can be explained by the fact that sensors with high
fill factors exert an amount of blurring on the LR in-
put frames and therefore limit the resolution gain and
hence the maximum achievable resolution gain. For
high SNRs the resolution gain is approximately equal
to the amount of aliasing in the LR data and for low
SNRs the resolution gain is minor compared with the
temporal noise reduction.
ACKNOWLEDGMENTS
The authors would like to thank T. Q. Pham for the imple-
mentation of several of the used SR reconstruction methods
and thank P. Bijl for providing the infrared data.
REFERENCES
[1] S. C. Park, M. K. Park, and M. G. Kang, “Super-resolution im-
age reconstruction: a technical overview,” IEEE Signal Process-
ing Magazine, vol. 20, no. 3, pp. 21–36, 2003.
[2] S. Farsiu, M. D. Robinson, M. Elad, and P. Milanfar, “Advances
and challenges in super-resolution,” International Journal of
Imaging Systems and Technology, vol. 14, no. 2, pp. 47–57,
2004.
[3] S. Baker and T. Kanade, “Limits on super-resolution and how
to break them,” IEEE Transactions on Pattern Analysis and Ma-
chine Intelligence, vol. 24, no. 9, pp. 1167–1183, 2002.
[4] Z. Lin and H Y. Shum, “Fundamental limits of
reconstruction-based superresolution algorithms under
local translation,” IEEE Transactions on Pattern Analysis and
Machine Intelligence, vol. 26, no. 1, pp. 83–97, 2004.
[5] M. D. Robinson and P. Milanfar, “Statistical performance anal-
ysis of super-resolution,” IEEE Transactions on Image Process-
ing, vol. 15, no. 6, pp. 1413–1428, 2006.
[6] P. Bijl and J. M. Valeton, “Triangle orientation discrimina-
tion: the alternative to minimum resolvable temperature dif-
ference and minimum resolvable contrast,” Optical Engineer-
ing, vol. 37, no. 7, pp. 1976–1983, 1998.
[7] P. Bijl, K. Schutte, and M. A. Hogervorst, “Applicability of
TOD, MTDP, MRT and DMRT for dynamic image enhance-
ment techniques,” in Infrared Imaging Systems: Design, Anal-
ysis, Modeling, and Testing XVII, vol. 6207 of Proceedings o f
SPIE, pp. 1–12, Kissimmee, Fla, USA, April 2006.
[8] T. Q. Pham, M. Bezuijen, L. J. van Vliet, K. Schutte, and C.
L. Luengo Hendriks, “Performance of optimal registration es-
timators,” in Visual Information Processing XIV, vol. 5817 of
Proceedings of SPIE, pp. 133–144, Orlando, Fla, USA, March
2005.
[9] B. D. Lucas and T. Kanade, “An iterative image registration
technique with an application to stereo vision,” in Proceedings
of the DARPA Image Understanding Workshop, pp. 121–130,
Washington, DC, USA, April 1981.
[10] S. M. Kay, Fundamentals of Statistical Signal Processing: Esti-
mation Theory, Prentice-Hall, Upper Saddle River, NJ, USA,
1993.
[11] M. Elad and Y. Hel-Or, “A fast super-resolution reconstruction
algorithm for pure translational motion and common space-
A. W. M. van Eekeren et al. 11
invariant blur,” IEEE Transactions on Image Processing, vol. 10,
no. 8, pp. 1187–1193, 2001.
[12] S. Lertrattanapanich and N. K. Bose, “High resolution im-
age formation from low resolution frames using Delaunay tri-
angulation,” IEEE Transactions on Image Processing, vol. 11,
no. 12, pp. 1427–1441, 2002.
[13] E. Kaltenbacher and R. C. Hardie, “High resolution infrared
image reconstruction using multiple, low resolution, aliased
frames,” in Proceedings of IEEE National Aerospace and Elec-
tronics Conference (NAECON ’96), vol. 2, pp. 702–709, Day-
ton, Ky, USA, May 1996.
[14] R.C.Hardie,K.J.Barnard,J.G.Bognar,E.E.Armstrong,and
E. A. Watson, “High-resolution image reconstruction from a
sequence of rotated and translated frames and its application
to an infrared imaging system,” Optical Engineering, vol. 37,
no. 1, pp. 247–260, 1998.
[15] S. Farsiu, M. D. Robinson, M. Elad, and P. Milanfar, “Fast and
robust multiframe super resolution,” IEEE Transactions on Im-
age Processing, vol. 13, no. 10, pp. 1327–1344, 2004.
[16] T. Q. Pham, L. J. van Vliet, and K. Schutte, “Robust fusion of
irregularly sampled data using adaptive normalized convolu-
tion,” EURASIP Journal on Applied Signal Processing, vol. 2006,
Article ID 83268, 12 pages, 2006.
[17] H. Knutsson and C F. Westin, “Normalized and differen-
tial convolution,” in Proceedings of IEEE Society Conference on
Computer Vision and Pattern Recognition (CVPR ’93), pp. 515–
523, New York, NY, USA, June 1993.
[18] R. M. Haralick and L. Watson, “A facet model for image data,”
Computer Graphics and Image Processing, vol. 15, no. 2, pp.
113–129, 1981.
[19] J. Johnson, “Analysis of image forming systems,” in Proceedings
of Image Intensifier Symposium, pp. 249–273, Fort Belvoir, Va,
USA, October 1958.
[20] J. M. Valeton, P. Bijl, E. Agterhuis, and S. Kriekaard, “T-CAT, a
new t hermal camera acuity tester,” in Infrared Imaging Systems:
Design, Analysis, Modelling, and Testing XI, vol. 4030 of Pro-
ceedings of SPIE, pp. 232–238, Orlando, Fla, USA, April 2000.
[21] L. J. van Vliet and P. W. Verbeek, “Better geometric measure-
ments based on photometric information,” in Proceedings of
IEEE Instrumentation and Measurement Technology Conference
(IMTC ’94), vol. 3, pp. 1357–1360, Hamamatsu, Japan, May
1994.
[22] T. Q. Pham, Spatiotonal adaptivity in super-resolution of under-
sampled image sequences, Ph.D. thesis, Quantitative Imaging
Group, TU Delft, Delft, The Netherlands, 2006.
A. W. M. van Eekeren was born in 1977.
He received his M.S. degree in 2002 from
the department of Elect rical Engineering at
the Eindhoven University of Technology. He
did his graduation project within Philips
Medical Systems on the topic of image en-
hancement. Subsequently he worked one
year at the Philips Research Laboratory on
image segmentation using level sets. In 2004
he started his Ph.D. project entitled “super-
resolution on small moving objects” at the Electro-Optics group
within TNO in collaboration with the Quantitative Imaging group
at the Delft University of Technology. His research interests include
image restoration, super resolution, image quality assessment, and
object detection.
K. Schutte received his M.S. degree in
Physics in 1989 from University of Ams-
terdam and received his Ph.D. degree in
1994 from University of Twente on his the-
sis “knowledge-based recognition of man-
made objects.” Subsequently he had a post-
doctoral position with the Delft University
of Technology’s Pattern Recognition (now
Quantitative Imaging) group. Since 1996 he
is employed by TNO, currently as Senior
Research Scientist Electro-Optics within the Business Unit Obser-
vation Systems. Within TNO he has actively led multiple projects
in areas of signal and image processing. Recently he has led many
projects including super-resolution reconstruction for both inter-
national industries and governments, resulting in super-resolution
reconstruction-based products in active service. His research inter-
ests include pattern recognition, sensor fusion, image analysis and
image restoration. He is Secretary of the NVBHPV, the Netherlands
branch of the IAPR.
O. R. Oudegeest received his B.S. degree in
applied physics at Delft University of Tech-
nology in 2004. His B.S. thesis was titled:
“alternatives for CT scanning in the diag-
nosis of endovascular aneurysm stent-graft
migration.” In 2007 he received his M.S.
degree in applied physics at Delft Univer-
sity of Technology on the subject of “super-
resolution on and classification of small
moving objects.” His research interests in-
clude super resolution, tracking, and pattern recognition.
L. J. van Vliet is a Full Professor in multi-
dimensional image processing and analy-
sis at Delft University of Technology. He
studied applied physics at Delft University
of Technology and received his Ph.D. de-
gree cum laude in 1993. His thesis enti-
tled “grey-scale measurements in multidi-
mensional digitized images” presents novel
methods for sampling-error-free measure-
ments of geometric object features. He has
worked on various sensor, image restoration, and image measure-
ment problems in quantitative microscopy and medical imaging.
In 1996 he was awarded a fellowship of the Royal Netherlands
Academy of Arts and Sciences (KNAW). He was a Visiting Scientist
at LLNL (1987), UCSF (1988), Amoco ATC (1989–1990), Monash
University (1996), and LBNL (1996).