Báo cáo hóa học: " Research Article Time-Frequency Analysis of Heart Rate Variability for Neonatal Seizure Detection" pdf
Bạn đang xem bản rút gọn của tài liệu. Xem và tải ngay bản đầy đủ của tài liệu tại đây (1.52 MB, 10 trang )
Hindawi Publishing Corporation
EURASIP Journal on Advances in Signal Processing
Volume 2007, Article ID 50396, 10 pages
doi:10.1155/2007/50396
Research Article
Time-Frequency Analysis of Heart Rate Variability for
Neonatal Seizure Detection
M. B. Malarvili,
1
Mostefa Mesbah,
1
and Boualem B o ashash
1, 2
1
Perinatal Research Centre, School of Medicine, University of Queensland, Herston, QLD 4029, Australia
2
Signal Processing Research Center, Department of Electrical and Computer Engineering, College of Engineering,
University of Sharjah, P.O. Box 27272, Sharjah, United Arab Emirates
Received 1 May 2006; Revised 29 Januar y 2007; Accepted 2 February 2007
Recommended by Pablo Laguna Lasaosa
There are a number of automatic techniques available for detecting epileptic seizures using solely electroencephalogram (EEG),
which has been the primary diagnosis tool in newborns. The electrocardiogram (ECG) has been much neglected in automatic
seizure detection. Changes in heart rate and ECG rhythm were previously linked to seizure in case of adult humans and animals.
However, little is known about heart rate variability (HRV) changes in human neonate during seizure. In this paper, we assess the
suitability of HRV as a tool for seizure detection in newborns. The features of HRV in the low-frequency band (LF: 0.03–0.07 Hz),
mid-frequency band (MF: 0.07–0.15 Hz), and high-frequency band (HF: 0.15–0.6 Hz) have been obtained by means of the time-
frequency distribution (TFD). Results of ongoing time-frequency (TF) research are presented. Based on our preliminary results,
the first conditional moment of HRV which is the mean/central frequency in the LF band and the variance in the HF band can be
used as a good feature to discriminate the newborn seizure from the nonseizure.
Copyright © 2007 M. B. Malarvili et al. This is an open access article distributed under the Creative Commons Attribution License,
which permits unrestricted use, distribution, and reproduction in any medium, provided the or iginal work is properly cited.
1. INTRODUCTION
Neonatal epileptic seizures are major indicators of a number
of central nervous system (CNS) disorders. A careful assess-
ment of seizures is needed at the early stage to prevent further
damages to the brain [1]. Growing attention is focused on the
development of computerized methods to automatically de-
tect newborn seizure based on the EEG. There are a number
of techniques available for detecting neonatal EEG seizures in
the time [2], frequency [3], and time-frequency [4] domains.
However, neonatal seizure recognition remains a ver y chal-
lenging task and lacks a reliable detection scheme for clinical
use [5]. There is a new tendency towards using information
from different physiological signals such as ECG, respiration,
and blood pressure to detect seizure [6–9]. This extra infor-
mation is expected to enhance the performance and robust-
ness of the seizure detectors. This is in line with our long-
term goal of using information from different physiological
signals such as EEG, ECG, blood pressure, respiration, and
oxygen saturation to robustly detect seizures in newborns.
Continuous monitoring of the newborn ECG and heart
rate have been successful alternative guides in detecting
seizures [10]. In [11], the authors investigated rhythmic
changes in ECG and heart rate to alert the physicians to the
presence of seizures in 9 paralyzed infants. In addition, the
authors in [6] reported t hat heart rate changes are an ex-
tremely common feature of complex partial seizures. Seizures
can cause extreme alteration to autonomic activit y. ECG and
variation in ECG characteristics are primarily under control
of the autonomic nervous system (ANS), providing sensitive
and noninvasive means of detecting alterations in autonomic
activity. Early investigations by neurologists on animal mod-
els [7], adults [6–9], and children [12] suggest that paroxys-
mal changes in ECG, including heart rate, alteration in the
RR and QT intervals, are attributed to clinical seizure activ-
ity. The conclusions proposed by neurologists are case studies
based on the continuous monitoring of the behavior of ECG
and EEG channels simultaneously. The precise relationship
between these changes and seizures has not been specifical ly
determined.
The HRV is emerging as a major noninvasive tool in
monitoring the state of the ANS [13]. The ANS has sympa-
thetic and parasympathetic components. The separate rhyth-
mic contributions from sympathetic and parasympathetic
autonomic activities modulate the heart rate, and thus the
RR intervals of the QRS complex in the ECG at distinct
2 EURASIP Journal on Advances in Signal Processing
frequencies. Sympathetic activity in newborn is associated
with the low-frequency (LF) range (0.03–0.15 Hz) while par-
asympathetic activity is associated with the higher-frequency
(HF) range (0.15–0.6 Hz) of the heart rate. The mid-freque-
ncy (MF), centered near 0.1 Hz, is both parasympathetically
and sympathetically mediated. The HF corresponds to the
respiratory and the LF is mediated by a variety of different
influences [14].
TheHRVcharacteristicshavebeeninvestigatedwithdif-
ferent algorithms based on either time or frequency domains.
The main difficulty encountered in frequency-domain pro-
cessing is the nonstationary behavior of heart beats. Even for
a normal healthy person, the heart beats tend to be time-
variant. This is because the interbeat interval of the heart
rhythm varies markedly due to irregularities in the initiation
of the cardiac impulse in the at rium. These nonstationar ities
become more severe in abnormal cardiac rhythms. TF meth-
ods have been introduced to specifically deal with such sig-
nals. They are able to provide localized time and frequency
descriptions of HRV necessary to characterize such changing
autonomic regulation [15].
In this paper, we used the first and second conditional
moments of TFD of the HRV in the three frequency bands
(LF, MF, and HF) to identify the changes in HRV during
seizures. The first conditional moment corresponds to the
mean or central frequency of the respective spectrum of in-
terest at a particular time obtained from the TFD while the
second conditional moment corresponds to the variance.
The purpose of studying these variables is to accurately de-
termine the effect of the seizure on the frequency location of
HRV components (LF, MF, and HF) in TF plane. This may
in turn allow a clear separation between seizure and non-
seizure events.
To realize this, a high-resolution and reduced-interfe-
rence TFD is needed to clearly separate between the different
components in HRV. In [16], it was reported that the TFD
conditional moments are able to improve the performance of
classification of nonstationary time series compared to those
moments based on time or frequency alone.
2. TIME-FREQUENCY DISTRIBUTIONS
The Fourier transform (FT) is well suited for the analysis of
stationary signals. It gives a representation of the frequency
components of the signal but does not allow any localization
in time. Since most real-life signals are nonstationary (i.e.,
their frequency content varies with time), a more global anal-
ysis method that represents this type of signals in both time
and frequency domain simultaneously is needed.
One of the earliest used time-frequency signal represen-
tation is the spectrogram (SP) (defined as the squared magni-
tude of the shor t-time Fourier transform (STFT)). The main
drawback of the SP is the existence of a tradeoff between time
and frequency resolutions. In order to increase the frequency
resolution, a long window is required. This choice, however,
results in a poor time resolution and also invalidates the as-
sumption of local stationarity. To overcome this limitation,
several TFDs have been proposed. One commonly used class
Table 1: TFDs and their corresponding kernels.
TFDs Kernel G(t, τ)
SPWVD h
2
(τ/2)g(t); h(τ)andg(t) are window functions
SP
w(t + τ/2)w(t − τ/2); w(t) is an analysis window
function
CWD
√
πσ/|τ|e
−π
2
σt
2
/τ
2
MBD cosh
−2β
(t)
cosh
−2β
(σ)dσ
of TFDs, of which the spectrogram is a member, is the class
of the quadr a tic shift invariant time-frequency distributions
(TFDs) [17].Foragivenreal-valuedsignalx(t), these distri-
butions can be parameterized by means of a time-lag kernel
G(t, τ) according to the formula
ρ
z
(t, f ) =
G(t − u, τ)z
u +
τ
2
z
u −
τ
2
e
−j2πfτ
dudτ,
(1)
where
z stands for the complex conjugate of z, the analytic
associate of x(t)[17]. The time-lag kernel G(t, τ) determines
the characteristics of TFDs and how the signal energy is dis-
tributed in the TF plane. Unless otherwise specified, the inte-
gration limits are
−∞ and +∞. The TFDs used in our inves-
tigation are the smoothed pseudo-Wigner-Ville distribution
(SPWVD), the spectrogram (SP), the Choi-Williams distri-
bution (CWD), and the modified B-distribution (MBD) dis-
tributions. The first three are widely used TFDs. The last
one is a recent addition to the quadratic class of TFDs that
showed promising results in achieving high TF resolution
and significant cross-term reduction [17]. Ta ble 1 shows the
TFDs used along with the corresponding kernels [17].
The Wigner-Ville distribution (WVD) with the kernel
equal to 1 provides a high-resolution representation of the
signal x(t) in time and frequency [17]. The main drawback
with the WVD is the presence of cross-terms if the signal is
multicomponent such as the HRV. This could be reduced
by time and frequency averaging such as in the SPWVD
[17]. The SPWVD has separable kernel, where the window
g(t) is the smoothing window and the h(τ) is the analysis
window. The g(t)andh(τ) are chosen to suppress spurious
peaks and to obtain a high TF resolution. The suppression
of cross-term is better with a longer window. This, however,
results in the undesirable smearing of instantaneous charac-
teristics. The commonly used functions for g(t)andh(τ)are
the unit rectangular function and the Gaussian window, re-
spectively [18]. The MBD has a lag independent kernel which
means that the filtering is only performed in the time direc-
tions [17]. β is a real parameter between 0 and 1 that de-
fines the sharpness of the cutoff between cross-terms and
autoterms present in the TFD. MBD has been found to be
highly suitable for this type of signals, that is, HRV which is
multicomponent, and their frequency content varies slowly
with time [19]. The CWD has a real parameter σ which al-
lows one to select the amount of filtering in the TF domain
[17].
M. B. Malarvili et al. 3
010203040506070
150
151
152
153
154
155
156
157
Time (s)
IHR (BPM)
(a)
0 10203040506070
138
139
140
141
142
143
144
Time (s)
IHR (BPM)
(b)
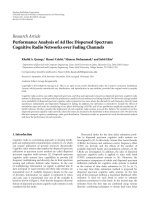
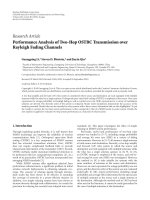
Figure 1: The HRV related to (a) nonseizure EEG and (b) seizure EEG.
The nth conditional moment of the TFD at time t is de-
fined as
f
n
(t) =
1
P(t)
f
n
ρ
z
(t, f )df ,(2)
where
P(t)
=
ρ
z
(t, f )df . (3)
The first conditional moment corresponds to the mean or
central frequency and the second conditional moment cor-
responds to the variance. The central/mean frequency f
c
(t)
and variance var(t)aredefinedas
f
c
(t) =
1
P(t)
fρ
z
(t, f )df ,(4)
var(t)
=
1
P(t)
f − f
c
(t)
2
ρ
z
(t, f )df . (5)
3. METHODS
The following subsections explain the methods involved in
this study.
3.1. Data acquisition
The one-channel newborn ECG was recorded simultane-
ously along with 20 channels of EEG. The EEG was labeled as
either seizure or nonseizure by a neurologist from the Royal
Children’s Hospital, Brisbane, Australia. In the present study,
we analyzed 6 seizure events and 4 nonseizure events of 64
seconds each from 5 different newb orns. The ECG was sam-
pled at 256 Hz.
3.2. Preprocessing of ECG for HRV quantification
The ECG signal is preprocessed to extract the HRV using the
following two steps.
QRS detection
A QRS detection algorithm is used to extract the R points of
the ECG. This is the most sensitive parameter in obtaining
accurate RR intervals. Conventional time-domain methods,
like the ones used in [8, 20], are based on differentiation to
enhance the peaks in the ECG signal and rule-based thresh-
olding to identify the R points. However, as reported in [21],
these methods lead to inaccuracies in the identification and
detection of ECG parameters and in certain cases completely
miss the QRS waves. In this paper, we used the smoothed
nonlinear energy operator (SNEO) to extract the R point
which is treated here as a spike in ECG signal. The SNEO
has been proposed in [22, 23] for the detection of spikes in
signals. SNEO is a smoothed version of the nonlinear energy
operator (NEO). NEO also is known as the energy-tracking
operator. Only three samples are required for energy compu-
tation at each time instant. This gives a good time resolution
in capturing the energy fluctuations instantaneously.
HRV computation
The time series of RR interval is called tachogram. Errors in
peak detection are corrected based on timing analysis rather
than amplitude analysis. Missing beats were estimated and
inserted and extra beats were removed based on timing in-
formation. The unevenly sampled RR intervals were interpo-
lated using cubic splines. The instantaneous heart rate (IHR)
is the inverse of the RR interval and shows the variability of
heart rate. Figure 1 shows examples of IHR coinciding with
the nonseizure and seizure EEG from the same newborn. An
4 EURASIP Journal on Advances in Signal Processing
0.05 0.10.15 0.20.25 0.30.35 0.40.45 0.5
Frequency (Hz)
10
20
30
40
50
60
Time (s)
20−2
Time
signal
LF
MF
HF
500
1500
PSD
(a) Smoothed pseudo-Wigner-ville
0.05 0.10.15 0.20.25 0.30.35 0.40.45 0.5
Frequency (Hz)
10
20
30
40
50
60
Time (s)
20−2
Time
signal
500
1500
PSD
(b) Spectogram
0.05 0.10.15 0.20.25 0.30.35 0.40.45 0.5
Frequency (Hz)
10
20
30
40
50
60
Time (s)
20−2
Time
signal
Horizontal lines
500
1500
PSD
(c) Choi and William
0.05 0.10.15 0.20.25 0.30.35 0.40.45 0.5
Frequency (Hz)
10
20
30
40
50
60
Time (s)
20−2
Time
signal
LF
MF
HF
500
1500
PSD
(d) Modified B-distribution
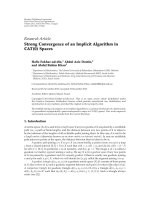
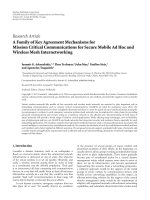
Figure 2: TFD for HRV related to nonseizure: (a) SPWVD; (b) SP; (c) CWD and (d) MBD.
antialiasing filter with a cutoff at 1 Hz was used to filter, and
the filtered signals were sampled at a sampling rate of 2 Hz.
Finally, the linear trend of the time series was removed. The
outcome of the preprocessing stage constitutes the HRV used
in the analysis.
3.3. Selection of the optimal TFD to represent HRV
The TF analysis was restricted to the SPWVD, the SP, the
CWD, and the MBD. Because of the space limitation, we
present and discuss the performance analysis using only two
signals (1 nonseizure and 1 seizure) out of the 10 events stud-
ied. These can be considered as representatives of the general
characteristics observed. The TFDs of HRV for both the non-
seizure and seizure signals in Figure 1 are shown in Figures 2
and 3,respectively.
All the plots shown were obtained using the same plot
routine: the left plot represents time series of HRV and the
center figure shows the joint TFD. The sequence of plots la-
beled with (a), (b), (c), and (d) corresponds to the TFDs of
the SPWVD, SP, CWD, and MBD, respectively. For clarity of
illustration, the relevant frequency bands are labeled with LF,
MF, HF only on Figures 2(d),and3(d). Because the relative
position of those frequencies prevails in all the sequence of
figures, the arrows are indicated in Figure 2 only.
The optimal parameters for SPWVD, SP, CW, and MBD
are the ones that achieve the best compromise between the
TF resolution and the cross-terms suppression. The parame-
ters were selected by comparing the TF plots of the signal vi-
sually for different values of parameters. For SPWV, h(τ)was
chosen as a Gaussian window of 121 samples and g(t)asrect-
angular window of 63 samples. In Figure 2(a), the dominant
frequency content can be observed in the LF, MF, and HF.
The frequency resolution is fairly satisfactory and its cross-
terms free. This result is consistent with the findings in [18].
For SP, a Hamming window with length of 111 was used.
In Figure 2(b), better defined frequency components can be
observed in the MF and HF. However, the SP lacks in time
resolution which makes the TF components smeared. The
SP smoothes away all interference terms except those occur-
ring when two signal components overlap. As mentioned in
Section 1, this smoothing has the side effect of reducing sig-
nal components resolution. The SP poorly represents rapidly
changing spectral characteristics and cannot optimally re-
solve closely spaced components. For CWD, the optimal pa-
rameter σ of its kernel was found to be 0.4. It can be seen that
M. B. Malarvili et al. 5
0.05 0.10.15 0.20.25 0.30.35 0.40.45 0.5
Frequency (Hz)
10
20
30
40
50
60
Time (s)
1.50− 1
Time
signal
200
600
PSD
(a) Smoothed pseudo-Wigner-ville
0.05 0.10.15 0.20.25 0.30.35 0.40.45 0.5
Frequency (Hz)
10
20
30
40
50
60
Time (s)
1.50− 1
Time
signal
200
600
PSD
(b) Spectogram
0.05 0.10.15 0.20.25 0.30.35 0.40.45 0.5
Frequency (Hz)
10
20
30
40
50
60
Time (s)
1.50− 1
Time
signal
200
600
PSD
Horizontal lines
(c) Choi and William
0.05 0.10.15 0.20.25 0.30.35 0.40.45 0.5
Frequency (Hz)
10
20
30
40
50
60
Time (s)
1.50− 1
Time
signal
200
600
PSD
LF
MF
HF
(d) Modified B-distribution
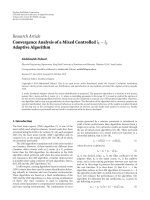
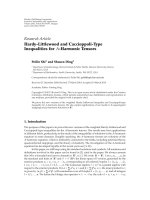
Figure 3: TFD for HRV related to seizure: (a) SPWVD; (b) SP; (c) CWD; and (d) MBD.
it is almost cross-terms free but the horizontal lines prevail,
which makes the TF components smeared. This is due to the
trade-off between suppression of the cross-terms and the res-
olution of autoterms. This makes the component in LF and
MF smeared.
For MBD, the parameter β was set to 0.01. We can see
that its cross-terms are free and have better TF resolution
compared to SP and CWD. This improvement facilitates the
identification/interpretation of the frequency components of
the HRV in nonseizure neonatal. The dominant frequency
content can be observed in the LF, MF, and HF band. The
MBD also gives a good estimation of the instantaneous fre-
quency (IF) law of each component which varies slowly with
time. This is consistent with the findings in [19]. The MBD
has high TF resolution and is effective in cross-terms reduc-
tion.
Results of the TFD analysis of the HRV for seizure baby
are presented in Figure 3. Similar patterns are observed re-
garding the TF resolution and suppression of cross-term in-
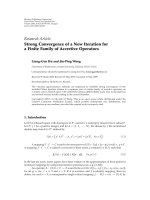
terference, as in the case of nonseizure HRV. To better ap-
preciate the performance of the MBD, we compare the fre-
quency resolution using a time slice of TFDs, taken at specific
time, t. For each TFD for the nonseizure case, a normalized
slice at time interval t
= 23 seconds is taken and displayed
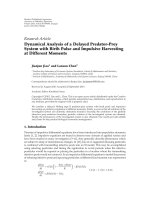
in Figure 4. T his figure shows the nor malized slices of TFDs
plotted in Figure 2 .
From Figure 4(a), the SPWVD shows almost similar per-
formance as the MBD in cross-terms suppression but MBD
performs better in preserving the energy concentration for
each component and has better TF resolution. The SP too
fails to preserve the energy concentration for each compo-
nent and has poorer TF resolution compared to MBD. Mean-
while, the CWD failed to exhibit a good suppression of any
undesirable artifac ts for each of the components. Thus, the
MBD is found to realize the best compromise for the class of
signals considered; it is almost cross-terms free and has high
components’ resolution in the TF plane. So for this, the MBD
will be used in the remaining part of the study.
3.4. TF feature extraction of HRV
The parameters derived from the first and second condi-
tional moments of TFD of the HRV signal in each one of
the 3 bands will be used as features in discriminating the
seizure from the nonseizure. The first conditional moment
corresponds to the mean or central frequency f
c
(t) of the
6 EURASIP Journal on Advances in Signal Processing
0.05 0.10.15 0.20.25 0.30.35 0.40.45 0.5
Frequency (Hz)
0
0.2
0.4
0.6
0.8
1
Normalized amplitude
(a)
0.05 0.10.15 0.20.25 0.30.35 0.40.45 0.5
Frequency (Hz)
0
0.1
0.2
0.3
0.4
0.5
0.6
0.7
0.8
0.9
1
Normalized amplitude
(b)
0.05 0.10.15 0.20.25 0.30.35 0.40.45 0.5
Frequency (Hz)
0
0.1
0.2
0.3
0.4
0.5
0.6
0.7
0.8
0.9
1
Normalized amplitude
(c)
Figure 4: Normalized slices (dashed) of (a) SPWVD; (b) SP; and
(c) CWD. All plots are compared against the MBD (solid).
respective spectr um of interest at a particular time and the
parameter from second conditional moment corresponds to
the variance var(t). It is worth mentioning that the f
c
(t)and
var(t) represent, respectively, the instantaneous frequency
(IF) and the instantaneous bandwidth (IB) for the case of
TFDs whose kernel satisfies the IF property [20]. Unfortu-
nately, this is not the case for MBD. Hence, the notions of IF
andIBarenotusedhere.
The feature extraction procedure includes the following
steps.
(1) Bandpass filtering: FIR bandpass filters are used to
isolate the three frequency bands mentioned above;
namely LF (0.03–0.07 Hz), MF (0.07–0.15 Hz), and HF
(0.15–0.6 Hz). This results in three filtered signals.
(2) TF mapping: the three filtered signals are mapped us-
ing MBD. This step results in three TFDs.
(3) Moment estimation: the f
c
(t) and the var(t)arecom-
puted for each signal. The f
c
(t) and the var(t) related
to LF, MF, and HF are shown in Figures 5 and 6 respec-
tively.
From these figures, it can be seen that for the case of
seizure, the central frequency f
c
(t) related to LF, MF, and HF
occur at frequency higher than the ones appearing in non-
seizure. It is the same case for the variance. These facts will
be exploited in our seizure detection using HRV.
4. PERFORMANCE EVALUATION AND DISCUSSION
Based on the results of the previous section, we will use
f
c
(t)andvar(t) related to the three frequency bands LF, MF,
and HF as features to differentiate between seizure and non-
seizure. Because not enough data is available at this stage,
we opt for the leave-one-out cross-validation method [24].
Given a dataset of size N, this method simply consists of split-
ting the dataset in a set of N
− 1 training data and one test
data. So, for 9 events (seizure and nonseizure) at a time, the
f
c
(t) values for seizure were compared with those from non-
seizure, and a threshold was chosen that best differentiated
the two groups. The threshold is determined using the Gaus-
sian distribution since the values of f
c
(t) were shown to obey
the Gaussian distribution when tested for normality [25].
Figures 7 and 8 show how the threshold is obtained. The one
f
c
(t) which was not included in the training group of 9 was
then compared with the obtained threshold and the classifi-
cation results are noted. The procedure was applied 10 times
for both f
c
(t)andvar(t) related to the three frequency bands.
From Figures 7 and 8, for the case shown in Figures 5 and
6, the optimal threshold was found to be 0.0455 Hz (for LF)
and 0.003 Hz
2
(for HF), respectively. The threshold selected
is different for the different tests (newborn-dependent). The
results of the different tests were used to calculate the sensi-
tivity R
sn
and specificity R
sp
.
The sensitivity R
sn
and specificity R
sp
are defined as
R
sn
=
TP
TP + FN
; R
sp
=
TN
TN + FP
,(6)
where TP, TN, FN, and FP, respectively represent the num-
bers of true positive, true negative, false negative, and false
positive. The R
sn
is the proportion of seizure events correctly
recognized by the test (the seizure detection rate) while R
sp
is the proportion of nonseizure events correctly recognized
M. B. Malarvili et al. 7
10 20 30 40 50 60
Time (s)
0.038
0.04
0.042
0.044
0.046
0.048
0.05
0.052
0.054
f (Hz)
Non-seizure
Threshold
Seizure
Central frequency: LF
(a)
10 20 30 40 50 60
Time (s)
0.105
0.11
0.115
0.12
0.125
0.13
0.135
0.14
0.145
f (Hz)
Non-seizure
Seizure
Central frequency: MF
(b)
10 20 30 40 50 60
Time (s)
0.316
0.318
0.32
0.322
0.324
0.326
0.328
0.33
0.332
0.334
f (Hz)
Non-seizure
Seizure
Central frequency: HF
(c)
Figure 5: The central frequency of the LF, MF, and HF of the HRV.
10 20 30 40 50 60
Time (s)
1
1.2
1.4
1.6
1.8
2
2.2
2.4
×10
−4
f
2
(Hz
2
)
Non-seizure
Seizure
Variance: L F
(a)
10 20 30 40 50 60
Time (s)
0.007
0.008
0.009
0.01
0.011
0.012
0.013
f
2
(Hz
2
)
Non-seizure
Seizure
Variance: M F
(b)
0 10203040506070
Time (s)
1.5
2
2.5
3
3.5
4
4.5
5
×10
−3
f
2
(Hz
2
)
Non-seizure
Seizure
Threshold
= 0.0029
Variance: HF
(c)
Figure 6: The variance of the LF, MF, and HF of the HRV.
8 EURASIP Journal on Advances in Signal Processing
0.036 0.038 0.04 0.042 0.044 0.046 0.048 0.05 0.052
f (Hz)
0
50
100
150
200
250
300
350
400
Distribution
Non-seizure
Seizure
Threshold
= 0.0455 Hz
Figure 7: The Gaussian distribution to determine threshold for
central/mean frequency in LF.
11.522.533.544.555.5
f
2
(Hz
2
)
0
500
1000
1500
Distribution
Non-seizure
Seizure
Threshold
= 0.003
Figure 8: The Gaussian distribution to determine threshold for
variance in HF.
by the test (the non-seizure detection rate). Tabl e 2 shows
the results using f
c
(t) while Tabl e 3 shows the results using
var(t).
From Ta ble 2, it can be seen that the seizures can best
be discriminated from the nonseizure using f
c
(t) in the LF
band (83.33% of sensitivity and 100% of specificity). The op-
timal averaged threshold was found to be 0.0453 Hz. These
results tend to indicate that the newborn seizure manifest it-
self in the LF component ( sympathetic activity) of the HRV
the most. The MF component was more affected than HF
because it is both parasympathetically and sympathetically
mediated. f
c
(t) from the HF band shows very poor perfor-
mance. This tends to indicate that the seizures have the least
effect in the parasympathetic ac tivity.
For the var(t), as can be seen in Tabl e 3 , the nonseizure
can be discriminated clearly from the seizure in the HF band
(83.33% of sensitivity and 100% of specificity). The optimal
averaged threshold found was 0.0026 Hz
2
. These results show
Table 2: Results for the central/mean frequency.
Frequency band R
sn
R
sp
LF 83.33% 100.00%
MF
83.33% 66.67%
HF
50.00% 16.67%
Table 3: Results for the variance.
Frequency band R
sn
R
sp
LF 66.67% 66.67%
MF
83.33% 66.67%
HF
83.33% 100.00%
that var(t) related to the HF has been affected greatly dur-
ing seizure compared to those from the LF and MF. The HF
band is mediated by the respiration rate. So, these results in-
dicate that the newborn with seizure tends to have higher
respiration variation compared to the nonseizure ones. It is
worth noting while the f
c
(t) in the HF is less affected by
seizure, the spread of the frequency in this band shows sig-
nificant difference between them. var(t) obtained from the
LF and MF bands did not show considerable changes. Thus,
those features do not seem to be good discriminating fea-
tures. Based on the results obtained so far, it can be seen that
only the two extreme values of both f
c
(t)andvar(t), namely
the maximum and minimum, are needed to distinguish be-
tween seizure and nonseizure. This means that the automatic
classifier is computationally very efficient.
5. CONCLUSIONS
Our aim in this paper was to show that, beside EEG, other
physiological signals such as ECG could be used as addi-
tional factors in the process of newborn seizure detection.
Our long-term goal is to combine features extracted from the
different physiological signals to realize accurate and robust
automatic seizure detection method. The results so far ob-
tained using HRV show that the first- and second-order TFD
moments are potentially good features in the discrimina-
tion between seizure and nonseizure. Currently, other time-
frequency-based features such as IF are being tested to as-
sess their performance. The identified discriminating fea-
tures will also be tested using a much larger database once
this becomes available later.
ACKNOWLEDGMENTS
The authors wish to thank Professor Paul Colditz from the
Royal Women’s Hospital in Brisbane, Australia for providing
access to the Perinatal Research Centre; and Dr. Chris Burke
and Ms. Jane Richmond from the Royal Children’s Hospi-
tal in Brisbane, Australia for their assistance for the label-
ing and interpretation of the EEG data used in this study.
M. B. Malarvili et al. 9
This study is partly supported under of a project funded by
the Australian Research Council’s Discovery funding scheme
(DP0665697).
REFERENCES
[1] J. M. Rennie, “Neonatal seizures,” European Journal of Pedi-
atrics, vol. 156, no. 2, pp. 83–87, 1997.
[2]A.Liu,J.S.Hahn,G.P.Heldt,andR.W.Coen,“Detection
of neonatal seizures through computerized EEG analysis,”
Electroencephalography and Clinical Neurophysiology, vol. 82,
no. 1, pp. 30–37, 1992.
[3] J. Gotman, D. Flanagan, B. Rosenblatt, A. Bye, and E . M.
Mizrahi, “Evaluation of an automatic seizure detection meth-
od for the newborn EEG,” Electroencephalography and Clinical
Neurophysiology, vol. 103, no. 3, pp. 363–369, 1997.
[4] B. Boashash and M. Mesbah, “A time-frequency approach for
newborn seizure detection,” IEEE Engineering in Medicine and
Biology Magazine, vol. 20, no. 5, pp. 54–64, 2001.
[5] S. Faul, G. Boylan, S. Connolly, L. Marnane, and G. Lightbody,
“An evaluation of automated neonatal seizure detection meth-
ods,” Clinical Neurophysiology, vol. 116, no. 7, pp. 1533–1541,
2005.
[6] S. R. Quint, J. A. Messenheimer, M. B. Tennison, and H. T.
Nagle, “Assessing autonomic activity from the EKG related to
seizure onset detection and localization,” in Proceedings of the
2nd Annual IEEE Symposium on Computer-Based Medical Sys-
tems, pp. 2–9, Minneapolis, Minn, USA, June 1989.
[7] S. J. Tavernor, S. W. Brown, R. M. Tavernor, and C. Gifford,
“Electrocardiograph QT lengthening associated with epilepti-
form EEG discharges—a role in sudden unexplained death in
epilepsy?” Seizure, vol. 5, no. 1, pp. 79–83, 1996.
[8] F. Leutmezer, C. Schernthaner, S. Lurger, K. P
¨
otzelberger, and
C. Baumgartner, “Electrocardiographic changes at the onset of
epileptic seizures,” Epilepsia, vol. 44, no. 3, pp. 348–354, 2003.
[9] M. Zijlmans, D. Flanagan, and J. Gotman, “Heart rate changes
and ECG abnormalities during epileptic seizures: prevalence
and definition of an objective clinical sign,” Epilepsia, vol. 43,
no. 8, pp. 847–854, 2002.
[10] P. Tinuper, F. Bisulli, A. Cerullo, et al., “Ictal bradycardia
in partial epileptic seizures: autonomic investigation in three
cases and literature review,” Brain, vol. 124, no. 12, pp. 2361–
2371, 2001.
[11] R. N. Goldberg, S. L. Goldman, R. E. Ramsay, and R. Feller,
“Detection of seizure activity in the paralyzed neonate using
continuous monitoring,” Pe diatrics, vol. 69, no. 5, pp. 583–
586, 1982.
[12] M. E. O’Regan and J. K. Brown, “Abnormalities in cardiac and
respiratory function observed during seizures in childhood,”
Developmental Medicine and Child Neurology,vol.47,no.1,
pp. 4–9, 2005.
[13] M. V. Kamath, T. Bentley, R. Spaziani, et al., “Time-frequency
analysis of heart rate variability signals in patients with au-
tonomic dysfunction,” in Proceedings of the IEEE-SP Interna-
tional Symposium on Time-Frequency and Time-Scale Analysis,
pp. 373–376, Paris, France, June 1996.
[14] J. P. Finley and S. T. Nugent, “Heart rate variability in infants,
children and young adults,” Journal of the Autonomic Nervous
System, vol. 51, no. 2, pp. 103–108, 1995.
[15] R. M. S. S. Abeysekera, Time-frequency domain features of elec-
trocardiographic signals: an interpretation and their applica-
tion in computer aided diagnosis, Ph.D. thesis, University of
Queensland, Brisbane, Australia, 1989.
[16] B. Tacer and P. J. Loug hlin, “Non-stationary signal classifica-
tion using the joint moments of time-frequency distributions,”
Pattern Recognition, vol. 31, no. 11, pp. 1635–1641, 1998.
[17] B. Boashash, Time Frequency Signal Analysis and Processing: A
Comprehensive Reference, Elsevier, Oxford, UK, 2003.
[18] P. Novak and V. Novak, “Time/frequency mapping of the heart
rate, blood pressure and respiratory signals,” Medical and Bio-
logical Engineering and Computing, vol. 31, no. 2, pp. 103–110,
1993.
[19] L. Rankine, M. Mesbah, and B. Boashash, “Resolution analysis
of the T-class time-frequency distributions,” in Proceedings of
the International Symposium on Signal Processing and Its Appli-
cations (ISSPA ’07), Sharjah, United Arab Emirates, February
2007.
[20] B. Boashash, “Time-Frequency Signal Analysis,” in Ad vances
in Spectrum Estimation and Array Processing, S. Haykin, Ed.,
chapter 9, pp. 418–517, Prentice-Hall, Englewood Cliffs, NJ,
USA, 1990.
[21] T. Srikanth, S. A. Napper, and H. Gu, “Bottom-up approach
to uniform feature extraction in time and frequency domains
for single lead ECG signal,” International Journal of BioElectro-
magnetism, vol. 4, no. 1, 2002.
[22] S. Mukhopadhyay and G. C. Ray, “A new interpretation of
nonlinear energy operator and its efficacy in spike detection,”
IEEE Transactions on Biomedical Engineering,vol.45,no.2,pp.
180–187, 1998.
[23] H. Hassanpour and M. Mesbah, “Neonatal EEG seizure detec-
tion using spike signatures in the time-frequency domain,” in
Proceedings of the 7th International Symposium on Signal Pro-
cessing and Its Applications (ISSPA ’03), vol. 2, pp. 41–44, Paris,
France, July 2003.
[24] S. Theodoridis and K. Koutroumbas, Pattern Recognition,Aca-
demic Press, San Diego, Calif, USA, 2006.
[25] H. L. Macgillivray, Data Analysis: Introductory Methods in
Context, Queensland University of Technology, Brisbane, Aus-
tralia, 2004.
M. B. Malarvili received both the B.Eng
and M.Eng degrees in electrical engineer-
ing from Universiti Teknologi of Malaysia
at Skudai, Johor, Malaysia, in 2001 and
2004, respectively. She is currently doing
her Ph.D. degree in biomedical signal pro-
cessing at the Perinatal Research Centre
(PRC), The University of Queensland in
Brisbane, Australia. Her research interests
include biomedical signal processing, pat-
tern recognition, and time-frequency signal analysis.
Mostefa Mesbah received his M.S. and
Ph.D. degrees in electrical engineering from
University of Colorado at Boulder, Colo,
USA, in the area of automatic control sys-
tems. He is currently a Research Fellow
at the Perinatal Research Centre (PRC),
The University of Queensland in Brisbane,
Australia, leading biomedical engineering
projects that deal with the automatic de-
tection and classification of newborn EEG
seizures. His research interests include biomedical signal process-
ing, time-frequency signal processing, signal detection and classifi-
cation, 3D shape reconstruction from image sequences, and intel-
ligent control systems.
10 EURASIP Journal on Advances in Signal Processing
Boualem Boashash obtained a Diplome
d’Ingenieur-Physique-Electronique from
Institut de Chimie et de Physique Indus-
trielles de Lyon (ICPI), University of Lyon,
France, in 1978, the M.S. and Doctorate
(Docteur-Ingenieur) degrees from the In-
stitute National Polytechnique de Grenoble,
France, in 1979 and 1982, respectively. In
1979, he joined Elf-Aquitaine Geophysical
Research Centre, Pau, France. In May
1982, he joined the Institut National des Sciences Appliquees
de Lyon, France. In 1984, he joined the Electrical Engineering
Department, University of Queensland, Australia, as a Lecturer.
In 1990, he joined Graduate School of Science and Technology,
Bond University, as a Professor of electronics. In 1991, he joined
Queensland University of Technology as the Foundation Professor
of signal processing and Director of the Signal Processing Research
Centre. In 2006, he joined the Perinatal Research Centre (PRC),
The University of Queensland in Brisbane, Australia, as a Research
Fellow and also as the Dean of the College of Engineering in Uni-
versity of Sharjah, UAE. B. Boashash is the Editor of three books
and has written over four hundred technical publications. His
research interests include time-frequency signal analysis, spectral
estimation, signal detection and classification, and higher-order
spectra. Professor Boashash is a Fellow of Engineers of Australia,
Fellow of IREE, and Fellow of IEEE.