Báo cáo hóa học: "Interwell coupling effect in Si/SiGe quantum wells grown by ultra high vacuum chemical vapor deposition" docx
Bạn đang xem bản rút gọn của tài liệu. Xem và tải ngay bản đầy đủ của tài liệu tại đây (319.58 KB, 6 trang )
NANO EXPRESS
Interwell coupling effect in Si/SiGe quantum wells grown by ultra
high vacuum chemical vapor deposition
Rui Wang Æ Soon Fatt Yoon Æ Fen Lu Æ
Wei Jun Fan Æ Chong Yang Liu Æ Ter-Hoe Loh Æ
Hoai Son Nguyen Æ Balasubramanian Narayanan
Published online: 27 February 2007
Ó to the authors 2007
Abstract Si/Si
0.66
Ge
0.34
coupled quantum well
(CQW) structures with different barrier thickness of
40, 4 and 2 nm were grown on Si substrates using an
ultra high vacuum chemical vapor deposition (UHV-
CVD) system. The samples were characterized using
high resolution x-ray diffraction (HRXRD), cross-
sectional transmission electron microscopy (XTEM)
and photoluminescence (PL) spectroscopy. Blue shift
in PL peak energy due to interwell coupling was
observed in the CQWs following increase in the Si
barrier thickness. The Si/SiGe heterostructure growth
process and theoretical band structure model was val-
idated by comparing the energy of the no-phonon peak
calculated by the 6 + 2-band kÁp method with experi-
mental PL data. Close agreement between theoretical
calculations and experimental data was obtained.
Keywords Si/SiGe Á Coupled quantum well Á
UHV-CVD
Introduction
Silicon is notably the most widely used semiconductor
in the microelectronics industry. As such, the ability to
realize light emitters based on silicon is a highly
desirable goal that could lead to integrating optical and
microelectronic functions on the same silicon-based
platform. However, the indirect band characteristic of
silicon prohibits the efficient radiative recombination
of electrons and holes to result in coherent optical
emission. Currently, there are a number of efforts to
overcome this physical challenge, such as the use of Si
nanocrystals and Er coupled Si [1–3]. Apart from these
potential solutions, the quantum cascade (QC) struc-
ture is considered a promising method to realize a
Si-based coherent light emitter. This is because the
carrier transition mechanism for the QC structure is
based on intersubband transition. Hence, the indirect
band property of Si and SiGe alloy could be ignored.
Recently, intersubband photoluminescence (PL)
and electroluminescence (EL) have been demon-
strated in Si/SiGe QC structures [4–6]. Compared with
other solutions, the emission wavelength of the QC
emitter (QCE) lies at the mid- to far-infrared (also
called terahertz) region, which is currently under uti-
lized due to the lack of suitable material systems. In the
QC structure, the active region is normally formed by
the Si/SiGe superlattice layers, which comprise several
layers of SiGe quantum wells (QWs) and Si barriers. In
such a structure, interwell coupling effect plays an
essential role to determine the energy transitions and
resultant optical and electronic properties of the
Si/SiGe QC structure. In other words, the intersubband
transitions in the QC structures rely on the interwell
coupling in the QWs. This is because the wave func-
tions in the QC structures are no longer confined to a
single well, but penetrate into barriers and extend over
the entire region [7]. Therefore, the study of interwell
coupling effect in the QWs remains a critical issue for
R. Wang Á S. F. Yoon (&) Á F. Lu Á W. J. Fan Á
C. Y. Liu
School of Electrical and Electronic Engineering, Nanyang
Technological University, Nanyang Avenue, Singapore
639798, Singapore
e-mail:
T H. Loh Á H. S. Nguyen Á B. Narayanan
Institute of Microelectronics, 11 Science Park Road
Singapore Science Park II, Singapore 117685, Singapore
123
Nanoscale Res Lett (2007) 2:149–154
DOI 10.1007/s11671-007-9046-8
realizing the QCE. Luminescence from CQWs in Si/
SiGe materials grown by molecular beam epitaxy
(MBE) has been reported by Fukatsu et al. [8–10].
However, in their reports, the Ge fraction in the SiGe
QWs is less than 20%. This is not suitable for appli-
cation in the QC structures, because the resulting
valence band offset is only about 0.1 eV.
In this paper, we present a photoluminescence (PL)
study on strained Si/Si
0.66
Ge
0.34
CQWs grown by ultra
high vacuum chemical vapor deposition (UHV-CVD).
The Ge fraction in our SiGe QW samples is about
twice the Ge fraction in the samples reported by
Fukatsu et al. [8–10]. The higher Ge fraction in our
samples is expected to produce an effectively larger
valence band offset, which is more appropriate for
design of the QC structure for light emission. The
interwell coupling effect in the QC samples of different
barrier thickness was investigated. Comparison with
theoretical calculation of the energy transitions is
presented.
Experimental details
The samples used in this study were grown in a UHV-
CVD cold-wall 8-inch single-wafer epitaxy reactor.
The chamber pressure is below 10
–9
Pa. The reactant
gases used for the deposition are disilane (Si
2
H
6
) and
germane (GeH
4
). P-type (boron doped at 2.5 ·
10
15
cm
–3
) Si (100) substrates were cleaned using a
standard solution comprising 10DI:2H
2
O
2
:1NH
4
OH
(by volume), then dipped into dilute HF (DHF) solu-
tion comprising 200H
2
O:1HF for 2 min before depo-
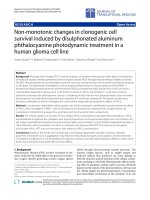
sition. Figure 1 shows the schematic diagrams of the
structures and growth conditions of the three samples
investigated in this study. A 3 nm-thick Si buffer layer
was grown at 530°C at 1 nm/min on the p-type silicon
substrate. This is followed by growth of the SiGe QWs,
Si barriers and the Si cap layer. The SiGe QWs in
sample 1 was deposited at 530°C at growth rate of
12 nm/min, while the Si barrier and cap layer were
deposited at 600°C at 10 nm/min. In samples 2 and 3,
the thin Si barriers between the two CQWs (4 nm and
2 nm, respectively) were grown under the same con-
dition as the 3 nm-thick Si buffer layer. The thick Si
barriers in sample 3 and the QWs and cap layers in
both samples 2 and 3 were grown under the same
condition as the barriers, the QWs and cap layer of
sample 1, respectively. All the layers are nominally
undoped.
Photoluminescence (PL) measurements were carried
out at 4 K by exciting the sample using the 514.5 nm
line from an Ar ion laser. The PL was detected by a
liquid nitrogen cooled Ge detector in conjunction with
a standard lock-in technique. The structural character-
istic of the samples, such as interface roughness, layer
thickness and Ge concentration were characterized
using cross-sectional transmission electron microscopy
(XTEM) and high resolution x-ray diffraction
(HRXRD).
Results and discussion
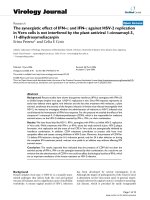
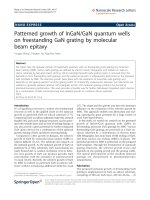
Figure 2 shows the x-ray rocking curves of samples 1–3.
The sharp peaks in the rocking curves arise from the Si
substrate. The experimental rocking curves were
compared with dynamical simulation to determine the
physical parameters of the structures. For sample 1, the
simulation was performed based on a 10-period
Si
0.66
Ge
0.34
(6nm) T
s
= 530
o
C GR = 12nm/min
Si (40nm) T
s
= 600
o
C GR = 10nm/min
Si (10nm) T
s
= 600
o
C GR = 10nm/min
Si
0.66
Ge
0.34
(6nm) T
s
= 530
o
C GR = 12nm/min
Si (3nm) T
s
= 530
o
C GR = 1nm/min
p-type Si substrate
Repeat 9 times
Si (3nm) T
s
= 530
o
C GR = 1nm/min
Si
0.66
Ge
0.34
(6nm) T
s
= 530
o
C GR = 12nm/min
Si (4nm) T
s
= 530
o
C GR = 1nm/min
Si
0.66
Ge
0.34
(6nm) T
s
= 530
o
C GR = 12nm/min
Si (10nm) T
s
= 600
o
C GR = 10nm/min
p-type Si substrate
Si
0.66
Ge
0.34
(6nm) T
s
= 530
o
C GR = 12nm/min
Si (40nm) T
s
= 600
o
C GR = 10nm/min
Si (10nm) T
s
= 600
o
C GR = 10nm/min
Si
0.66
Ge
0.34
(6nm) T
s
= 530
o
C GR = 12nm/min
Si (3nm) T
s
= 530
o
C GR = 1nm/min
p-type Si substrate
Repeat 4 times
Si (2nm) T
s
= 530
o
C GR = 1nm/min
Si
0.66
Ge
0.34
(6nm) T
s
= 530
o
C GR = 12nm/min
Si
0.66
Ge
0.34
(6nm) T
s
= 530
o
C GR = 12nm/min
Si (2nm) T
s
= 530
o
C GR = 1nm/min
Sample 1
Sample 2
Sample 3
(a)
(b)
(c)
Fig. 1 Schematic diagrams of structures and growth conditions
of samples 1, 2 and 3 used in this study. The samples are grown
by UHV-CVD. Note:T
s
and GR refers to substrate temperature
and growth rate, respectively
150 Nanoscale Res Lett (2007) 2:149–154
123
5.7 nm-thick Si
0.66
Ge
0.34
QW and 40 nm-thick Si bar-
rier stack. For sample 2, the simulation was performed
based on a 5.7 nm-thick Si
0.66
Ge
0.34
QW, 4 nm-thick Si
barrier and 5.7 nm-thick Si
0.66
Ge
0.34
QW. Finally for
sample 3, the simulation was performed based on a
5-period 5.6 nm-thick Si
0.66
Ge
0.34
QW, 2 nm-thick Si
barrier, and 5.6 nm-thick Si
0.66
Ge
0.34
QW and 40
nm-thick Si barrier stack. As shown in the figure, the
experimental XRD data of the samples are well
reproduced by the dynamical simulation. However,
compared with the simulated curves, certain satellite
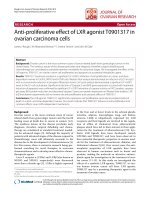
peaks are missing in the experimental results. This is
due to the imperfect interfaces between the QWs and
barriers, which are confirmed by XTEM examination
of the samples as shown in Fig. 3. The dark regions
correspond to the SiGe QWs, while the relatively
bright regions correspond to the Si barriers. The
XTEM micrographs show that the high degree of strain
(up to 1.5%) between the QWs and barriers gave rise
to substantial thickness variations (the roughness is
about 7 A
˚
) in the QWs and barriers.
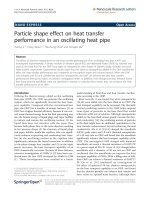
The thickness variations in the QWs and barriers
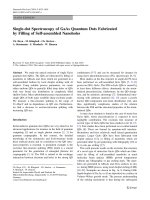
result in the relatively weak and broad PL spectra of the
SiGe QWs observed in samples 1–3, as shown in Fig. 4.
In the figure, NP, TA and TO refers to no-phonon,
transverse-acoustic phonon-assisted and transverse-
optical phonon-assisted transitions, respectively [11].
The full- width at half maximum (FWHM) of the PL
signal of sample 1 is about 40 meV (as marked in
Fig. 4). The contribution to the FWHM of this signal by
interface roughness (DL) could be estimated by the
following equations [12, 13]:
DE=
dE
1e
dL
+
dE
1hh
dL
DL ð1Þ
where L is the QW width and E
1e
and E
1hh
are the
energy values of the first energy state in the conduction
and valence bands. m
B
e
,m
W
e
,m
B
hh
and m
W
hh
are the
effective mass of the electron and heavy hole in the QW
(W) and barrier (B), and DE
c
and DE
v
are the band
offsets of the conduction and valence bands, respec-
tively. Hence, out of the total FWHM of 40 meV,
13.1 meV is contributed by the interface roughness
between the QW and barrier layers. The large differ-
ence of ~27 meV between the estimated and measured
FWHM values could be due to the presence of interface
defects, which are caused by the partial strain relaxa-
tion due to lattice mismatch at the interface.
In Fig. 4, the PL peaks shift to lower energy fol-
lowing decrease in the barrier thickness. This is due to
the effect of interwell coupling between the two sym-
metrically-aligned wells caused by the wavefunction
penetration across the Si barrier. When two quantum
wells are brought close enough, such as the case of
samples 2 and 3, the energy states in both the con-
duction and valence bands are split into symmetric (S)
and anti-symmetric (A) states due to the coupling
effect (as shown in the inset of Fig. 4). In the valence
band, both the heavy hole (HH) and light hole (LH)
states are split. However, the energy of the HH S-state
is higher than that of the LH S-state (the difference is
about 60 meV in our calculation). Hence, the observed
luminescence should be attributed to the optical tran-
sition between the S-states of electrons and the HH
states in the valence band. The energy of HH S-state is
higher than that of the HH state before split (the
difference is about 15 meV in our calculation).
Therefore the NP transition energy reduces in the
presence of coupling effect. This explains the obser-
vation that red shift of the PL peak energy follows a
reduction in barrier thickness. Note that the band
energy changes in the conduction band could be
ignored, because the band offsets in the conduction
bands in our samples are very small.
In sample 1, since the thickness of the Si barrier is
40 nm, the QWs in this sample should be effectively
isolated from each other. This being the case, it should
have similar characteristic as a single QW (SQW) with
dE
1e
dL
=
E
1e
L
2
þ
"h
ffiffiffiffiffiffiffiffiffiffiffiffiffiffiffiffiffiffiffiffiffiffiffiffiffiffiffiffiffiffiffi
2m
B
e
DE
c
ÀE
1e
ðÞ
q
cos
2
L
2
ffiffiffiffiffiffiffiffiffiffiffiffiffiffiffiffi
2m
W
e
E
1e
"h
2
r
!
þ
"h
ffiffiffiffiffiffiffiffiffiffiffiffiffiffiffiffi
8m
W
e
E
1e
p
sin L
ffiffiffiffiffiffiffiffiffiffiffiffiffiffiffiffi
2m
W
e
E
1e
"h
2
r
!
ð2Þ
dE
1hh
dL
¼
E
1hh
L
2
þ
"h
ffiffiffiffiffiffiffiffiffiffiffiffiffiffiffiffiffiffiffiffiffiffiffiffiffiffiffiffiffiffiffiffiffi
2m
B
hh
DE
v
ÀE
1hh
ðÞ
q
cos
2
L
2
ffiffiffiffiffiffiffiffiffiffiffiffiffiffiffiffiffi
2m
W
hh
E
1hh
"h
2
r
!
þ
"h
ffiffiffiffiffiffiffiffiffiffiffiffiffiffiffiffiffi
8m
W
hh
E
1hh
p
sin L
ffiffiffiffiffiffiffiffiffiffiffiffiffiffiffiffiffi
2m
W
hh
E
1hh
"h
2
r
!
ð3Þ
Nanoscale Res Lett (2007) 2:149–154 151
123
the same QW width and Ge composition. The band
structure of a strained Si
0.66
Ge
0.34
SQW grown on Si
substrate is shown in Fig. 5. For a strained Si
1–x
Ge
x
layer (x < 0.4) grown on Si substrate, the indirect
bandgap E
g
at 4.2 K can be expressed as [14]:
E
g;SiGe
(x) = 1.17 À 0.896x + 0.396x
2
(eV) ð4Þ
The valence band discontinuity is given by the fol-
lowing equation [15]:
DE
v
= 0.74x (eV) ð5Þ
Hence the conduction band offset could be obtained
by:
DE
c
= À0.156x + 0.396x
2
ð6Þ
If the value of DE
c
is positive, the band alignment is
type-II, otherwise the band alignment is type-I.
Fig. 2 Experimental and simulated x-ray rocking curves of the
symmetric (0 0 4) reflection for samples 1, 2 and 3 (from top to
bottom)
(a)
(b)
(c)
Imperfect
interfaces
Imperfect
interfaces
Imperfect
interfaces
Fig. 3 XTEM micrographs of (a) sample 1, (b) sample 2 and (c)
sample 3. Dark and bright regions correspond to the SiGe QW
and Si barrier layers, respectively
152 Nanoscale Res Lett (2007) 2:149–154
123
According to the work of Van de Walle and Martin
[15, 16], the energy splitting of the valence band is
given by the following equations:
DE
v;1
¼À
1
6
D
0
+
1
4
dE+
1
2
D
2
0
+ D
0
dE+
9
4
dEðÞ
2
1
=
2
ð7Þ
DE
v;2
=
1
3
D
0
À
1
2
dE ð8Þ
DE
v;3
¼À
1
6
D
0
+
1
4
dE À
1
2
D
2
0
+ D
0
dE+
9
4
dEðÞ
2
1
=
2
ð9Þ
where D
0
is the spin-orbital splitting. For strain along
the (001) direction, dE is equal to 2b(e
^
– e
//
), where b
is the uniaxial deformation potential for tetragonal
strain. DE
v,1
, DE
v,2
and DE
v,3
represent the band energy
offsets of the light, heavy and split-off band at the
valence band, respectively. The energy splitting of the
conduction band is given by the following equations:
DE
001
c
¼
2
3
N
D
u
e
?
À e
==
ð10Þ
DE
100;010
c
¼À
1
3
N
D
u
e
?
À e
==
ð11Þ
where N
D
u
is the uniaxial strain deformation potential
for the conduction band. Hence, the theoretical NP
energy value of sample 1 could be estimated by the
above equations. The estimated value is 934 meV,
which is in good agreement with the measured value of
920 ± 5 meV, and is consistent with the theoretical
value of 923.7 meV calculated by the 6 + 2-band k Á p
method. The parameters used for the calculation are
obtained by linear interpolation between the parame-
ters of Si and Ge (as shown in Table 1)[17, 18].
For samples 2 and 3, the theoretical calculations of
the band structures are more complex, when taking
interwell coupling effects in these two samples into
consideration. By employing calculations based on the
6 + 2-band k Á p method [19, 20], the calculated NP
transition energy values of samples 2 and 3 are
908.4 meV and 906 meV, respectively. These values
are in close agreement with the measured value of
907 ± 3 meV and 904 ± 2 meV, respectively. The
consistency between the measured and theoretical
values further confirms that the interwell coupling
effect is present in samples 2 and 3. Therefore, inter-
subband transition, which is the essential phenomenon
Si substrate
E
g
= 1.17eV
∆E
v
≈ 252meV
E
c
< 10meV
Strained Si
0.66
Ge
0.34
E
g
≈ 0.91eV
E
c
E
v
∆
Fig. 5 Schematic diagram of the band structure of a strained
Si
0.66
Ge
0.34
layer grown on Si substrate. Note: E
g
is the bandgap,
E
c
,E
v
, is the conduction and valence band, respectively, and DE
c
,
DE
v
is the conduction band and valence band discontinuities,
respectively. The values of the energies shown in the figure are
calculated at 4.2 K
0.8 0.85 0.9 0.95 1 1.05 1.1 1.1
5
Ener
gy
(eV)
PL Intensit (a.u.)
NP
TA
TO
4.2K
L
b
=40nm
L
b
=2nm
L
b
=4nm
S
S
A
A
~40meV
Fig. 4 PL spectra of samples 1, 2 and 3 (from bottom to top)
measured at 4.2 K. The barrier thickness (L
b
) of samples 1, 2 and
3 are 40, 4 and 2 nm, respectively. Inset shows the band structure
of the CQWs. S and A represent the symmetric and anti-
symmetric states, respectively [9]
Table 1 Parameters used in the calculations. Note:a
c
,a
v
and b
are obtained from Ref. 15 and other parameters are obtained
from Ref. 18
Parameters Si Ge
Lattice constant a
0
(A
˚
) 5.431 5.658
Spin-orbit splitting energy D
0
(eV) 0.044 0.296
Optical matrix parameter E
p
(eV) 21.6 26.3
Deformation potential constant a
c
(eV) 4.88 2.55
Deformation potential constant a
v
(eV) 2.46 2.55
Shear deformation potential b (eV) –2.33 –2.08
Uniaxial deformation potential N
D
u
(eV) 9.29 10.20
Elastic constant c
11
(Mbar) 1.675 1.315
Elastic constant c
12
(Mbar) 0.65 0.494
Luttinger parameter c
1
4.22 13.4
Luttinger parameter c
2
0.39 4.25
Luttinger parameter c
3
1.44 5.69
Longitudinal mass m
l
* (m
0
) 0.9163 0.7991
Transverse mass m
t
* (m
0
) 0.1905 0.2
Nanoscale Res Lett (2007) 2:149–154 153
123
in QC emitters, could be obtained in these samples.
This will be verified in the future experiments.
Conclusions
In summary, the interwell coupling effect in Si/
Si
0.66
Ge
0.34
CQWs structures grown by UHV-CVD
was investigated using low temperature PL measure-
ments. Red shift of PL peak energy caused by interwell
coupling was observed following a reduction in barrier
thickness. Variations in the QW and barrier thickness
and possibly defects in the as-grown material could
have contributed to the relatively broad PL signals
from the samples. The band structure model of the
Si/SiGe heterostructure was validated by comparing
theoretical calculations based on the 6 + 2-band k Á p
method with experimental values of the no-phonon PL
peak. The close agreement between the measured data
and theoretical calculations confirms the presence of
the interwell coupling effect in samples with narrow
barriers. The results from this work are useful for
future growth and design of Si/SiGe QC emitters.
References
1. G. Franzo, F. Priolo, S. Coffa, A. Polman, A. Carnera, Appl.
Phys. Lett. 64(17), 2235 (1994)
2. L. Pavesi, L. Dal Negro, C. Mazzoleni, G. Franzo, F. Priolo,
Nature 408(6811), 440 (2000)
3. S.G. Cloutier, P.A. Kossyrev, J. Xu, Nat. Mater. 4, 887 (2005)
4. G. Dehlinger, L. Diehl, U. Gennser, H. Sigg, J. Faist, K.
Ensslin, D. Gru
¨
tzmacher, E. Mu
¨
ller, Science 290, 2277 (2000)
5. I. Bormann, K. Brunner, S. Hackenbuchner, G. Zandler, G.
Abstreiter, S. Schmult, W. Wegscheider, Appl. Phys. Lett.
80(13), 2260 (2002)
6. R. Bates, S.A. Lynch, D.J. Paul, Z. Ikonic, R.W. Kelsall, P.
Harrison, S.L. Liew, D.J. Norris, A.G. Cullis, W.R. Tribe,
D.D. Arnone, Appl. Phys. Lett. 83(20), 4092 (2003)
7. J. Faist, F. Capasso, D.L. Sivco, C. Sirtori, A.L. Hutchinson,
A.Y. Cho, Science 264, (1994) 553
8. S. Fukatsu, H. Yoshida, N. Usami, A. Fujiwara, Y. Takah-
ashi, Y. Shiraki, R. Ito, Thin Solid Films 222, 1 (1992)
9. S. Fukatsu, Y. Shiraki, Appl. Phys. Lett. 63(17), 2378 (1993)
10. S. Fukatsu, Solid State Electron. 37, 817 (1994)
11. J.C. Sturm, H. Manoharan, L.C. Lenchyshyn, M.L.W.
Thewalt, N.L. Rowell, J P. Noe
¨
l, D.C. Houghton, Phys. Rev.
Lett. 66(10), 1362 (1991)
12. M.A. Herman, D. Bimberg, J. Christen, J. Appl. Phys. 70,
R1(1991)
13. P. Acosta-Dı
´
az, O. Cano-Aguilar, F.L. Castillo-Alvarado, M.
Mele
´
ndez-Lira, M. Lo
´
pez-Lo
´
pez, Superficies Y Vacı
´
o 12,39
(2001)
14. D.J. Robbins, L.T. Canham, S.J. Barnett, A.D. Pitt, P. Cal-
cott, J. Appl. Phys. 71(3), 1407 (1992)
15. C.G. Van de Walle, R.M. Martin, Phys. Rev. B 34(8),
5621(1986)
16. C.G. Van de Walle, Phys. Rev. B 39(3), 1871(1989)
17. D.J. Paul, Scmicond. Sci. Technol. 19, R75 (2004)
18. O. Madelung, M. Schultz, H. Weiss (ed.), Semiconductors,
Physics Group IV Elements and III–V Compounds, Landolt-
Bo
¨
rnstein, New Series Group III, vol 17 (Springer-Verlag,
New York, 1982), part a
19. Y.X. Dang, W.J. Fan, S.T. Ng, S.F. Yoon, D.H. Zhang, J.
Appl. Phys. 97(10), 103718 (2005)
20. Y.X. Dang, W.J. Fan, F. Lu, H. Wang, D.H. Zhang, S.F.
Yoon, J. Appl. Phys. 99(7), 076108 (2006)
154 Nanoscale Res Lett (2007) 2:149–154
123