Báo cáo hóa học: " Effective Radio Resource Management for Multimedia Broadcast/Multicast Services in UMTS Networks" ppt
Bạn đang xem bản rút gọn của tài liệu. Xem và tải ngay bản đầy đủ của tài liệu tại đây (1.54 MB, 12 trang )
Hindawi Publishing Corporation
EURASIP Journal on Wireless Communications and Networking
Volume 2006, Article ID 70903, Pages 1–12
DOI 10.1155/WCN/2006/70903
Effective Radio Resource Management for Multimedia
Broadcast/Multicast Services in UMTS Networks
Nuno Souto,
1, 2
Armando Soares,
2
Patricia Eus
´
ebio,
2
Am
´
erico Correia,
1, 2
and Jo
˜
ao C. Silva
1
1
Instituto de Telecomunicac¸
˜
oes, Avenue Rovisc o Pais 1, 1049-001 Lisboa, Portugal
2
Associac¸
˜
ao para o Desenvolvimento das Telecomunicac¸
˜
oes e T
´
ecnicas de Inform
´
atica, Avenue das Forc¸as Armadas,
Edif
´
ıcio ISCTE, 1600-082 Lisboa, Portugal
Received 29 September 2005; Revised 3 February 2006; Accepted 26 May 2006
Broadcast and multicast offer a significant improvement of spectrum utilization, and become particularly important where in-
formation channels are shared among several users. Mobile cellular environments are expected to evolve with the technological
approaches necessary to facilitate the deployment of multimedia services, such as streaming, file download, and carousel services.
The perspective that video streaming in wireless networks services is an attractive service to end-users has spurred the research
in this area. To provide for a video delivery platform in UMTS, the third generation partnership project (3GPP) addressed this
problem with the introduction of the multimedia broadcast and multicast services (MBMS) in 3GPP Release 6. In this document
we analyse several effective radio resource management techniques to provide MBMS, namely, use of nonuniform QAM constel-
lations, multicode, and macrodiversity to guarantee the optimal distribution of QoS depending on the location of mobiles.
Copyright © 2006 Nuno Souto et al. This is an open access article distributed under the Creative Commons Attribution License,
which permits unrestricted use, distribution, and reproduction in any medium, provided the original work is properly cited.
1. INTRODUCTION
In a mobile cellular network it is often necessary to transmit
the same information to all the users (broadcast transmis-
sion) or to a selected group of users (multicast transmission).
Depending on the communication link conditions some re-
ceivers will have better signal-to-noise ratios (SNR) than oth-
ers and thus the capacity of the communication link for these
users is higher. Cover [1] showed that in broadcast transmis-
sions it is possible to exchange some of the capacity of the
good communication links to the poor ones and the trade-
off can be worthwhile. A possible method to improve the ef-
ficiency of the network is to use nonuniform signal constel-
lations (also called hierarchical constellations) which are able
to provide unequal bit error protection. In this type of con-
stellations there are two or more classes of bits with differ -
ent error protection, to which different streams of informa-
tion can be mapped. Depending on the channel conditions,
a given user can attempt to demodulate only the more pro-
tected bits or also the other bits that carry the additional in-
formation. An application of these techniques is in the trans-
mission of coded voice or video signals. Several papers have
studied the use of nonuniform constellations for this pur-
pose [1, 2]. Nonuniform 16-QAM and 64-QAM constella-
tions are already incorporated in the DVB-T (digital video
broadcasting-terrestrial) standard [3].
Multimedia broadcast and multicast services (MBMS)
introduced by 3GPP in Release 6 are intended to efficiently
use network/radio resources (by transmitting data over a
common radio channel), both in the core network but most
importantly in the air interface of UMTS terrestrial radio ac-
cess network (UTRAN), where the bottleneck is placed to a
large group of users. However, it should take additional ac-
count of these network/radio resources. MBMS is targeting
high (variable) bit rate services over a common channel.
One of the most important properties of MBMS is re-
source sharing among s everal user equipments (UEs), mean-
ing that these users should be able to listen to the same
MBMS channel at the same time. Sufficientamountofpower
should be allocated to these MBMS channels so that arbitrary
UEs in the cell can receive the MBMS ser vice.
One of the key issues in multicast transmission is the
management of radio resources. The main requirement is to
make an efficient overall usage of the radio resources. This
makes the use of a common channel the favourite choice,
since many users can access the same resource at the same
time, but this depends also on the number of users belong-
ing to the multicast group, the type of service provided, and
the QoS that it can guarantee.
In this paper we will analyse several effective radio re-
source management techniques to provide MBMS, namely,
the use of non-uniform QAM constellations, multicode, and
2 EURASIP Journal on Wireless Communications and Networking
macrodiversity. The objective is to guarantee the optimal dis-
tribution of QoS depending on the location of the mobiles.
In Section 2 the multicode packet scheduling model is
presented, Section 3 describes non-uniform QAM constella-
tions, macrodiversity combining techniques are detailed in
Section 4, and in Section 5 simulation results are presented.
Finally some conclusions are drawn in Section 6.
2. MULTICODE PACKET SCHEDULING
(TWO QOS REGIONS)
Up to today no special t ransport channel has been specified
for the purpose of multicast, but some proposal and prelim-
inary studies have been provided. Therefore the driving con-
cept to support multicast on the UTRAN is to use the existing
transport channels, with minor modifications.
A flexible common channel suitable for point-to-multi-
point (PtM) transmissions is already available, namely, the
forward access channel (FACH), which is mapped onto the
secondary common control physical channel (S-CCPCH).
In [4], it was shown that about 40% of the sector total
power has to be allocated to a single 64 kbps MBMS if full cell
coverage is required. This makes MBMS too expensive since
the overall system capacity is limited by the power resource.
To make MBMS affordable for the UMTS system, its
powerconsumptionshavetobereduced.IfMBMSiscar-
ried on S-CCPCH, there is no inner-loop power control. Ex-
tra power budget has to be allocated to compensate for the
receiving power fluctuations.
Since MBMS video streaming is scalable, one way to im-
prove the power efficiency of MBMS carried over S-CCPCH
is to split the MBMS video streaming into several streams
with a different quality of service (QoS). The basic video layer
is coded by itself to provide the basic video quality and the
enhancement video layer is coded to enhance the basic layer.
The enhancement layer when added back to the basic layer
regenerates a higher quality reproduction of the input video.
Only the most important stream is sent to all the users in the
cell to provide the basic service. The less important streams
are sent with less amount of power or coding protection and
only the users who have better channel conditions are able
to receive that additional information to enhance the video
quality. This way, transmission power for the most impor-
tant MBMS st ream can be reduced because the data rate is
reduced, and the transmission power for the less important
streams can also be reduced because the coverage require-
ment is relaxed.
Two possible MBMS multicode schemes wil l be consid-
ered. The first one uses a single rate stream (single spreading
code), which is carried on a single 256 kbps channel and sent
to the whole area in the cell. The second one uses a dou-
ble streaming transmission, that is, two data streams (two
spreading codes), each of 128 kbps where basic information
for basic QoS is transmitted with the power level needed to
cover the whole cell, and a second stream conveys additional
information to users near the Node B (base station). This
way, Node B power can be saved trading off with QoS of UEs
at cell borders.
2.1. System model
According to the proposed transmission method UEs will
receive the service accordingly to their geographic position.
The RNC accounting for the differences in Node Bs ra-
dio resource availability divides MBMS data by its priorities
and transmits them in a fashion that suits each Node B. In
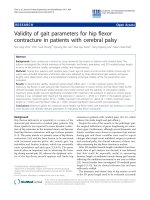
Figure 1 this approach is shown, where we can see the in-
formation scalability in two separate physical channels for
one MBMS service (256 kbps). This corresponds to the trans-
mission of two data streams, each of 128 kbps, where ba-
sic information providing the basic QoS is transmitted with
the power level needed to cover the whole cell, and the sec-
ond stream conveys additional information to users near the
Node B.
The model consists of two QoS regions, where the first
region receives all information while the second region re-
ceives the most important data. The QoS regions are associ-
ated with the geometry factor that reflects the distance of the
UE from the base station antenna. The geometry factor G is
defined as the ratio of interference generated in the own cell
to the interference generated in the other cells plus thermal
noise, that is,
G
=
I
own
I
others
+ P
N
. (1)
Table 1 shows the G values chosen. For the first region the
geometry factor is G
= 0 dB a nd for the second region G =
−
6dB.
UE1 will receive the most important data (t ransmitted at
128 kbps) to get a basic video quality service, whereas UE2
will receive all the data to provide a higher quality reproduc-
tion of the input video.
3. NONUNIFORM QAM CONSTELLATIONS
Another transmission method which is based on the same
philosophy of the multi-code transmission method just de-
scribed is the use of nonuniform constellations. In this study
we consider the use of 16-QAM non-uniform modulations
for the transmission of broadcast and multicast services in
WCDMA systems. For 16-QAM two classes of bits are used.
Some modifications to the physical layer of the UMTS-
(universal-mobile-telecommunications-systems-) based sys-
tem to incorporate these modulations were already proposed
in [5, 6].
3.1. 16-QAM
These constellations are constructed using a main QPSK con-
stellation where each symbol is in fact another QPSK constel-
lation, as shown Figure 2.
The bits used for selecting the symbols inside the small
inner constellations are called weak bits and the bits corre-
sponding to the selection of the small QPSK constellation are
called stronger bits. The idea is that the constellation can be
viewed as a 16-QAM constellation if the channel conditions
are good or as a QPSK constellation otherwise. In the latter
situation the received bit rate is reduced to half. The main
Nuno Souto et al. 3
UMTS core network
GGSN
SGSN
RNC
RNS
UE1
Node B
QoS region 1
QoS region 2
UE2
Cell boundary
Internet
Streaming server
Enhancement layer
Basic layer
GGSN: gateway GPRS support node
SGSN: serving GPRS support node
RNC: radio network controller
UE: user equipment
Figure 1: Two QoS regions packet scheduling model.
Table 1: QoS regions parameters.
QoS region EU capacity Maximum bit rate G (dB)
1 UE1 256 kbps 0
2
UE2 128 kbps −6
parameter for defining one of these constellations is the ratio
between d
1
and d
2
as shown in Figure 2:
d
1
d
2
= k, where 0 <k≤ 0.5. (2)
Each symbol s of the constellation can be written as
s
=
±
d
2
2
±
d
1
2
+
±
d
2
2
±
d
1
2
j. (3)
If k
= 0.5, the resulting constellation is a uniform 16-QAM.
When k is lower than 0.5, the bit error rate (BER) of the
stronger bits improves but since the BER of the weaker sym-
bols decreases, the overall BER also decreases.
Figure 3 shows a simplified transmission chain incorpo-
rating 16-QAM non-uniform constellations. In this scheme
there are 2 parallel processing chains, one for the basic infor-
mation stream and the other for the enhancement informa-
tion.
4. MACRODIVERSITY COMBINING
Macrodiversity combining (MDC) is proposed as an en-
hancement to the UMTS 3GPP Release 6 MBMS. In a point-
to-multipoint (PtM) MBMS service the transmitted con-
tent is expected to be network specific rather than cell spe-
cific, that is, the same content is expected to be multicas-
ted/broadcasted through the entire network or through most
of it. Therefore, a natural way of improving the physical
layer performance is to take advantage of macrodiversity. On
the network side, this means ensuring sufficient time syn-
chronization of identical MBMS transmissions in different
cells; on the mobile station side, this means the capability to
4 EURASIP Journal on Wireless Communications and Networking
1000 1010
1001 1011
0010 0000
0011 0001
1101 1111
1100 1110
0111 0101
0110 0100
d
2
d
1
I
Q
Figure 2: Signal constellation for 16-QAM nonuniform modula-
tion.
receive and decode the same content from multiple transmit-
ters simultaneously.
Basically the diversity combining concept consists of re-
ceiving redundantly the same information bearing signal
over two or more fading channels, and combine these mul-
tiple replicas at the receiver in order to increase the overall
received SNR.
In macro diversity the received signals from different
paths have to be processed using some sort of combining al-
gorithm. In this study two different combining procedures
are considered, namely, selective combining (SC) and maxi-
mal ratio combining (MRC).
4.1. Selective combining
Figure 4 shows a scheme of how selective combining oper-
ates at the receiver side. With SC the path/branch yielding
the highest SNR is always selected. In order to guarantee that
the receiver uses the path with the best quality a simultaneous
and continuous monitoring of all diversity paths is required.
The output of the diversity combiner will be
y(t)
= g
k
· s
m
(t)+n
k
(t), with g
k
= max
g
1
, ,
g
N
,
(4)
where g
k
is the maximum amplitude of the fading co-
efficients, and n
k
(t) is the additive Gaussian white noise
(AGWN) which is independent from branch to branch.
4.2. Maximal ratio combining
The maximal ratio combining (Figure 5), although being the
most complex combining technique presented, is the op-
timum way to combine the information from the differ-
ent paths/branches. The receiver corrects the phase rotation
caused by a fading channel and then combines the received
signals of different paths proportionally to the strength of
each path. Since each path undergoes different attenuations,
combining them with different weights yields an optimum
solution under an AWGN channel.
The output of the receiver can be represented as
y(t)
=
N
j=1
g
j
2
s
m
(t)+n
j
(t). (5)
5. SIMULATION RESULTS
Typically, radio network simulations can be classified as ei-
ther link level (radio link between the base station and the
user terminal) or radio network subsystem system level. A
single approach would be preferable, but the complexity
of such simulator—including everything from transmitted
waveforms to multicell network—is far too high for the re-
quired simulation resolutions and simulation time. There-
fore, separate link and system level approaches are needed.
Link level simulations are necessary for building a re-
ceiver model in the system simulator that can predict the re-
ceiver block error rate (BLER) and BER performance, taking
into account channel estimation, interleaving, and decoding.
The system level simulator is needed to model a system with
a large number of mobiles and base stations, and algorithms
operating in such a system.
Table 2 presents some link level parameters w hich will
be used in the following sections. The channel estimation is
performed using the common pilot channel (CPICH) which
is transmitted in parallel to the data channels, using an or-
thogonal reserved code. At the receiver, the modulation is re-
moved from the CPICH by multiplying it by its conjugate,
which results in a sequence of noisy channel estimates. These
noisy channel estimates are then passed through a moving
average filter and the filtered sequence can be interpolated
(or decimated) to match the rate of the data channels. 3GPP
[4] refers to Vehicular A a nd Pedestrian B channel models as
representative for the macrocellular environment and there-
fore results will be presented along this study for these two
models. The velocities of 3 and 30 km/h were presented in
3GPP [4] for the Vehicular A channel, where 3 km/h has pro-
vided worst performance results.
Table 3 shows the system level assumptions used for the
simulations.
The link performance results are used as an input by the
system level simulator where several estimates for coverage
and throughput purposes can be made by populating the sce-
nario topology uniformly and giving users a random mobil-
ity. The estimates are made for every transmission time in-
terval ( TTI) being the packets that are received with a BLER
below 1% considered to be well received. The estimates for
coverage purposes are made for an average of five consecu-
tive received packets; if the average received BLER of these
packets is below the 1% BLER, the mobile user is considered
as being in coverage. For the throughput calculation the es-
timation is made based on each individual packet received
with a BLER lower than 1%.
Figure 6 shows the geometr y CDF function values ob-
tained for the macrocellular environment. The geometry fac-
tor was previously defined in Section 2.1; a lower geometry
Nuno Souto et al. 5
Basic
information
stream
Channel coding
(turbo code)
Rate matching
Physical channel
segmentation
Interleaver
Interleaver
Modulation
mapper
for physical
channel
1
Modulation
mapper
for physical
channel
P
Spreading and
scrambling
Spreading and
scrambling
Pilot
channel
Enhancement
information
stream
Channel coding
(turbo code)
Rate matching
Physical channel
segmentation
Interleaver
Interleaver
Modulation
mapper
for physical
channel
1
Modulation
mapper
for physical
channel
P
Spreading and
scrambling
Spreading and
scrambling
X
k
P physical
channels
2 parallel
chains
Figure 3: Proposed tr ansmitter chain.
SNR
monitor
Select max
SNR
g
1
s
m
(t)+n
1
(t)
g
2
s
m
(t)+n
2
(t)
g
N
s
m
(t)+n
N
(t)
.
.
.
Channel 1
Channel 2
Channel N
Tran smi tter
Receiver
y(t)
Figure 4: Selective combining.
factor is expected when user is located at the cell edge (the
case where the interference received from the neighbouring
cells is higher than the interference experienced in its own
cell).
The cumulative distribution function (CDF) of geometry
can be obtained through uniformly distributing a large num-
ber of mobile users over the topology and calculating the G
at each position.
From Figure 6 it is possible to notice that for the studied
scenario about 95% of the users experience a geometry factor
of
−6dBorbetter,80%experienceageometryof−3dB or
better, and about 62% of the users experience a geometry of
0dBorbetter.
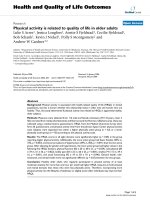
Figure 7 presents the first results obtained with the link
level simulator. The results are presented in terms of Ec/Ior
(dB) representing the fraction of cell transmit power neces-
sary to achieve the corresponding BLER performance grad-
uated on the vertical axis. For the reference BLER
= 10
−2
and bit rate of 256 kbps (use of a single spreading code with
spreading factor SF
= 8) we need to have a geometry fac-
tor of 0 dB in order to achieve Ec/Ior less than 80% (
−1dB)
considering the VehA propagation channel. This means that
we can only offer such a high bit rate for users located in
the middle of the cell, not near the border. By using a mul-
ticode transmission (2 spreading codes with SF
= 16) with
two different transmission powers, each assuring a bit rate of
128 kbps, offering different QoS that depend on the location
of the UEs, high er throughput is achieved with lower total
transmission power from the Node B.
In Figures 8–10, the QPSK 1% BLER coverage versus
MBMS channel power (Node-B Tx Ec/Ior) is shown with se-
lective combining or maximal ratio combining over 1 and 2
radio links (RLs), respectively, for the studied path models
and TTI of 40 ms and 80 ms. Due to the better operation of
the turbo decoder with increasing TTI (increasing encoded
block sizes) we observe a decrease in the required transmit-
ted power from the Node B when we use TTI
= 80 ms instead
of 40 ms. However, due to the limiting transport block size of
5114 bits per block of the turbo encoder specified in 3GPP,
the bit rate of 256 kbps does not allow an increase in the en-
coded block size for TTI
= 80 ms. As expected, the average
coverage of maximal ratio combining is always better than
6 EURASIP Journal on Wireless Communications and Networking
y(t) =
N
j=1
g
j
2
s
m
(t)+n
j
(t)
g
1
g
2
g
N
.
.
.
Channel 1
Channel 2
Channel N
Tra nsm itte r
Receiver
y(t)
Figure 5: Maximal ratio combining.
Table 2: Link level simulation parameters.
Parameter Val ue
S-CCPCH slot format 12 (128 kbps)
Transport block size & number of transport blocks
per TTI
Varied according to information bit rate
(128 or 256 kbps) and TTI value
CRC 16 bits
Transmission time interval (TTI) 20 ms
CPICH Ec/Ior
−10 dB (10%)
P-SCH (primary-synchronization channel) Ec/Ior
−15 dB (3%)
S-SCH (secondary-synchronization channel) Ec/Ior
−15 dB (3%)
Tx Ec/Ior Var ied
OCNS (orthogonal channel noise simulation) Used to sum the total Tx Ec/Ior to 0 dB (100%)
Channel estimation Enabled
Power control Disabled
Channels Pedestrian B, 3 km/h, Vehicular A, 3 km/h
selective combining and increasing the number of received
radio links provides reduction in the transmitted power in-
dependently of the combining technique.
In Figure 8, for the reference average coverage of 90%
the required Ec/Ior is about 60%–65% (PedB-VehA) for
128 kbps. For 256 kbps the same values of Ec/Ior allow aver-
age coverage around 52%–55%. There is the need of multi-
code or macrodiversity combining to allow an increase of bit
rate and average coverage and/or a reduction in transmitted
power. With multi-code the bit rate of 256 kbps is achiev-
able with two streams of 128 kbps, one of them requiring
Ec/Ior
1
= 30% (62% coverage in PedB environments) and
the other Ec/Ior
2
= 50% (85% coverage in PedB).
However, macrodiversity offers better coverage and re-
duction of transmitted power than multicode. Tables 4 and
5 illustrate the required Ec/Ior for the reference BLER
=
1% using macrodiversity with Vehicular A and Pedestrian B
propagation channels, respectively. The performance of the
former is always a little bit worse. According to the results
of Tables 4 and 5 up to two MBMS channels with 256 kbps
could be transmitted at the same time if MRC with 2RL were
Table 3: System level assumptions.
Parameter Value
Cellular layout Hexagonal
Sectorization Yes, 3 sector/cell
Site-to-site distance 1000 m
Number of base stations 18
Base station antenna gain 17.5dBi
Antenna beamwidth,
−3dB 70degrees
Antenna front-to-back ratio 20 dB
Propagation model Okamura-Hata
Base station total Tx power (sector) 43 dBm
Thermal noise DL
−103.3dBm
Orthogonally factor 0.4
Std of shadow fading 10 dB
Cable losses 3 dB
employed and considering that the maximum total available
Ec/Ior
≤ 83%.
Nuno Souto et al. 7
100
90
80
70
60
50
40
30
20
10
0
User locations with geometry < ascissa (%)
10 8 6 4 20 2 4 6 8 101214161820
Geometr y (dB)
Urban macrocell
Figure 6: Geometry CDF, urban macrocell scenario.
10
0
10
1
10
2
10
3
BLER
12 10 8 6 4 20
Ec/Ior (dB)
PedB, 128 kbps, 80 ms TTI (G
= 3dB)
VehA, 128 kbps, 80 ms TTI (G
= 3dB)
PedB, 256 kbps, 40 ms TTI (G
= 0dB)
VehA, 256 kbps, 40 ms TTI (G
= 0dB)
Figure 7: BLER versus Tx power for QPSK, different bit rates and
geometries (V
= 3 km/h).
Figure 11 presents an alternative way of offering the bit
rate of 256 kbps using nonuniform 16-QAM modulation and
a single spreading code with SF
= 16 for G = 0dB.Thiscase
is more spectral efficient than the previous one presented
in Figure 7 because it uses a higher SF but there is the dis-
advantage of requiring a more complex receiver. An itera-
tive receiver based on the one described in [5] is employed
for decoding both blocks of bits. For the reference value of
BLER
= 10
−2
the difference of total transmitted power be-
tween the strong and the weak blocks is about 5.5dB for ei-
ther Vehicular A or Pedestrian B. Notice that in this study we
100
90
80
70
60
50
40
30
20
10
0
Average coverage (%)
0 1020 30405060708090100
S-CCPCH Ec/Ior (%)
VehA, 128 kbps, 80 ms TTI (1RL)
PedB, 128 kbps, 80 ms TTI (1RL)
PedB, 256 kbps, 40 ms TTI (1RL)
VehA, 256 kbps, 40 ms TTI (1RL)
Figure 8: QPSK average coverage versus Tx power (1RL).
100
90
80
70
60
50
40
30
20
10
0
Average coverage (%)
0 1020 30405060708090100
S-CCPCH Ec/Ior (%)
VehA, 128 kbps, 80 ms TTI (2RL-SC)
PedB, 128 kbps, 80 ms TTI (2RL-SC)
PedB, 256 kbps, 40 ms TTI (2RL-SC)
VehA, 256 kbps, 40 ms TTI (2RL-SC)
Figure 9: QPSK average coverage versus Tx power (2RL-SC).
are only considering k = 0.5 (uniform 16-QAM constella-
tion).
Figure 12 corresponds to Figure 11 with SF
= 32 and ge-
ometry G
=−3 dB. In this case the maximum achievable
bit rate is 128 kbps. For BLER
= 10
−2
the difference of total
transmitted power between the strong and the weak blocks
also is 5.5 dB for either Vehicular A or Pedestrian B. The com-
parison between Figures 11 and 12 indicates that we can de-
crease the bit rate (increase of spreading factor) by decreas-
ing the geometry (increasing of other cells interference). It
8 EURASIP Journal on Wireless Communications and Networking
100
90
80
70
60
50
40
30
20
10
0
Average coverage (%)
0 1020 30 405060708090100
S-CCPCH Ec/Ior (%)
VehA, 128 kbps, 80 ms TTI (2 RL-MRC)
PedB, 128 kbps, 80 ms TTI (2 RL-MRC)
PedB, 256 kbps, 40 ms TTI (2 RL-MRC)
VehA, 256 kbps, 40 ms TTI (2 RL-MRC)
Figure 10: QPSK average coverage versus Tx power (2RL-MRC).
Table 4: Vehicular A, 3 km/h, 90% coverage, 1% BLER.
Bit rate TTI length 1RL SC (2RL) MRC (2RL)
128 kbps 80 ms
−1.87 dB −4.61 dB −7.59 dB
64.9% 34.6% 17.4%
256 kbps 40 ms
——
−3.89 dB
——40.75%
Table 5: Pedestrian B, 3 km/h, 90% coverage, 1% BLER.
Bit rate TTI length 1RL SC (2RL) MRC (2RL)
128 kbps 80 ms
−2.39 dB −4.92 dB −8.09 dB
57.6% 32.2% 15.5%
256 kbps 40 ms
——
−4.10 dB
——38.9%
means that we must decrease the bit rate if we intend to al-
low an increase of coverage. This is true independently of the
site-to-site distance between base stations (Node Bs).
In Figures 13–15, the 16-QAM 1% BLER coverage ver-
sus MBMS transmitted channel power (Node-B Tx Ec/Ior)
is shown with selective and maximal ratio combining over 1
and 2 radio links (RLs), for the studied path models and a
TTI of 40 ms.
In Figure 13, the performance of the conventional 1 ra-
dio link (RL) reception is illustrated for comparison with
reception using macrodiversity combining. For the refer-
ence average coverage of 90% and 1RL the differ ence of re-
quired Ec/Ior between strong blocks and weak ones is about
70% (PedB) and even higher percentage of Ec/Ior is required
10
0
10
1
10
2
10
3
BLER
12 10 8 6 4 20
Ec/Ior (dB)
VehA, SF
= 16, strong blocks (G = 0dB)
VehA, SF
= 16, weak blocks (G = 0dB)
PedB, SF
= 16, strong blocks (G = 0dB)
PedB, SF
= 16, weak blocks (G = 0dB)
Figure 11: BLER versus Tx power for 16-QAM strong and weak
blocks of bits (SF
= 16), k = 0.5.
10
0
10
1
10
2
10
3
BLER
12 10 8 6 4 20
Ec/Ior (dB)
VehA, SF
= 32, strong blocks (G = 3dB)
VehA, SF
= 32, weak blocks (G = 3dB)
PedB, SF
= 32, strong blocks (G = 3dB)
PedB, SF
= 32, weak blocks (G = 3dB)
Figure 12: BLER versus Tx power for 16-QAM strong and weak
blocks of bits (SF
= 32), k = 0.5.
for VehA (actually the 90% coverage for weak bocks is not
achievable for the later propagation channel with a single
radio link). As expected the average coverage of the strong
blocks is always much better than weak blocks. However, this
difference tends to decrease as the number of radio links in-
creases; for instance, in the 90% average coverage with 2RL
and MRC, the difference of required Ec/Ior is only 15% for
PedB (see Figure 15).
Nuno Souto et al. 9
100
90
80
70
60
50
40
30
20
10
0
Average coverage (%)
0 1020 30 405060708090100
S-CCPCH Ec/Ior (%)
Veh A, st ro ng b lo ck s ( 1R L)
Veh A, we ak bl oc ks ( 1R L)
PedB, strong blocks (1RL)
PedB, weak blocks (1RL)
Figure 13: 16-QAM average coverage versus Tx power (1RL).
100
90
80
70
60
50
40
30
20
10
0
Average coverage (%)
0 1020 30 405060708090100
S-CCPCH Ec/Ior (%)
VehA, strong blocks (2RL-SC)
VehA, weak blocks (2RL-SC)
PedB, strong blocks (2RL-SC)
PedB, weak blocks (2RL-SC)
Figure 14: 16-QAM average coverage versus Tx power (2RL-SC).
Figures 16 and 17 show the 1% BLER throughput ver-
sus MBMS transmitted channel power (Node-B Tx Ec/Ior)
with selective combining and maximal ratio combining over
1 and 2 radio links (RLs) for various channel models and
TTI
= 40 ms. In Figure 16, the performance of the conven-
tional 1 radio link (RL) reception is illustrated for compar-
ison. The maximum throughput of 256 kbps is not achiev-
able with 1RL, for both propagation channels, due to the low
coverage of weak blocks. To achieve the reference through-
put between 95% and 99% of the maximum bit rate, which
100
90
80
70
60
50
40
30
20
10
0
Average coverage (%)
0 10203040506070 8090100
S-CCPCH Ec/Ior (%)
Veh A, st ro ng b lo ck s ( 2R L-MRC)
Veh A, we ak bl oc ks ( 2R L-MRC)
PedB, strong blocks (2RL-MRC)
PedB, weak blocks (2RL-MRC)
Figure 15: 16-QAM average coverage versus Tx power (2RL-MRC).
256
224
192
160
128
96
64
32
0
Average throughput (kbps)
0 102030405060708090100
S-CCPCH Ec/Ior (%)
VehA (1RL)
PedB (1RL)
Figure 16: 16-QAM average throughput versus Tx power (1RL).
is 256 kbps, we need macrodiversity combining. With 2RL-
SC (Figure 17) we can observe a smooth step in the through-
put between 96 and 128 kbps, especially for the VehA chan-
nel due to the way SC operates and the difference of required
Ec/Ior between weak and strong blocks. We recall that for
128 kbps only the strong blocks are correctly received. With
2RL-MRC there is no such behaviour around 128 kbps be-
cause of the way this diversity combining operates. As ex-
pected, the reference throughput is achieved with less Ec/Ior
for MRC compared to SC.
In Figures 18–20, the 1% BLER throughput versus
MBMS channel power (Node-B Tx Ec/Ior) is shown with
10 EURASIP Journal on Wireless Communications and Networking
256
224
192
160
128
96
64
32
0
Average throughput (kbps)
0 102030405060708090100
S-CCPCH Ec/Ior (%)
VehA (2RL-SC)
PedB (2RL-SC)
VehA (2RL-MRC)
PedB (2RL-MRC)
Figure 17: 16-QAM average throughput versus Tx power
(SC/MRC).
256
224
192
160
128
96
64
32
0
Average throughput (kbps)
0 102030405060708090100
S-CCPCH Ec/Ior (%)
VehA, 128 kbps, 80 ms TTI (1RL)
PedB, 128 kbps, 80 ms TTI (1RL)
VehA, 256 kbps, 40 ms TTI (1RL)
PedB, 256 kbps, 40 ms TTI (1RL)
Figure 18: QPSK average throughput versus Tx power (1RL).
maximal ratio combining and selective combining over 1 and
2 radio links, for the various channel models, TTI lengths,
and spreading factors based on Release 6 results [4](named
QPSK in the caption). The performance of these R6 through-
put results is illustrated for comparison, with the corre-
sponding average throughput illustrated in Figures 16 and
17.
In Figure 18 we can check that for a 256 kbps bit rate
over 1RL the performance of QPSK is clearly worse than the
256
224
192
160
128
96
64
32
0
Average throughput (kbps)
0 102030405060708090100
S-CCPCH Ec/Ior (%)
VehA, 128 kbps, 80 ms TTI (2RL-SC)
PedB, 128 kbps, 80 ms TTI (2RL-SC)
VehA, 256 kbps, 40 ms TTI (2RL-SC)
PedB, 256 kbps, 40 ms TTI (2RL-SC)
Figure 19: QPSK average throughput versus Tx power (2RL-SC).
256
224
192
160
128
96
64
32
0
Average throughput (kbps)
0 102030405060708090100
S-CCPCH Ec/Ior (%)
VehA, 128 kbps, 80 ms TTI (2RL-MRC)
PedB, 128 kbps, 80 ms TTI (2RL-MRC)
VehA, 256 kbps, 40 ms TTI (2RL-MRC)
PedB, 256 kbps, 40 ms TTI (2RL-MRC)
Figure 20: QPSK average throughput versus Tx power (2RL-MRC).
16-QAM performance results presented in Figure 16.How-
ever, this difference tends to decrease as the number of radio
links increases. This means that the benefits of using macro-
diversity combining are higher for QPSK than 16-QAM.
Considering the reference bit rate of 256 kbps and refer-
ence coverage of 95% with macrodiversity by maximal ra-
tio combining 2 radio links (2RL-MRC), the capacity gain
of using nonuniform16-QAM is 0.2dB+3dB
= 3.2dB.The
0.2 dB comes from the comparison of Figures 17 and 20 for
Nuno Souto et al. 11
the Vehicular A channel, and the last 3 dB is due to the use of
SF
= 16 instead of SF = 8, which allows for using the double
of the channels.
6. CONCLUSIONS
In this paper we have analysed several effective r a dio resource
management techniques to provide MBMS, namely, use of
nonuniform QAM constellations, multicode, and macrodi-
versity to guarantee the optimal distribution of QoS depend-
ing on the location of mobiles. In this study we have also
presented the expected capacity gains that multicode and
nonuniform 16-QAM modulations with more complex re-
ceivers can provide to reduce the PtM MBMS channel power.
The latter receivers are more power efficient than current
receivers based on QPSK modulation. We have shown that
macrodiversity combining offers better capacity gains than
multi-code for broadcast/multicast services. The use of both
techniques at the same time is suggested. Non-uniform 16-
QAM receivers should be built in the near future with or
without the macrodiversity combining already specified by
3GPP, as an effective mean to increase not only the through-
put, but also the number of simultaneous simulcast services.
ACKNOWLEDGMENT
The authors would like to thank the European Commission
project IST-2003-507607 Broadcasting and Multicasting over
Enhanced UMTS Mobile Broadband Networks, B-BONE,
which has partially funded this work.
REFERENCES
[1] T. Cover, “Broadcast channels,” IEEE Transactions on Informa-
tion Theory, vol. 18, no. 1, pp. 2–14, 1972.
[2] M. B. Pursley and J. M. Shea, “Nonuniform phase-shift-key
modulation for multimedia multicast transmission in mobile
wireless networks,” IEEE Journal on Selected Areas in Communi-
cations, vol. 17, no. 5, pp. 774–783, 1999.
[3] “Digital video broadcasting (DVB) framing structure, channel
coding and modulation for digital terrestrial television (DVB-
T),” March 1997. ETSI, European Telecommunication Standard
ETS 300 744.
[4] 3GPP25.803, “S-CCPCH Performance for MBMS”.
[5] N. Souto, J. C. Silva, R. Dinis, and F. Cercas, “Iterative tur bo
multipath interference cancellation for WCDMA systems with
non-uniform modulations,” in Proceedings of IEEE 61st Vehicu-
lar Technology Conference (VTC ’05), vol. 2, pp. 811–815, Stock-
holm, Sweden, May-June 2005.
[6] N. Souto, J. C. Silva, F. Cercas, and R. Dinis, “Non-uniform
constellations for broadcasting and multicasting services in
WCDMA systems, ” in Proceedings of IEEE 14th IST Mobile
& Wireless Communications Summit,Dresden,Germany,June
2005.
Nuno Souto graduated in aerospace engi-
neering—avionics branch, in 2000 from In-
stituto Superior T
´
ecnico, Lisbon, Portugal.
From November 2000 to January 2002 he
worked as a researcher in the field of au-
tomatic speech recognition for Instituto de
Engenharia e Sistemas de Computadores,
Lisbon, Portugal. He is currently working
for his Ph.D. degree in electrical engineering
in Instituto Superior T
´
ecnico. His research
interests include wideband CDMA systems, OFDM, channel cod-
ing, channel estimation, and MIMO systems.
Armando Soares graduated in telecommu-
nication and computer science engineering
at Instituto Superior de Ci
ˆ
encias do Tra-
balho e da Empresa, Lisbon, Portugal. He
is currently finishing his M.S. degree at
the same university. He has been working
as a researcher in the fields of radio re-
sources optimisation and efficient alloca-
tion for 3G UMTS networks and beyond.
These research activities are being devel-
oped in ADETTI/ISCTE. Since 2003, he has been working in In-
formation Society Technologies EU funded telecommunications
research projects, namely, SEACORN, B-BONE, and currently C-
MOBILE.
Patricia Eus
´
ebio graduated in telecommu-
nication and computer science engineering,
in 2003 from Instituto Superior de Ci
ˆ
encias
do Trabalho e da Empresa (ISCTE), Lis-
bon, Portugal. She received the M.S. degree
in computer science and telecommunica-
tion engineering at the same university in
2005. From February 2004 to January 2005,
she was with ISCTE as an Assistant Teacher
and she was enrolled in some EU funded
telecommunications research projects, namely, SEACORN and B-
BONE. She is currently working as a Project Manager in a telecom-
munication and energy company—Netplan, in RF planning and
optimisation area.
Am
´
erico Correia received the B.Sc. degree
in electrical engineering from the University
of Angola in 1983, the M.S. and Ph.D. de-
grees from Istituto Superior T
´
ecnico (IST),
Lisbon, Portugal, in 1990 and 1994, respec-
tively. From 1991 to 1999 he was with IST
as an Assistant Professor. He is currently
with Instituto Superior de Ci
ˆ
encias do Tra-
balho e da Empresa (ISCTE), Lisbon, Portu-
gal. He visited Nokia Research Center from
September to December 1998 as a visiting scientist. From Septem-
ber 2000 to August 2001 he joined Ericsson Eurolab Netherlands.
His current research topics include wideband CDMA, MIMO, ra-
dio resource management, and multimedia broadcast/multicast
services.
12 EURASIP Journal on Wireless Communications and Networking
Jo
˜
ao C. Silva received the B.S. degree in
aerospace engineering from Instituto Supe-
rior T
´
ecnico (IST), Lisbon Technical Uni-
versity, in 2000. From 2000 to 2002 he
worked as a business consultant on McKin-
sey&Company. From 2002 onwards, he has
been working on his Ph.D. thesis at I ST,
focusing on spread spectrum techniques,
multiuser detection schemes, and MIMO
systems.