Báo cáo hóa học: " Research Article Visual Contribution to Speech Perception: Measuring the Intelligibility of Animated Talking Heads" doc
Bạn đang xem bản rút gọn của tài liệu. Xem và tải ngay bản đầy đủ của tài liệu tại đây (690.94 KB, 12 trang )
Hindawi Publishing Corporation
EURASIP Journal on Audio, Speech, and Music Processing
Volume 2007, Article ID 47891, 12 pages
doi:10.1155/2007/47891
Research Article
Visual Contribution to Speech Perception: Measuring the
Intelligibility of Animated Talking Heads
Slim Ouni,
1
Michael M. Cohen,
2
Hope Ishak,
2
and Dominic W. Massaro
2
1
LORIA, Campus Sc ientifique, BP 239, 54506 Vandoeure l
`
es Nancy Cedex, France
2
Perceptual Science Laboratory, University of California, Santa Cruz, CA 95064, USA
Received 7 January 2006; Revised 21 July 2006; Accepted 21 July 2006
Recommended by Jont B. Allen
Animated agents are becoming increasingly frequent in research and applications in speech science. An important challenge is to
evaluate the effectiveness of the agent in terms of the intelligibility of its visible speech. In three experiments, we extend and test
the Sumby and Pollack (1954) metric to allow the comparison of an agent relative to a standard or reference, and also propose a
new metric based on the fuzzy logical model of perception (FLMP) to descr ibe the benefit provided by a synthetic animated face
relative to the benefit provided by a natural face. A valid metric would allow direct comparisons accross different experiments and
would give measures of the benfit of a synthetic animated face relative to a natural face (or indeed any two conditions) and how
this benefit varies as a function of the type of synthetic face, the test items (e.g., syllables versus sentences), different individuals,
and applications.
Copyright © 2007 Slim Ouni et al. This is an open access article distributed under the Creative Commons Attribution License,
which permits unrestricted use, distribution, and reproduction in any medium, provided the original work is properly cited.
1. INTRODUCTION
It is not surprising that face-to-face communication is more
effective than situations involving just the voice. One reason
is that the face improves intelligibility, particularly when the
auditory signal is degraded by the presence of noise or dis-
tracting prose (see Sumby and Pollack [1]; Beno
ˆ
ıt et al. [2];
Jesse et al. [3]; Summerfield [4]). Given this observation,
there is value in developing applications with virtual 3D
animated talking heads that are aligned with the auditory
speech (see Bailly et al. [5]; Beskow [6]; Massaro [7]; Odisio
et al. [8]; Pelachaud et al. [9]). These animated agents have
the potential to improve communication between humans
and machines. Animated agents can be particularly beneficial
for hard-of-hearing individuals. Furthermore, an animated
agent could mediate dialog between two persons communi-
cating remotely when their facial information is not avail-
able. For example, a voice in telephone conversations could
drive an animated agent who would be visible to the partic-
ipants (see Massaro et al.[10]; Beskow et al. [11]). An an-
imated agent can also be used as a vocabulary tutor (see
Bosseler and Massaro [12]; Massaro and Light [13]), a second
language instructor (see Massaro and Light [14]), a speech
production tutor (see Massaro and Light [15]), or personal
agent in human-machine interac tion (see Nass [16 ]).
Given that the effectiveness of animated agents is criti-
cally dependent on the quality of their visible speech (in this
paper, we use the term “visible speech” to describe both phys-
ical and perceptual aspects of visible speech. Note that, for
the physical signal, the term “optical signal” is also used in
literature) and emotion, it is important to assess their accu-
racy. An obvious standard or reference for measuring this ac-
curacy is to compare the effectiveness of an animated agent
to that of a natural talker. We know that a natural face im-
proves the intelligibility of auditory (in this paper, we use the
term “auditory sp eech” to describe both physical and per-
ceptual aspects of audible speech. Note that for the physical
signal, the term “acoustic signal” is also used in literature)
speech in noise and we can evaluate an animated agent rela-
tive to this reference (see Cohen et al. [17]; Massaro [7,Chap-
ter 13], Siciliano et al. [18]). Given the individual differences
in speech intelligibility of different talkers, the natural refer-
ence should be someone who provides high quality visible
speech, or a sample of different talkers should b e used. Fol-
lowing this logic, a defining characteristic of our research has
been the empirical evaluation of the intelligibility of our vis-
ible speech synthesis relative to that given by a human talker
with good visible speech. The goal of the evaluation process
is to determine how the synthetic v isual talker falls short of
a natural talker and to modify the synthesis accordingly. It is
2 EURASIP Journal on Audio, Speech, and Music Processing
also valuable to be able to contrast the effectiveness of two
different animated agents or any two visible speech condi-
tions, for example, a full face versus just the lips.
The goal of this paper is to facilitate the evaluation of
the effectiveness of an agent in terms of the intelligibility of
its visible speech. In their seminal study, Sumby and Pollack
[1] demonstrated that speech intelligibility improved dra-
matically when the perceivers viewed the speaker’s facial and
lip movements relative to no view of the speaker. They also
found that, as expected, performance improved in both con-
ditions with decreases in vocabulary size. Sumby and Pol-
lack [1] proposed a metric to describe the benefit provided
by the face relative to the auditory speech presented alone.
We defin e an invariant metric as one that gives a constant
measure of the contribution of visible speech across all lev-
els of performance, and therefore would be independent of
the speech-to-noise ratio. It would also be valuable to have
ameasureofeffectiveness that describes intelligibility rela-
tive to a reference. One of our goals is to extend the metric
proposed by Sumby and Pollack [1] to describe the benefit
provided by a synthetic animated face relative to the benefit
provided by a natural face. The invariance of the metric de-
scribing the relative contribution of two visible speech con-
ditions is tested in which auditory speech is presented un-
der different noise levels and is paired with two different visi-
ble speech conditions. In three new experiments, we compare
our synthetic talker Baldi to a natural talker, Baldi’s lips only
versus a full face, and a natural talker’s lips only versus a full
face. We can expect the overall noise level to greatly impact
performance accuracy but an invariant metric describing the
relative contr ibution of two visible speech conditions would
remain constant across differences in performance accuracy.
If some metric is determined to be invariant, it would allow
direct comparisons across different experiments and would
give measures of the benefit of a synthetic animated face rel-
ative to a natural face and how this benefit varies as a func-
tion of the type of synthetic face, the test items (e.g., syllables
versus sentences), different individuals, and var ious applica-
tions.
2. TALKING HEAD EVALUATION SCHEME
The intelligibility of a synthetic talker system can be mea-
sured by a perceptual experiment with at least two condi-
tions: unimodal auditory condition and bimodal audiovisual
condition (e.g., Jesse et al. [3]). Typically, a set of utterances
(syllables, words, or sentences) is presented to observers in a
noisy environment that makes it difficult to perfectly under-
stand the acoustic speech. The same a coustic signal is used in
the unimodal and bimodal conditions, which are randomly
interspersed during the test session. The noise should be loud
enough to make it difficult to understand the auditory speech
but not too loud to observe an improvement relative to the
visible speech presented alone. More generally, a goal should
be to have performance vary as much as possible across the
different experimental conditions. A pretest might be needed
to choose the best signal-to-noise levels for a given experi-
ment. Participants are asked to recognize and report the ut-
terances in the test. Massaro [7, Chapter 13] provides addi-
tional details about the choice of test items, the experimental
procedure, and the data analysis of evaluation experiments.
The difference between unimodal and bimodal conditions
gives a measure of the benefit of the visible speech, and we
will see that it is also valuable to present the visible speech
alone.
2.1. Comparison of results across experiments
Multiple experiments are necessary to perform successive
evaluations of the development of an animated agent. The
initial intelligibilit y of the first instantiation of an animated
agent cannot be expected to be optimal. Therefore, an intel-
ligibility test should be performed by evaluating how much
the animated agent facilitates performance relative to a refer-
ence, usually taken to be that given by a high-quality natural
talker. By comparing the similarities and differences, these re-
sults can be used to create a new improved animated talker to
be tested in a succeeding experiment. Similarly, evaluations
of different agents from different laboratories or applications
will also most likely be carried out in different experiments.
In these two cases, it is difficult to make a direct comparison
of the results of one experiment with another. One reason
is that the participants, test items, and signal-to-noise levels
will most likely differ across experiments, wh ich would nec-
essarily give different overall levels of performance. In many
cases, the experiments will be carried out independently of
one another, and even if they are not, it is practically very dif-
ficult to reproduce the accuracy level from one experiment to
another. Thus, it is necessary to have an invariant met ric that
is robust across different overall levels of performance so that
valid comparisons can be made across experiments.
2.2. Sumby and Pollack [1] visual contribution metric
To address this problem, Sumby and Pollack [1] proposed
a visual contribution metric that was assumed to provide a
measure that was independent of the noise level. This metric
has been used by several researchers to compare results across
experiments (see, e.g., LeGoff et al. [19]; Ouni et al. [20
]).
The metric is based on the difference between the scores from
the bimodal and unimodal auditory conditions, and mea-
sures the visual contribution C
V
to performance in a given
S/N condition, which is
C
v
=
C
AV
− C
A
1 − C
A
,(1)
where C
AV
and C
A
are the bimodal audiovisual and uni-
modal auditory intelligibilit y scores. In this formula, we ex-
pect C
AV
to be greater than or equal to C
A
. Given this con-
straint, as can be seen in (1), C
V
can vary between 0 and 1.
Sumby and Pollack concluded that C
v
is approximately
constant over a range of speech-to-noise ratios. They stated,
“this ratio is approximately constant over a wide range of
speech-to-noise ratios. Specifically, for the 8-word vocabulary,
the ratio increases from about 0.81 at S/N ratio of
−30 dB
to about 0.95 at S/N ratio of
−6 dB.” Although Sumby and
Slim Ouni et al. 3
Pollack [1] viewed this 14 difference as “approximately con-
stant,” we view it as a fairly substantial difference. Futher-
more, the authors simply averaged results across individu-
als to compute these values, which could have reduced the
variability across noise levels. Given the early date of this re-
search, it is not surprising that no inferential statistics were
computed to justify their conclusion that the relative visual
contribution is independent of the noise level. Grant and
Walden [21] showed problems with a related ANSI measure
of performance by finding that the benefit of bimodal speech
is inversely related to redundancy of the auditory and vis-
ible speech. Therefore, to the extent that varying the noise
level systematically degrades some properties of the speech
signal relative to others, then it is not reasonable to expect the
Sumby and Pollack [1]metricoranymeasurethatsomehow
computes the advantage of the bimodal condition compared
to the auditory condition to give an invariant measure across
noise levels. At the minimum, we would expect that the mea-
sure has to take into account not only the information in the
auditory speech but also in the visible speech (see also Beno
ˆ
ıt
et al. [2]).
3. RELATIVE VISUAL CONTRIBUTION METRIC
Sumby and Pollack’s metric measures the contribution of a
single talker. In our assessment of animated agents, the eval-
uation of an animated agent is made with respect to a natural
talking head. A metric indicating the quality of an animated
agentshouldbemaderelativetothisreferenceofanatu-
ral talking head. A completely ineffective agent would give
performance equal to or worse than the unimodal auditory
condition and complete success would be the case in which
the effectiveness of the animated agent would be equal to the
reference. In the following, we introduce a modification of
Sumby’s formula, to give a direct measure of the effectiveness
of an animated agent relative to that of a natural talker.
Equation (1) is based on the reference of perfect perfor -
mance in the task. In evaluating animated agents, however,
the reference is performance with a natural talking head. In
practice, it is valuable to have several references of a natu-
ral talker but only one is used here because the main goal is
to implement and test for an invariant metric. In the follow-
ing, we introduce a metric that takes into account the natural
talking head performance as the reference.
First, we start by introducing C
r
v
, the relative visual deficit
to measure the missing information, that is, the gap between
the visual contribution of the natural face and the visual con-
tribution of the synthetic face.
C
r
v
is defined as follows:
C
r
v
=
C
N
− C
S
1 − C
A
,(2)
where C
S
, C
A
,andC
N
are bimodal synthetic face, unimodal
auditory, and bimodal natural face intelligibility scores.
We deduce from this equation the relative visual contri-
bution C
r
v
:
C
r
v
= 1 −
C
N
− C
S
1 − C
A
. (3)
The validity of (3) requires that C
A
is not one, which would
then have division by zero. The relative visual contribution C
r
v
in (3) is the contr ibution of the synthetic face relative to the
natural face.
We can also write
C
r
v
= 1 − C
r
r
. (4)
It is easy to note that
C
r
v
+ C
r
v
= 1. (5)
To use this metric meaningfully, the unimodal auditory
recognition scores should not be perfect
0 <
1 − C
A
< 1. (6)
If this inequality does not hold, it means that the unimodal
auditory condition is not degraded and thus we cannot mea-
sure the benefit of visual speech. Thus, it is important in these
experiments to add noise or degrade the acoustic signal chan-
nel by other means. We recall that the purpose of this metric
is to evaluate the performance of a synthetic talker compared
to a natural talker when the acoustic channel is degraded. We
now describe how this measure should be inter preted.
3.1. Interpretation of the relative visual
contribution metric
(1) C
r
v
> 1
If C
r
v
> 1, the synthetic face gives better performance than
the natural face. This result could simply mean that the nat-
ural talker reference was below normal intelligibility, or that
the visible speech was synthesized to give extraordinary in-
formation. Better performance for the synthetic face than the
natural face can also be a case of a hyperrealism. The anima-
tion might have added additional cues not found in natural
speech. For example, experiments have used so-called sup-
plementary features to provide phonetic infor mation that is
not present on the face (see Massaro [7, Chapter 14], Massaro
and Light [15]). These features can include neck vibration to
signal voicing, making the nose red to signal nasality, and an
air stream coming from the mouth to signal frication.
(2) C
r
v
≤ 1
We expect that C
r
v
≤ 1 will be the most frequent outcome
because it has proven difficult to animate a synthetic talking
facetogiveperformanceequivalenttothatofanaturalface.
The value of C
r
v
, however, provides a readily interpretable
metric indexing the quality of the animated talker. The value
of C
r
v
is the visual contribution of the synthetic talker rela-
tive to that of a natural talker. For C
r
v
, the value should be
read as the visual contribution of the synthetic face compared
to the natural face independently of the auditory conditions
of degradation. For example, a value of 80% means the syn-
thetic face reached 80% of the visual performance of the nat-
ural face. The quality of the animated speech approaches real
visiblespeechasthismeasureincreasesfrom0to1.
4 EURASIP Journal on Audio, Speech, and Music Processing
A
i
V
j
a
i
v
j
s
k
R
k
Evaluation
Integration
Decision Learning
Feedback
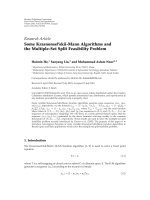
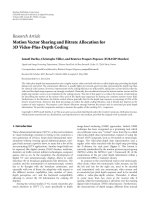
Figure 1: Schematic representation of the FLMP. The sources of
information are represented by uppercased letters. Auditory infor-
mation is represented by A
i
and visual information by V
j
. The eval-
uation process transforms these sources of information into psy-
chological values (indicated by lowercased letters a
i
and v
j
). These
sources are then integrated to give an overall degree of support s
k
for each speech alternative k. The decision operation maps the out-
puts of integration into some response alternative R
k
. The response
can take the form of a discrete decision or a rating of the degree to
which the alternative is likely. The learning process is also included.
Feedback at the learning stage is assumed to tune the prototypical
values of the features used by the evaluation process.
3.2. Fuzzy logical model of perception (FLMP)
One potential limitation of these two metrics is that they
do not consider performance based on just the visual infor-
mation. This is not unreasonable because visual alone tri-
als are not always tested in experiments of this kind. Grant
and colleagues (Grant and Seitz [23]; Grant et al. [ 24]; Grant
and Walden [21, 25]) have included visual-only conditions,
which have proved helpful in understanding the contribu-
tion of visible speech and how it is combined with auditory
speech (see Massaro and Cohen [26]). We propose that much
can be gained by including visual only trials.
The fuzzy logical model of perception (FLMP) can be
used to assess the visual contribution to speech perception
and therefore provide a measure of the relative visual contri-
bution of the synthetic face relative to the natural (see Mas-
saro [7]). Figure 1 is a schematic representation of the FLMP
that illustrates three major operations in pattern recognition:
evaluation, integration, and decision. The three perceptual
processes are shown to proceed left to right in time to il-
lustrate their necessarily successive but overlapping process-
ing. These processes make use of prototypes stored in long-
term memor y. The sources of information are represented by
uppercase letters. Auditory information is represented by A
i
and visual information by V
j
. The evaluation process trans-
forms these sources of information into psychological val-
ues (indicated by lowercase letters a
i
and v
j
). These sources
are then integrated to give an overall degree of support, s
k
,
for each speech alternative k. The decision operation maps
the outputs of integration into some response alternative,
R
k
. The response can take the form of a discrete decision or
a rating of the degree to which the alternative is likely. The
learning process is also included in Figure 1. Feedback at the
learning stage is assumed to tune the prototypical values of
the features used by the evaluation process.
4. RELATIVE VISUAL CONTRIBUTION
IN NOISE EXPERIMENTS
Given the potential value of this metric, it is important that
it is demonstrated to be invariant. The critical assumption
underlying the metric is that it remains constant with dif-
ferences in unimodal auditory performance (of course, ce-
teris paribis, when all other experimental conditions are con-
stant). To test this assumption, we carried out a first experi-
ment comparing a natural talker against a synthetic animated
talker, Baldi, at 5 different noise levels to modulate baseline
performance. We chose a natural talker who has highly in-
telligible visible speech (see Bernstein and Eberhardt [22];
Massaro [7]). Then we carried out a second and third exper-
iments comparing a full face to just the lips to provide addi-
tional results to test for an invariant metric. For instance, in
addition to comparing a natural talker to a synthetic talker,
the metric can be used to assess how informative a particular
part of the face compared to another part or to the full face is.
This type of result would be helpful in improving a particular
part of the synthetic talker, for example. The conditions were
chosen to give substantial performance differences between
the reference and the test.
4.1. Method
We carried out three expanded factorial experiments. In the
first experiment, the five presentation conditions were: (a)
unimodal auditory; (b) unimodal synthetic talker Baldi; (c)
unimodal natural talker; (d) bimodal synthetic talker Baldi
(the test); and (e) bimodal natural talker.
Participants
Thirty-eight native English s peakers, from the undergraduate
Psychology Department participant pool at the University of
California at Santa Cruz participated in this experiment as an
option to fulfill a course requirement in psychology. In the
first experiment, ten participants were 18 to 20 years old in
age, 5 females and 5 males. They all reported normal hearing
and normal seeing abilities. Two participants spoke Spanish
in addition to native English and one participant spoke Can-
tonese/Mandarin Chinese in addition to native English. All
participants were right handed. There were 8 and 20 partici-
pants in Experiments 2 and 3, respectively, who volunteered
from the same community as those in Experiment 1.
Test stimuli
The stimuli were 9 consonants: C
={/f/, /p/, /l/, /s/, /
∫
/,
/t/, /θ/, /r/, /w/
} and 3 vowels: V ={/a/, /i/, /u/} to form
a total of 27 consonant-vowel syllables (CVs). The con-
sonant and vowel stimuli were chosen because they were
Slim Ouni et al. 5
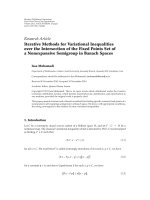
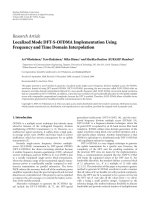
(a) (b) (c) (d)
Figure 2: Views of the natural talker, from the Bernstein and Eberhardt [22] videodisk, Baldi, and the two conditions of just the lips. In the
first exper iment, we presented the natural talker’s full face and Baldi’s full face. In the second experiment, we presented Baldi’s full face and
Baldi’s lips only. In the third experiment, we presented the natural talker’s full face and his lips only.
representatives of distinct consonant viseme categories. The
acoustic signal was paired with 5 different white noise signals.
The average values of the speech-to-noise ratio were:
−11 dB,
−13 dB, −16 dB, −18 dB, and −19 dB (which we refer to in
the text as the five noise levels). There were also five presen-
tation conditions: auditory only, visual-only natural talker,
visual-only synthetic talker, bimodal natural talker, and bi-
modal synthetic talker. Thus, for each experiment, we had
27 stimuli per condition, 5 presentation conditions, and 5
noise levels. The 27 CVs were factorially combined with the
five noise levels and three of the presentation conditions for
27
× 5 × 3 = 405 trials. The 27 CVs were also presented un-
der the two visual-only conditions to give 54 additional trials.
Therefore, the total number of trials was 459 presented in a
random order.
The natural speaker is shown in Figure 2, a male talker
Gary (see Bernstein and Eberhardt laser videodisk [22]). His
presentations were video clips, AVI files converted and ex-
tracted from the disk. The synthetic talker also shown in
Figure 2 was Baldi, our computer-animated talking head.
The visual portions of the stimulus, that is, Baldi and
the natural face, were presented at the same visual angle
of approximately 30 degrees. The player used was our cus-
tom PSLmediaPlayer positioned at 200x 30y (from top left)
and 640
∗
480 size. The screen resolution was set to 1024
∗
768
pixels. The a uditory speech was taken from Gary’s audi-
tory/visual corpus of bimodal consonant-vowel syllables pre-
sented in citation speech. For the synthetic face, the visual
phonemeswereviterbialignedandmanuallyadjustedto
match Gary’s phonemes pronunciation. Participants were
instructed to identify each test stimulus as one of the 27
consonant-vowel syllables.
Apparatus
The stimuli were presented using a software program built
using rapid application design (RAD) tools from the Center
for Spoken Language Understanding (CSLU) speech toolkit
( The hardware was a PC
running the Windows 2000 operating system with Open-Gl
video card, 17 inch video monitor, and sound blaster audio.
All of the experimental trials were controlled by the CSLU
toolkit RAD application.
The second and third experiments had exactly the same
design as the first experiment except that the test and ref-
erence conditions differed. In Experiment 2, Baldi was desig-
nated as the reference condition and a presentation of just his
lips was the test condition. The third experiment was identi-
cal to the second except that the natural talker Gary from the
Bernstein and Eberhardt [22] videodisk was used as the refer-
ence and just his lips was the test condition. Figure 2 presents
views of the natural talker, Baldi, and the two corresponding
conditions of just the lips.
4.2. Results
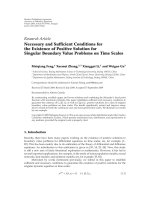
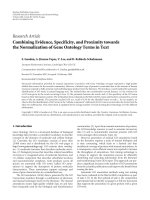
Figure 3 plots the overall percentage correct identification as
one of the 27 CV syllables in the first experiment across five
noise levels in the three conditions: unimodal auditory, bi-
modal AV-synthetic face, and bimodal AV-natural face. As
can be seen in this figure, performance improved with de-
creases in noise level. Both the natural talker and Baldi gave
a large advantage relative to the auditory condition. As ex-
pected, performance for Baldi fell somewhat short of that for
the natural talker.
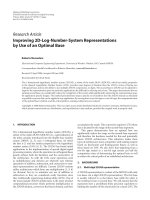
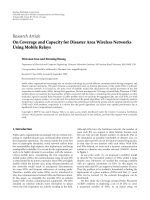
Figures 4 and 5 plot the overall percentage correct iden-
tification as one of the 27 CV syllables in the second and
third experiments, respectively. Performance improved with
decreases in noise level, both the full face and just the lips
gave a large advantage relative to the auditory condition. For
both the natural and synthetic talkers, the full face gave better
performance than just the lips, although, the difference was
much smaller for the natural face.
4.3. Test of Sumby and Pollack [1]visual
contribution metric
In order to test whether the Sumby and Pollack [1]per-
formance metric remains constant across the five levels of
noise, the results for each subject in each experiment were
pooled across identification performance on the 27 sylla-
bles to give overall performance accuracy for each subject
6 EURASIP Journal on Audio, Speech, and Music Processing
Table 1: Overall accuracy scores for each participant under each of the 15 conditions of Experiment 1. The last two columns present
unimodal visual results.
Unimodal auditory across 5 noise levels Bimodal synthetic face across 5 noise levels Bimodal natural face across 5 noise levels Unimodal visual
Participants −19 dB −18 dB −16 dB −13 dB −11 dB −19 dB −18 dB −16 dB −13 dB −11 dB −19 dB −18 dB −16 dB −13 dB −11 dB Synthetic Natural
1 0.07 0.15 0.19 0.48 0.44 0.52 0.52 0.63 0.67 0.63 0.67 0.85 0.74 0.78 0.81 0.33 0.48
2
0.07 0.19 0.19 0.26 0.56 0.48 0.44 0.67 0.67 0.78 0.81 0.78 0.78 0.96 0.93 0.52 0.74
3
0.19 0.04 0.26 0.41 0.44 0.56 0.52 0.48 0.63 0.78 0.59 0.70 0.67 0.89 0.81 0.44 0.74
4
0.19 0.26 0.30 0.48 0.48 0.63 0.52 0.59 0.74 0.85 0.70 0.63 0.67 0.81 0.93 0.56 0.59
5
0.11 0.22 0.22 0.33 0.56 0.74 0.59 0.81 0.93 0.85 0.78 0.81 0.78 0.85 0.89 0.59 0.70
6
0.26 0.22 0.26 0.44 0.48 0.67 0.59 0.59 0.59 0.81 0.59 0.59 0.74 0.78 0.81 0.48 0.56
7
0.26 0.11 0.15 0.48 0.70 0.56 0.48 0.74 0.70 0.74 0.89 0.85 0.85 0.93 0.93 0.67 0.85
8
0.15 0.11 0.33 0.30 0.56 0.52 0.63 0.67 0.70 0.67 0.74 0.67 0.81 0.93 0.89 0.59 0.56
9
0.19 0.22 0.19 0.41 0.30 0.52 0.63 0.78 0.78 0.63 0.78 0.56 0.81 0.74 0.89 0.52 0.67
10
0.19 0.30 0.19 0.37 0.48 0.48 0.59 0.63 0.67 0.70 0.59 0.56 0.59 0.59 0.81 0.52 0.67
Mean 0.17 0.18 0.23 0.40 0.50 0.57 0.55 0.66 0.71 0.74 0.71 0.70 0.74 0.83 0.87 0.52 0.66
Table 2: Overall accuracy scores for each participant under each of the 15 conditions of Experiment 2. The last two columns present
unimodal visual results.
Unimodal auditory across 5 noise levels Bimodal synthetic lips across 5 noise levels Bimodal synthetic face across 5 noise levels
Unimodal
visual
Participants −19 dB −18 dB −16 dB −13 dB −11 dB −19 dB −18 dB −16 dB −13 dB −11 dB −19 dB −18 dB −16 dB −13 dB −11 dB Lips Face
1 0.07 0.04 0.30 0.26 0.41 0.41 0.37 0.56 0.56 0.70 0.41 0.52 0.70 0.74 0.74 0.41 0.48
2
0.00 0.19 0.11 0.22 0.37 0.37 0.33 0.41 0.70 0.67 0.52 0.41 0.44 0.78 0.63 0.41 0.33
3
0.07 0.07 0.00 0.26 0.11 0.15 0.15 0.11 0.30 0.26 0.19 0.22 0.30 0.22 0.37 0.15 0.19
4
0.11 0.04 0.26 0.19 0.44 0.44 0.37 0.44 0.67 0.70 0.41 0.48 0.56 0.59 0.67 0.48 0.52
5
0.04 0.15 0.15 0.30 0.52 0.22 0.26 0.37 0.52 0.44 0.33 0.33 0.48 0.56 0.63 0.19 0.41
6
0.04 0.00 0.19 0.26 0.41 0.48 0.52 0.48 0.52 0.74 0.52 0.67 0.81 0.70 0.85 0.59 0.52
7
0.04 0.04 0.19 0.22 0.44 0.15 0.37 0.56 0.56 0.48 0.44 0.48 0.56 0.48 0.74 0.30 0.44
8
0.04 0.07 0.07 0.22 0.37 0.15 0.26 0.26 0.56 0.52 0.22 0.41 0.48 0.56 0.59 0.30 0.30
Mean 0.05 0.08 0.16 0.24 0.38 0.30 0.33 0.40 0.55 0.56 0.38 0.44 0.54 0.58 0.65 0.35 0.40
at each of the 15 experimental conditions of 3 presentation
conditions times 5 noise levels. Thus, each of these 15 pro-
portions for each participant had 27 observations. Tables 1,
2,and3 give the overall accuracy scores for each partici-
pant under each of the 15 conditions for Experiments 1, 2,
and 3, respectively. These proportions were used to com-
pute both Sumby and Pollack’s [1]metric(1) for both the
synthetic face and the natural face and our derived metric
for the relative visual contribution (3). Tables 4, 5,and6
give Sumby and Pollack’s [1]metric(1) for both the test
and reference conditions for each participant across the three
experiments, respectively. An analysis of variance was car-
ried out on these scores with participants, experiments, and
noise level as factors. The Sumby and Pollack formula, given
by (1), tended to vary significantly across noise level for
both the test case, F(4, 140)
= 3.21, p<0.015; and the
reference case, F(4, 140)
= 11.62, p<0.001. This sig-
nificant difference as a function of noise level violates the
assumption that the Sumby and Pollack metric should be
independent of the overall level of performance. The in-
teraction of noise level with experiment was not signifi-
cant.
4.4. Test of the relative visual contribution metric
Tab les 4, 5,and6 also give our metric for the relative vi-
sual contribution (3). In contrast to the Sumby and Pollack
metric, however, our relative visual contribution metric did
not differ over noise levels, F(4, 140)
= 0.89. Nor did noise
level interact with experiments, F(8, 140)
= 0.88. It is some-
what surprising that our derived metric, which is based on
the Sumby and Pollack metrics of the test and reference con-
ditions, remained invariant across noise levels whereas the
Sumby and Pollack metrics did not. Even so, the invariance
of the derived metric is promising. We now turn to a new
type of analysis that incorporates performance in the visual-
only conditions.
5. EVALUATION BASED ON THE FUZZY LOGICAL
MODEL OF PERCEPTION (FLMP)
As described in Section 4.1, a speechreading condition was
actually included in the experiments: 27 CVs for the synthetic
face and 27 for the natural. If the FLMP gives a good descrip-
tion of the observed results, its parameter values can be used
to provide an index of the relative visual contribution. One of
Slim Ouni et al. 7
Table 3: Overall accuracy scores for each participant under each of the 15 conditions of Experiment 3. The last two columns present
unimodal visual results.
Unimodal auditory across 5 noise levels Bimodal natural lips across 5 noise levels Bimodal natural face across 5 noise levels
Unimodal
visual
Participants −19 dB −18 dB −16 dB −13 dB −11 dB −19 dB −18 dB −16 dB −13 dB −11 dB −19 dB −18 dB −16 dB −13 dB −11 dB Lips Face
1 0.07 0.11 0.07 0.19 0.52 0.52 0.52 0.59 0.85 0.67 0.70 0.67 0.67 0.85 0.85 0.56 0.56
2
0.11 0.04 0.19 0.30 0.56 0.52 0.59 0.48 0.56 0.70 0.48 0.63 0.63 0.70 0.78 0.44 0.59
3
0.04 0.11 0.22 0.44 0.33 0.56 0.44 0.52 0.63 0.63 0.52 0.56 0.67 0.81 0.74 0.44 0.44
4
0.00 0.22 0.11 0.37 0.52 0.59 0.63 0.74 0.81 1.00 0.63 0.78 0.81 0.85 0.89 0.52 0.74
5
0.04 0.11 0.26 0.30 0.37 0.67 0.67 0.74 0.78 0.89 0.74 0.67 0.81 0.85 0.96 0.52 0.56
6
0.22 0.15 0.19 0.41 0.52 0.56 0.56 0.78 0.81 0.81 0.63 0.67 0.70 0.78 0.81 0.59 0.48
7
0.15 0.11 0.26 0.52 0.59 0.70 0.63 0.78 0.78 0.89 0.74 0.74 0.81 0.74 0.85 0.74 0.70
8
0.15 0.11 0.26 0.48 0.63 0.67 0.70 0.74 0.93 0.85 0.74 0.63 0.81 0.93 0.93 0.70 0.63
9
0.11 0.15 0.11 0.26 0.33 0.56 0.63 0.63 0.59 0.81 0.63 0.63 0.81 0.89 0.74 0.52 0.63
10
0.15 0.07 0.30 0.33 0.44 0.70 0.59 0.67 0.85 0.93 0.70 0.74 0.63 0.89 0.89 0.67 0.59
11
0.11 0.26 0.11 0.52 0.52 0.78 0.70 0.63 0.93 0.96 0.74 0.85 0.81 0.89 1.00 0.63 0.81
12
0.19 0.11 0.22 0.48 0.44 0.59 0.74 0.78 0.67 0.85 0.74 0.70 0.74 0.85 0.89 0.70 0.85
13
0.11 0.07 0.11 0.33 0.56 0.56 0.48 0.59 0.78 0.81 0.56 0.48 0.67 0.78 0.93 0.56 0.56
14
0.11 0.11 0.15 0.33 0.41 0.70 0.67 0.78 0.85 0.93 0.70 0.78 0.70 0.93 0.89 0.70 0.70
15
0.07 0.07 0.19 0.30 0.44 0.44 0.70 0.67 0.63 0.74 0.63 0.67 0.67 0.78 0.85 0.48 0.59
16
0.11 0.04 0.11 0.48 0.33 0.74 0.81 0.70 0.78 0.85 0.70 0.81 0.93 0.93 0.85 0.74 0.74
17
0.07 0.07 0.19 0.30 0.44 0.44 0.70 0.67 0.63 0.74 0.63 0.67 0.67 0.78 0.85 0.48 0.59
18
0.07 0.15 0.07 0.37 0.56 0.52 0.52 0.67 0.81 0.70 0.67 0.70 0.74 0.85 0.89 0.52 0.63
19
0.11 0.19 0.30 0.44 0.59 0.70 0.81 0.85 0.93 0.93 0.78 0.85 0.78 0.85 0.93 0.63 0.70
20
0.11 0.15 0.19 0.52 0.44 0.67 0.85 0.78 0.89 0.81 0.52 0.67 0.70 0.89 0.89 0.63 0.63
Mean 0.11 0.12 0.18 0.38 0.48 0.61 0.65 0.69 0.77 0.83 0.66 0.70 0.74 0.84 0.87 0.59 0.64
Table 4: Sumby and Pollack’s [1]metric(1) for both the synthetic face and the natural face and our metric for the relative visual contribution
(3) for each participant in Experiment 1.
Visual contribution of the synthetic face
across 5 noise levels (1)
Visual contribution of the natural face across
5 noise levels (1)
Relative visual contribution across 5 noise
levels (3)
Participants 123451234512345
1 0.44 0.44 0.56 0.41 0.34 0.65 0.82 0.69 0.61 0.66 0.80 0.61 0.87 0.80 0.68
2
0.44 0.40 0.61 0.50 0.54 0.76 0.76 0.74 0.95 0.85 0.68 0.63 0.87 0.55 0.69
3
0.53 0.50 0.36 0.45 0.65 0.56 0.69 0.59 0.84 0.70 0.97 0.81 0.77 0.61 0.95
4
0.54 0.41 0.45 0.54 0.73 0.63 0.54 0.55 0.66 0.88 0.91 0.86 0.89 0.88 0.86
5
0.72 0.49 0.76 0.90 0.69 0.76 0.73 0.72 0.79 0.77 0.96 0.77 1.04 1.11 0.92
6
0.61 0.54 0.49 0.31 0.68 0.52 0.54 0.68 0.63 0.68 1.09 1.00 0.81 0.68 1.00
7
0.72 0.49 0.76 0.90 0.69 0.76 0.73 0.72 0.79 0.77 0.96 0.77 1.04 1.11 0.92
8
0.50 0.60 0.53 0.57 0.37 0.73 0.65 0.73 0.90 0.79 0.77 0.96 0.80 0.67 0.58
9
0.46 0.52 0.68 0.67 0.47 0.75 0.48 0.77 0.61 0.84 0.71 1.04 0.91 1.06 0.63
10
0.36 0.49 0.56 0.48 0.42 0.49 0.46 0.53 0.37 0.63 0.86 1.04 1.04 1.11 0.79
Mean 0.53 0.49 0.58 0.57 0.56 0.66 0.64 0.67 0.71 0.76 0.87 0.85 0.90 0.86 0.80
the best methods to test bimodal speech perception models,
as well as examining the psychological processes involved in
speech perception, is to systematically manipulate synthetic
auditory and animated visual speech in an expanded facto-
rial design. This paradigm is especially informative for defin-
ing the relationship between bimodal and unimodal condi-
tions and for evaluating a model’s specific predictions (see
Massaro et al. [27]). Across a range of studies comparing spe-
cific mathematical predictions (see Chen and Massaro [28];
Massaro [7, 27, 29]), the FLMP has been more successful
than other competitor models in accounting for the exper-
imental data.
Previous tests of the FLMP did not include both a syn-
thetic and a natural talker, and previous tests of intelligibility
8 EURASIP Journal on Audio, Speech, and Music Processing
Table 5: Sumby and Pollack’s [1]metric(1) for both the test and reference and our metric for the relative visual contribution (3)foreach
participant in Experiment 2.
Visual contribution of the lips across 5 noise
levels (1)
Visual contribution of the face across
5 noise levels (1)
Relative visual contribution across 5 noise
levels (3)
Participants 1234 5 12345123 4 5
1 0.37 0.34 0.37 0.41 0.49 0.37 0.50 0.57 0.65 0.56 1.00 0.69 0.65 0.62 0.88
2
0.37 0.17 0.34 0.62 0.48 0.52 0.27 0.37 0.72 0.41 0.71 0.64 0.91 0.86 1.15
3
0.09 0.09 0.11 0.05 0.17 0.13 0.16 0.30 −0.05 0.29 0.67 0.53 0.37 −1.00 0.58
4
0.37 0.34 0.24 0.59 0.46 0.34 0.46 0.41 0.49 0.41 1.10 0.75 0.60 1.20 1.13
5
0.19 0.13 0.26 0.31 −0.17 0.30 0.21 0.39 0.37 0.23 0.62 0.61 0.67 0.85 −0.73
6
0.46 0.52 0.36 0.35 0.56 0.50 0.67 0.76 0.60 0.75 0.92 0.78 0.47 0.59 0.75
7
0.12 0.34 0.46 0.44 0.07 0.42 0.46 0.46 0.33 0.54 0.28 0.75 1.00 1.31 0.13
8
0.12 0.20 0.20 0.44 0.24 0.19 0.37 0.44 0.44 0.35 0.61 0.56 0.46 1.00 0.68
Mean 0.26 0.27 0.29 0.40 0.29 0.35 0.39 0.46 0.44 0.44 0.74 0.66 0.64 0.68 0.57
Table 6: Sumby and Pollack’s [1]metric(1) for both the test and reference and our metric for the relative visual contribution (3)foreach
participant in Experiment 3.
Visual contribution of the lips across 5 noise
levels (1)
Visual contribution of the face across 5 noise
levels (1)
Relative visual contribution across 5 noise
levels (3)
Participants 123451234512345
1 0.48 0.46 0.56 0.81 0.31 0.68 0.63 0.64 0.81 0.69 0.71 0.73 0.87 1.00 0.46
2
0.46 0.57 0.36 0.37 0.32 0.42 0.62 0.54 0.57 0.50 1.11 0.93 0.66 0.65 0.64
3
0.54 0.37 0.38 0.34 0.45 0.50 0.51 0.58 0.66 0.61 1.08 0.73 0.67 0.51 0.73
4
0.59 0.53 0.71 0.70 1.00 0.63 0.72 0.79 0.76 0.77 0.94 0.73 0.90 0.92 1.30
5
0.66 0.63 0.65 0.69 0.82 0.73 0.63 0.74 0.79 0.94 0.90 1.00 0.87 0.87 0.88
6
0.44 0.48 0.73 0.68 0.60 0.53 0.61 0.63 0.63 0.60 0.83 0.79 1.16 1.08 1.00
7
0.65 0.58 0.70 0.54 0.73 0.69 0.71 0.74 0.46 0.63 0.93 0.82 0.94 1.18 1.15
8
0.61 0.66 0.65 0.87 0.60 0.69 0.58 0.74 0.87 0.81 0.88 1.13 0.87 1.00 0.73
9
0.51 0.56 0.58 0.45 0.72 0.58 0.56 0.79 0.85 0.61 0.87 1.00 0.74 0.52 1.17
10
0.65 0.56 0.53 0.78 0.88 0.65 0.72 0.47 0.84 0.80 1.00 0.78 1.12 0.93 1.09
11
0.75 0.60 0.58 0.85 0.92 0.71 0.80 0.79 0.77 1.00 1.06 0.75 0.74 1.11 0.92
12
0.49 0.71 0.72 0.37 0.73 0.68 0.66 0.67 0.71 0.80 0.73 1.07 1.08 0.51 0.91
13
0.51 0.44 0.54 0.67 0.57 0.51 0.44 0.63 0.67 0.84 1.00 1.00 0.86 1.00 0.68
14
0.66 0.63 0.74 0.78 0.88 0.66 0.75 0.65 0.90 0.81 1.00 0.84 1.14 0.87 1.08
15
0.40 0.68 0.59 0.47 0.54 0.60 0.64 0.59 0.69 0.73 0.66 1.05 1.00 0.69 0.73
16
0.71 0.80 0.66 0.58 0.78 0.66 0.80 0.92 0.87 0.78 1.07 1.00 0.72 0.67 1.00
17
0.40 0.68 0.59 0.47 0.54 0.60 0.64 0.59 0.69 0.73 0.66 1.05 1.00 0.69 0.73
18
0.48 0.44 0.64 0.70 0.32 0.64 0.65 0.72 0.76 0.75 0.75 0.67 0.90 0.92 0.42
19
0.66 0.76 0.79 0.88 0.83 0.75 0.81 0.69 0.73 0.83 0.88 0.94 1.15 1.20 1.00
20
0.63 0.82 0.73 0.77 0.66 0.46 0.61 0.63 0.77 0.80 1.37 1.35 1.16 1.00 0.82
Mean 0.56 0.60 0.62 0.64 0.66 0.62 0.65 0.68 0.74 0.75 0.92 0.92 0.93 0.87 0.87
as a function of noise level did not include a measure of the
intelligibility of visible speech (see Massaro [7]). The present
three experiments include these additional conditions, which
allow us to use the FLMP parameter values to assess dif-
ferences between test and reference conditions of the visual
channel.
The FLMP was fit to the average results from each of the
three exper iments, pooled across participants and vowel, as
a function of the test and reference conditions, the 5 noise
levels, and the nine consonants. The fit of these 1377 in-
dependent data points required 567 free parameters. The
FLMP did indeed give a good description of the results with
RMSDs of 0.0277, 0.0377, and 0.0254 for the 3 respective
fits.
Finally, when it provides a good description of the re-
sults, parameter values from the fit of the FLMP can be
Slim Ouni et al. 9
Table 7: Parameter values from the fit of the FLMP, indicating the visual support for the nine consonants pooled across participants and
vowel, as a function of the test and reference cases. The ratio gives the support from the test case divided by the support from the ideal case.
The RMSDs were 0.0277, 0.0377, and 0.0254 for the 3 respective fits.
Experiment 1 /p/ /l/ /t/ /θ/ /s/ /
//r/ /f//w/
Synthetic 0.999 0.400 0.944 0.832 0.916 0.987 0.492 0.996 0.606
Natural
0.999 0.902 0.949 0.999 0.836 0.999 0.336 0.998 0.997
Ratio 1 0.443 0.994 0.832 1.095 0.987 1.464 0.997 0.607
Experiment 2 /p/ /l/ /t/ /θ/ /s/ /
//r/ /f//w/
Lips only 0.999 0.506 0.351 0.995 0.403 0.811 0.611 0.996 0.558
Synthetic
1.000 0.653 0.410 1.000 0.767 0.992 0.787 0.944 0.574
Ratio 0.999 0.775 0.856 0.995 0.525 0.818 0.776 1.055 0.972
Experiment 3 /p/ /l/ /t/ /θ/ /s/ /
//r/ /f//w/
Lips only 1.000 0.944 0.832 0.997 0.793 0.997 0.344 0.952 0.940
Natural
1.000 0.942 0.973 1.000 0.849 0.985 0.316 0.845 0.978
Ratio 1.000 1.002 0.855 0.997 0.934 1.012 1.089 1.127 0.961
Table 8: Accuracy values for the nine consonants in the unimodal visual condition pooled across participants and vowel, as a function of
the test and reference cases. The ratio gives the support from the test case divided by the support from the ideal case.
Experiment 1 /p/ /l/ /t/ /θ/ /s/ /
//r/ /f//w/
Synthetic 0.967 0.133 0.400 0.367 0.367 0.700 0.400 1.000 0.367
Natural
1.000 0.633 0.367 0.667 0.300 0.933 0.133 0.900 0.967
Ratio 0.967 0.210 1.090 0.550 1.223 0.750 3.007 1.11 0.379
Experiment 2 /p/ /l/ /t/ /θ/ /s/ /
//r/ /f//w/
Lips only 0.500 0.167 0.250 0.333 0.208 0.333 0.292 0.792 0.292
Synthetic
0.625 0.083 0.083 0.417 0.167 0.625 0.375 0.833 0.375
Ratio 0.800 2.012 3.012 0.798 1.245 0.533 0.779 0.950 0.779
Experiment 3 /p/ /l/ /t/ /θ/ /s/ /
//r/ /f//w/
Lips only 0.783 0.450 0.433 0.767 0.250 0.650 0.250 0.850 0.867
Natural
0.833 0.517 0.417 0.833 0.300 0.683 0.233 0.950 0.917
Ratio 0.940 0.870 1.038 0.921 0.833 0.952 1.073 0.895 0.945
used to assess how well the test case does relative to the
ideal case. These values are readily interpretable. Table 7
gives parameter values from the fit of the FLMP, indicat-
ing the visual support for the nine consonants pooled across
participants a nd vowel, as a function of the reference case
and test case in the first two rows of each experiment, re-
spectively. The ratio in the third row of each experiment
gives the support from the test case divided by the sup-
port from the reference case. This ratio provides an index
of the quality of the synthetic face relative to the natural
face. As can be seen in the parameter values in Table 7, the
synthetic face Baldi in Experiment 1 provided fairly good
visiblespeechrelativetothereference.Theaverageratio
of the visible speech parameter values was 0.935 so that
one interpretation is that Baldi is about 93% as accurate as
a real face. We should note that this relative difference in
parameter values can produce a larger differenc e in over-
all performance because they are not linearly related. Thus,
in this case, the relative difference in parameter values is
much smaller than the relative difference in overall perfor-
mance.
The individual ratios for the nine consonants also pro-
vide information about the quality of the synthetic speech
for the individual segments. For example, /l/ and /w/ were
most poorly articulated by the synthetic face relative to the
natural face in Experiment 1. The segments /p, t, s,
∫
, f/,
however, are basically equivalent for the synthetic and nat-
ural face. The segment /r/, on the other hand, is actually
more intelligible with the synthetic than with the natural
face.
The parameter values also inform the outcomes of Ex-
periments 2 and 3. The face appears to add significantly to
the lips for the synthetic face (Experiment 2) with an average
ratio of 0.863. Only /p, f , w/ were about as informative with
just the synthetic lips as the full synthetic face.
10 EURASIP Journal on Audio, Speech, and Music Processing
1113161819
Unimodal
visual
SNRs (dB)
Presentation conditions
0
0.2
0.4
0.6
0.8
1
Overall proportional correct CVs
Experiment 1
Unimodal auditory
Bimodal synthetic face
Bimodal natural face
Figure 3: Overall proportional correct CVs across five noise levels
(SNR in dB) in three conditions: unimodal auditory, bimodal AV-
synthetic face, and bimodal AV-natural face. Error bars represent
the mean +/
− 1 standard deviation. The figure includes also visual-
only results.
On the other hand, the natural lips gave roughly equiv-
alent performance to the full natural face in Experiment 3,
with a ratio of 0.997. Only /t/ was better with the full natural
face than just the natural lips.
Tab le 8 gives the accuracy values for the nine conso-
nants in the unimodal v isual condition pooled across par-
ticipants and vowel, as a function of the test and reference
case. These results are mostly consistent with the parameter
values shown in Tab le 7.
6. DISCUSSION
Providing a metric to evaluate the effectiveness of an ani-
mated agent in terms of the intelligibility of its visible speech
is becoming important as there is an increasing number of
applications using these agents. We derived a metric based
on Sumby and Pollack’s [1] original metr ic, which allows the
comparison of an agent relative to a reference, and also pro-
pose a new metric based on the fuzzy logical model of per-
ception (FLMP) to describe the benefit provided by a syn-
thetic animated face relative to the benefit provided by a nat-
ural face. We tested the validity of these metrics in three ex-
periments. The new metric presented reasonable results. The
FLMP also gave a good description of the results.
Future studies should be aimed at implementing a wider
range of noise levels to produce larger performance differ-
ences.AscanbeseeninFigures3–5 and Tables 1–3,per-
1113161819
Unimodal
visual
SNRs (dB)
Presentation conditions
0
0.2
0.4
0.6
0.8
1
Overall proportional correct CVs
Experiment 2
Unimodal auditory
Bimodal synthetic lips
Bimodal synthetic face
Figure 4: Overall proportional correct CVs across five noise levels
(SNR in dB) in three conditions: unimodal auditory, bimodal AV-
synthetic lips, and bimodal AV-synthetic face. Error bars represent
the mean +/
− 1 standard deviation. The figure includes also visual-
only results.
formance under the auditory-only condition improved only
about 35% as noise level decreased. In the interim, we are
somewhat uneasy about accepting our derived metric as an
invariantmeasurebecauseitisderivedfrommeasuresthat
were found not to be invariant. Most generally, we believe
that an invariant measure will be difficult to derive from just
the bimodal conditions and the auditory-alone condition. A
visual-only condition adds significant information to the test
of any potential metric.
Since we measure the realism of our talking head through
comparison with natural speech, it is important to realize
that visual intelligibility varies even across natural talkers.
Lesner [30] provides a valuable review of the importance
of talker variability in speechreading accuracy. This v ariety
across talkers is easy enough to notice in simple face-to-face
conversations. Johnson et al. [31] found that different talkers
articulate the same VCV utterance in considerably different
ways. Kricos and Lesner [32] looked for large differences in
visual intelligibility, and tested six different talkers who could
be considered to represent the extremes in intelligibility be-
cause they were selected with this goal.
Observers were asked to speechread these six talkers, who
spoke single syllables and complete sentences. Significant dif-
ferences, but also some similarities, were found across talkers.
Viseme groups were determined using a hierarchical cluster-
ing analysis. All talkers had the distinctive viseme category
containing /p, b, m/. Four of the six talkers had the viseme
Slim Ouni et al. 11
1113161819
Unimodal
visual
SNRs (dB)
Presentation conditions
0
0.2
0.4
0.6
0.8
1
Overall proportional correct CVs
Experiment 3
Unimodal auditory
Bimodal natural lips
Bimodal natural face
Figure 5: Overall proportional correct CVs across five noise levels
(SNR in dB) in three conditions: unimodal auditory, bimodal AV-
natural lips, and bimodal AV-natural face. Error bars represent the
mean +/
−1 standard deviation. The figure includes also visual-only
results.
/θ, ð/; for one other talker /r, w/ was grouped with /θ, ð/;
and /θ, ð/ was not a distinctive viseme category for the sixth
talker. Four of the six talkers had a unique viseme category
/r, w/,whereas/r/ was grouped with /v, f/ for one of the
talkers.
Even with talkers who were chosen to represent extreme
differences in intelligibility, the actual speechreading scores
varied only by about 17% on consonant recognition. Gesi
et al. [33] studied four randomly chosen talkers, and found
that sp eechreading accuracy varied across only a smaller 5%
range. It was surprising that visual intelligibility differed so
little across the four talkers even though two of the four talk-
ers were nonnative speakers of English.
It may be the case that much of the variability inherent in
visible speech is overcome by perceivers. Montgomery and
Jackson [34] measured the videotaped images of four talkers
speaking 15 vowels and diphthongs. They found significant
differences across the four talkers, so that it was not possi-
ble to categorize the vowels simply based on a physical mea-
sure of overall lip opening. Given the good recognition per-
formance of human perceivers, however, there appears to be
sufficient information in the overall visible configuration to
overcome the variability across talkers. As Lesner observes,
perhaps visible speech perception involves a spatial normal-
ization analogous to the normalization used by listeners to
account for differences in frequency arising from vocal tract
length. Thus, in summary, we believe that it remains to be
demonstrated that talker variability is a significant bar rier to
the important contribution of visible speech to intelligibility.
The findings from our experiments contribute to the
growing literature on visible and bimodal speech perception.
Extant research has demonstrated that animated synthetic
talkers have not yet achie ved the accuracy of natural talk-
ers (see Beskow et al. [11]; Massaro [7]; Ouni et al. [20]).
Improvement in synthetic visible speech will be aided by re-
search on determining which components of the face are im-
portant for visible speech perception (see Beno
ˆ
ıt et al. [2];
Preminger et al. [35]; Summerfield [4]). We found that the
lips only were almost as effective as the full face for the nat-
ural face but much less so for the synthetic face. The expla-
nation of this difference between the natural and synthetic
face remains for future research. Another research, on the
other hand, indicates that information from the face other
than the mouth area can be used for visible speech percep-
tion (see Preminger et al. [ 35]). More generally, visible speech
synthesis offers a potentially valuable technique for system-
atically varying the components of the face to determine the
important cues for speechreading. This technique along with
improved metrics for quantifying the contribution of visible
speech should advance our understanding of speech percep-
tion.
ACKNOWLEDGMENTS
The research and writing of the paper were supported by the
National Science Foundation (Grants no. CDA-9726363, no.
BCS-9905176, and no. IIS-0086107), Public Health Service
(Grant no. PHS R01 DC00236), a Cure Autism Now Foun-
dation Innovative Technology Award, and the University of
California, Santa Cruz. We greatly appreciate the thorough
and insightful comments of the two anonymous reviewers.
REFERENCES
[1]W.H.SumbyandI.Pollack,“Visualcontributiontospeech
intelligibility in noise,” Journal of Acoustical Society of America,
vol. 26, no. 2, pp. 212–215, 1954.
[2] C. Beno
ˆ
ıt, T. Mohamadi, and S. Kandel, “Effects of phonetic
context on audio-visual intelligibility of French,” Journal of
Speech and Hearing Research, vol. 37, no. 5, pp. 1195–1203,
1994.
[3] A. Jesse, N. Vr ignaud, M. M. Cohen, and D. W. Massaro, “The
processing of information from multiple sources in simultane-
ous interpreting,” Interpreting, vol. 5, no. 2, pp. 95–115, 2000.
[4] A. Q. Summerfield, “Use of visual information for phonetic
perception,” P honetica, vol. 36, no. 4-5, pp. 314–331, 1979.
[5] G. Bailly, M. B
´
erar, F. Elisei, and M. Odisio, “Audiovisual
speech synthesis,” International Journal of Speech Technology,
vol. 6, no. 4, pp. 331–346, 2003.
[6] J. Beskow, Talking heads - models and applications for multi-
modal speech synthesis, Ph.D. thesis, Department of Speech,
Music and Hearing, KTH, Stockholm, Sweden, 2003.
[7] D. W. Massaro, Perceiving Talking Faces: From Speech Percep-
tion to a Behavioral Principle, MIT Press, Cambridge, Mass,
USA, 1998.
12 EURASIP Journal on Audio, Speech, and Music Processing
[8] M. Odisio, G. Bailly, and F. Elisei, “Tracking talking faces
with shape and appearance models,” Speech Communication,
vol. 44, no. 1–4, pp. 63–82, 2004.
[9] C. Pelachaud, N. I. Badler, and M. Steedman, “Generating fa-
cial expressions for speech,” Cognitive Science, vol. 20, no. 1,
pp. 1–46, 1996.
[10] D. W. Massaro, J. Beskow, M. M. Cohen, C. L. Fry, and T. Ro-
driguez, “Picture my voice: audio to visual speech synthesis
using artificial neural networks,” in Proceedings of Auditory-
Visual Speech Processing (AVSP ’99),D.W.Massaro,Ed.,pp.
133–138, Santa Cruz, Calif, USA, August 1999.
[11] J. Beskow, I. Karlsson, J. Kewley, and G. Salvi, “SYNFACE-a
talking head telephone for the hearing-impaired,” in Proceed-
ings of 9th International Conference on Computers Helping Peo-
ple with Special Needs (ICCHP ’04),K.Miesenberger,J.Klaus,
W. Zagler, and D. Burger, Eds., pp. 1178–1186, Paris, France,
July 2004.
[12] A. Bosseler and D. W. Massaro, “Development and evaluation
of a computer-animated tutor for vocabulary and language
learning in children with autism,” Journal of Autism and De-
velopmental Disorders, vol. 33, no. 6, pp. 653–672, 2003.
[13] D. W. Massaro and J. Light, “Improving the vocabulary of chil-
dren with hearing loss,” Volta Review, vol. 104, no. 3, pp. 141–
174, 2004.
[14] D. W. Massaro and J. Light, “Read my tongue movements:
bimodal learning to perceive and produce non-native speech
/r/ and /l/,” in Proceedings of the 8th European Conference on
Speech Communication and Technology (EUROSPEECH ’03),
pp. 2249–2252, Geneva, Switzerland, September 2003.
[15] D. W. Massaro and J. Light, “Using visible speech for training
perception and production of speech for hard of hearing in-
dividuals,” Journal of Speech, Language, and Hearing Research,
vol. 47, no. 2, pp. 304–320, 2004.
[16] C. Nass, Wired for Speech: How Voice Activates and Advances the
Human-Computer Relationship, MIT Press, Cambridge, Mass,
USA, 2005.
[17] M. M. Cohen, R. L. Walker, and D. W. Massaro, “Perception
of synthetic visual speech,” in Speechreading by Humans and
Machines: Models, Systems, and Applications,D.G.Storkand
M. E. Hennecke, Eds., pp. 153–168, Springer, Berlin, Germany,
1996.
[18] C. Siciliano, G. Williams, J. Beskow, and A. Faulkner, “Eval-
uation of a multilingual synthetic talking face as a commu-
nication aid for the hearing impaired,” in Proceedings of the
15th International Congress of Phonetic Science (ICPhS ’03),pp.
131–134, Barcelona, Spain, August 2003.
[19] B. LeGoff, T. Guiard-Marigny, M. M. Cohen, and C. Beno
ˆ
ıt,
“Real-time analysis-synthesis and intelligibility of talking
faces,” in Proceedings of the 2nd International Conference on
Speech Synthesis, Newark, NY, USA, September 1994.
[20] S. Ouni, M. M. Cohen, and D. W. Massaro, “Training Baldi
to be multilingual: a case study for an Arabic Badr,” Speech
Communication, vol. 45, no. 2, pp. 115–137, 2005.
[21] K. W. Grant and B. E. Walden, “Evaluating the articulation in-
dex for auditory-visual consonant recognition,” Journal of the
Acoustical Society of America, vol. 100, no. 4, pp. 2415–2424,
1996.
[22] L. E. Bernstein and S. P. Eberhardt, Johns Hopkins Lipread-
ing Corpus Videodisk Set, The Johns Hopkins University, Balti-
more, Md, USA, 1986.
[23] K. W. Grant and P. F. Seitz, “Measures of auditory-visual in-
tegration in nonsense syllables and sentences,” Journal of the
Acoustical Society of America, vol. 104, no. 4, pp. 2438–2450,
1998.
[24] K. W. Grant, B. E. Walden, and P. F. Seitz, “Auditory-visual
speech recognition by hearing-impaired subjects: consonant
recognition, sentence recognition, and auditory-visual inte-
gration,” Journal of the Acoustical Society of America, vol. 103,
no. 5, pp. 2677–2690, 1998.
[25] K. W. Grant and B E. Walden, “Predicting auditory-visual
speech recognition in hearing-impaired listeners,” in Proceed-
ings of the 13th International Congress of Phonetic Sciences,
vol. 3, pp. 122–129, Stockholm, Sweden, August 1995.
[26] D. W. Massaro and M. M. Cohen, “Tests of auditory-visual in-
tegration efficiency within the framework of the fuzzy logical
model of perception,” Journal of t he Acoustical Society of Amer-
ica, vol. 108, no. 2, pp. 784–789, 2000.
[27]D.W.Massaro,M.M.Cohen,C.S.Campbell,andT.Ro-
driguez, “Bayes factor of model selection validates FLMP,” Psy-
chonomic Bulletin and Revie w , vol. 8, no. 1, pp. 1–17, 2001.
[28] T. H. Chen and D. W. Massaro, “Mandarin speech perception
by ear and eye follows a universal principle,” Perception and
Psychophysics, vol. 66, no. 5, pp. 820–836, 2004.
[29] D. W. Massaro, “From multisensory integration to talking
heads and language learning,” in Handbook of Multisensory
Processes, G. Calvert, C. Spence, and B. E. Stein, Eds., pp. 153–
176, MIT Press, Cambridge, Mass, USA, 2004.
[30] S. A. Lesner, “The talker,” Volta Revie w , vol. 90, no. 5, pp. 89–
98, 1988.
[31] K. Johnson, P. Ladefoged, and M. Lindau, “Individual differ-
ences in vowel production,” Journal of the Acoustical Society of
America, vol. 94, no. 2, pp. 701–714, 1993.
[32] P. B. Kricos and S. A. Lesner, “Differences in visual intelligibil-
ity across talkers,” Volta Review, vol. 84, pp. 219–225, 1982.
[33] A. T. Gesi, D. W. Massaro, and M. M. Cohen, “Discovery and
expository methods in teaching visual consonant and word
identification,” Journal of Speech and Hearing Research, vol. 35,
no. 5, pp. 1180–1188, 1992.
[34] A. A. Montgomery and P. L. Jackson, “Physical characteristics
of the lips underlying vowel lipreading performance,” Journal
of the Acoustical Society of America, vol. 73, no. 6, pp. 2134–
2144, 1983.
[35] J. E. Preminger, H B. Lin, M. Payen, and H. Levitt, “Selective
visual masking in speechreading,” Journal of Speech, Language,
and Hearing Research, vol. 41, no. 3, pp. 564–575, 1998.