Báo cáo hóa học: " Image Quality Assessment Using the Joint Spatial/Spatial-Frequency Representation" potx
Bạn đang xem bản rút gọn của tài liệu. Xem và tải ngay bản đầy đủ của tài liệu tại đây (2.26 MB, 8 trang )
Hindawi Publishing Corporation
EURASIP Journal on Applied Signal Processing
Volume 2006, Article ID 80537, Pages 1–8
DOI 10.1155/ASP/2006/80537
Image Quality Assessment Using the Joint
Spatial/Spatial-Frequenc y Representation
Azeddine Beghdadi
1
and R
˘
azvan Iordache
2
1
L2TI-Institute Galil
´
ee, Universit
´
e Paris 13, 93430 Villetaneuse, France
2
GE Healthcare Technologies, 78530 Buc, France
Received 9 December 2004; Revised 20 December 2005; Accepted 9 March 2006
Recommended for Publication by Gonzalo Arce
This paper demonstrates the usefulness of spatial/spatial-frequency representations in image quality assessment by introducing a
new image dissimilarity measure based on 2D Wigner-Ville distribution (WVD). The properties of 2D WVD are shortly reviewed,
and the important issue of choosing the analytic i mage is emphasized. The WVD-based measure is shown to be correlated with
subjective human evaluation, which is the premise towards an image quality assessor developed on this principle.
Copyright © 2006 Hindawi Publishing Corporation. All rights reserved.
1. INTRODUCTION
Wigner-Ville distribution (WVD) has been proved to be a
powerful tool for analyzing the time-frequency characteris-
tics of nonstationary signals [1]. It is well established that
WVD-based signal analysis methods overcome the short-
comings of the traditional Fourier-based methods and that
it achieves high resolution in both domains.
While WVD is widely used in applications involving 1D
signals, the extension to multidimensional signals, in partic-
ular to 2D images has not reached a similar development
[2].TheuseofWVDforimageprocessingwasfirstsug-
gested by Jacobson and Wechsler [3]. It was shown that WVD
is a very efficient tool for capturing the essential nonsta-
tionary image structures [4, 5]. The interesting proper ties
of joint spatial/spatial-frequency representations of images
led to other applications of WVD to image processing, in
particular in image segmentation [6–10], demonstrating that
WVD-based methods provide high discriminating power for
signal representation. Indeed, WVD extracts the intrinsic lo-
cal spectral features of an image. On the basis of this knowl-
edge, the motivation behind the idea of using WVD for im-
age quality measure is that the extraction and evaluation of a
distortion in a given image could be expressed as a segmen-
tation problem.
This paper proposes the application of the WVD in ana-
lyzing and tracking image distortions for computing an im-
age quality measure. The properties of the 2D WVD and
some implementation aspects are briefly discussed.
With the increasing use of digital video compression and
transmission systems, image quality assessment has become
a crucial issue. In the last decade, there have been proposed
numerous methods for image distortion evaluation inspired
from the findings on human visual system (HVS) mecha-
nisms [11]. In the vision research community, it is generally
acknowledged that the early visual processing stages involve
the creation of a joint spatial/spatial-frequency representa-
tion [12]. This motivates the use of the WVD as a tool for
analyzing the effects induced by applying a distortion to a
given image.
Depending on the required information regarding the
original (nondistorted) image quality assessment techniques
can be grouped into three classes: the full-reference (FR),
the reduced reference (RR), and the nonreference (NR), also
called blind, approaches. For the FR methods, one needs the
original image; to evaluate the quality of the distorted image,
whereas RR methods require only a set of features extracted
from both the original and the degraded image. When a pri-
ori knowledge on the distortion nature is available and its
predictability is well understood, NR measures can be de-
veloped, where no information on the image reference is
needed.
Straightforward FR objective measures have been pro-
posed in the literature such as PSNR or weighted PSNR [13].
However, such metrics reflect the global properties of the im-
age quality but are inefficient in predicting structural degra-
dations. There is a real need to provide an objective image
quality metric consistent with subjective evaluation. Since
2 EURASIP Journal on Applied Signal Processing
image quality is subjective, the evaluation based on subjec-
tive experiments is the most accepted alternative. Unfortu-
nately, subject ive image quality assessment necessitates the
use of several procedures, which have been formalized by the
ITU recommendation [14].Theseproceduresarecomplex,
time consuming, and nondeterministic. It should be also no-
ticed that perfect correlation with the HVS could never be
achieved due to the natural variations in the subjective qual-
ity evaluation.
These drawbacks led to the development of other practi-
calandobjectivemeasures[11]. Basically, there are two ap-
proaches for quantitative image quality measure. The first
and more practical approach is the distortion-oriented, like
the MSE, PSNR, and other similar measures. However, for
this class of distortion measures, the quality metric does
not correlate with the subjective evaluation for many types
of degradations. The second class corresponds to the HVS-
modelling-oriented measures. Unfortunately, there is no sat-
isfying visual perception model that account for all the exper-
imental findings on the HVS. All the proposed models have
parameters, which depend on many environment factors and
require delicate tuning in order to correlate with the subjec-
tive assessment. Recently, a simple and practical measure has
been proposed by Wang et al. [15]. This objective measure
has been proved to be consistent with the HVS quality assess-
ment for some image degradations. However, this measure is
unstable in homogeneous regions.
This paper deals with FR image quality assessment. The
simple Wigner-based distortion measure introduced in this
paper does not take into account the masking effect. This fac-
tor will be introduced in a future work. The comparison of
the WVD-based measure with subjective human evaluation
and with other objective image quality measures is illustrated
through experimental results. This measure could be used for
image quality assessment, or as criterion for image coder op-
timization.
2. 2D WIGNER-VILLE DISTRIBUTION
The2DWVDW
f
(x, y, u, v)ofa2Dimage f (x, y) assigns to
any point (x, y) a 2D spatial-frequency spectr um [6]:
W
f
(x, y, u, v) =
R
2
f
x +
α
2
, y +
β
2
×
f
∗
x −
α
2
, y
−
β
2
e
− j2π(αu+βv)
dα dβ,
(1)
where x and y are the spatial coordinates, u and v are the
spatial frequencies, and the asterisk denotes complex conju-
gation.
The image can be reconstructed up to a sign ambiguit y
from its WVD:
f (x, y) f
∗
(0, 0) =
R
2
W
f
x
2
,
y
2
, u, v
e
j2π(xu+yv)
du dv.
(2)
Among the properties of 2D Wigner-Ville distribution,
the most important for image processing applications is that
it is always a real-valued function and, at the same time,
contains the phase information. The 2D Wigner-Ville dis-
tribution has many interesting properties related to trans-
lation, modulation, scaling, convolution, and localization in
spatial/spatial-frequency space, which motivate its use in im-
age analysis applications where the spatial/spatial-frequency
features of images are of interest. Ac tually, the WVD is of-
ten thought of as the image energy distribution in the joint
spatial/spatial-frequency domain. For a thoughtful descrip-
tion, the reader is referred to [6].
Due to its bilinear nature, the WVD of the sum of two
images f
1
and f
2
introduces an interference term, usually re-
garded as undesirable artifacts in image analysis applications.
Moreover,asarealimageismulticomponent,itsWVrepre-
sentation is polluted by interference artifacts and is therefore
difficult to interpret [5].
A cleaner spatial/spatial-frequency representation of a
real image is obtained by computing the WVD of the as-
sociated analytic image, which has such spectral properties
[16, 17]. An analytic image has a spectrum containing only
positive (or only negative) frequency components. For a re-
liable spatial/spatial-frequency representation of the real im-
age, the analytic image should be chosen so that (a) the useful
information from the 2D WVD of the real signal is found in
the 2D WVD of the analytic image, and (b) the 2D WVD of
the analyt ic image minimizes the interference effect.
In practical applications, the images are of finite support;
therefore it is appropriate to apply Wigner analysis to a win-
dowed version of the infinite support images. The effect of
the windowing is to smear the WVD representation in the
frequency plane only, so that the frequency resolution is de-
creased but the spatial resolution is unchanged.
Let f (n, m), (n, m)
∈ Z
2
be the discrete image obtained
by sampling f (x, y), adopting the convention that the sam-
pling period is normalized to unity in both directions. The
following notation is made:
K(m, n, r, s)
= w(r, s)w
∗
(−r, −s) f (m + r, n + s) f
∗
(m − r, n − s).
(3)
The 2D discrete windowed WVD is the straightforward
extension of the 1D case presented in [18],andisdefinedas
follows:
W
f
w
m, n, u
p
, v
q
= 4
L
r=−L
L
s=−L
K(m, n, r, s)W
rp+sq
4
,(4)
where N
= (2L +2),W
4
= e
− j4π/N
, and the normalized
spatial-frequency pair is (u
p
, v
q
) = (p/N, q/N). By making a
periodic extension of the kernel K(m, n, r, s), for fixed (m, n),
(4) can be transformed to match the standard form of a 2D
DFT, except that the twiddle factor is W
4
instead of W
2
(see
[18] for additional details for 1D case; the 2D construction
is a direct extension). Thus standard FFT algorithms can be
used to calculate the discrete W
f
w
. The additional power of
two represents a scaling along the frequency axes, and can be
neglected in the calculations.
A. Beghdadi and R. Iordache 3
The properties of the discrete WVD are similar to the
continuous WVD, except for the per iodicity in the frequency
variables, which is one-half the sampling frequency in each
direction. Therefore, if f (x, y) is a real image, it should be
sampled at twice the Nyquist rate to avoid aliasing effects in
W
f
w
(m, n, u
p
, v
q
).
As the real-scene images have rich frequency content, the
interference cross-terms may mask the useful components
contribution. Therefore a commonly used method to reduce
the interference in image analysis applications is to smooth
the 2D discrete-windowed WVD in the spatial domain using
a smoothing window h(m, n). The price to pay is the spatial
resolution reduction. The result is the so-called 2D discrete
pseudo-Wigner distribution (PWD), which, for a symmetric
frequency window (w(r, s)
= w(−r, −s)), is defined as [4]
PW
f
m, n, u
p
, v
q
=
M
k=−M
M
=−M
h(k, )W
f
w
m + k, n + , u
p
, v
q
=
4
L
r=−L
L
s=−L
w(r, s)
2
W
rp+sq
4
×
M
k=−M
M
=−M
h(k, ) f (m + k + r, n + + s)
× f
∗
(m + k − r, n + − s).
(5)
A very important aspect to take into account when using
PWD is the choice of w(r, s)andh(k, ). The size of the first
window, w(r, s), is dictated by the resolution required in the
spatial-frequency domain. The spectral shape of the window
should be an approximation of the delta function that opti-
mizes the compromise between the central lobe’s width and
the side lobes’ height. A window that complies with these de-
mands is the 2D extension of Kaiser window, which was used
in [4]. The role of the second window, h(k, ), is to allow
spatial averaging. Its size determines the degree of smooth-
ing. The larger the size is, the lower the spatial resolution
becomes. The common choice for this window is the rect-
angular window.
In the discrete case, there is an additional specific require-
ment when choosing the analytic image: the elimination of
the aliasing effec t. Taking into account that all the informa-
tion of the real image must be preserved in the analytic im-
age, only one analytic image cannot fulfill both requirements.
Therefore, either one analytic image is used and some alias-
ing is allowed or more a nalytic images are employed which
obey two restrictions, (a) the real image can be perfectly re-
constructed from the analytic images, and (b) each analytic
image is alias-free with respect to WVD. To avoid aliasing, a
solution is to use two analytic images, obtained by splitting
the region of support of the half-plane analytic image into
two equal area subregions [19, 20]. Although this method
requires the computation of two WVD, no aliasing artifacts
appear. The WVD of the analytic images can be combined
to produce the so-called full-domain PWD [19], which is
a spatial/spatial-frequency representation of the real image
having the same frequency resolution and support as the
original real image. This approach was successfully applied
in texture analysis and segmentation in [7].
Employing the analytic images z
1
and z
2
described
in [20], a full-domain PWD of the real image f (m, n),
FPW
f
(m, n, u
p
, v
q
), can be constructed from PW
z
1
(m, n,
u
p
, v
q
)andPW
z
2
(m, n, u
p
, v
q
). In the spatial-frequency do-
main, the full-domain PWD is, by definition, of periodicity
1 and symmetric with respect to the origin, as the WVD of a
real image. It is completely specified by:
FPW
f
m, n, u
p
, v
q
=
⎧
⎪
⎪
⎪
⎨
⎪
⎪
⎪
⎩
PW
z
1
m, n, u
p
, v
q
,0≤ u
p
<
1
2
,0<v
q
<
1
2
,
PW
z
2
m, n, u
p
, v
q
,0≤ u
p
<
1
2
,0>v
q
≥−
1
2
,
FPW
f
m, n, u
p
,0
=
PW
z
1
m, n, u
p
,0
+ PW
z
2
m, n, u
p
,0
,0≤ u
p
<
1
2
,
FPW
f
m, n, u
p
, v
q
=
FPW
f
m, n, −u
p
, −v
q
,0>u
p
, v
q
≥−
1
2
,
FPW
f
m, n, u
p
+ k, v
q
+ l
=
FPW
f
m, n, u
p
, v
q
, ∀k, l, p, q ∈ Z.
(6)
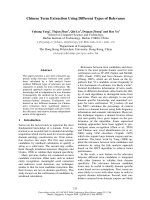
Figure 1 illustrates the construction of the full-domain
PWD from the PWDs of the single-quadrant analytic images.
The same shading identifies identical regions, and the letters
are used to follow the mapping of frequency regions of the
real image. For instance, the region labeled A in (f) represents
the mapping of the region A in the real image spectrum (a)
on the spatial-frequency domain of the full-domain PWD.
A potential drawback of this approach is that the additional
sharp filtering boundaries may introduce r inging effects.
3. AN IMAGE DISSIMILARITY MEASURE BASED ON
2D WIGNER-VILLE DISTRIBUTION
It is well known that distortion like a regular pattern or
a spike is more visible than distortion “diluted” through
the image. Between two distortions with the same energy,
that is, same peak signal-to-noise-ratio (PSNR), the more
disturbing is the one having a peaked energy distribution
in spatial/spatial-frequency plane. The “annoying” distor-
tions are usually highly concentrated in the spatial/spatial-
frequency domain. Therefore it seems promising to analyze
the quality of a distorted image by looking at its energy dis-
tribution in the joint spatial/spatial-frequency domain.
In terms of the effect on the WVD, the noise added to
an image influences not only the coefficients in the posi-
tions where the noise has nonzero WVD coefficients, but
4 EURASIP Journal on Applied Signal Processing
AB
CD
EF
GH
v
u
1/2
−1/2
−1/21/2
(a)
AB
CD
v
u
1/2
−1/2
−1/21/2
(b)
EF
GH
v
u
1/2
−1/2
−1/21/2
(c)
AB
CD
v
u
1/4
−1/4
−1/41/4
(d)
EF
GH
v
u
1/4
−1/4
−1/41/4
(e)
AB
CD
EF
GH
v
u
1/2
−1/2
−1/21/2
(f)
Figure 1: Full-domain WVD computation using a single-quadrant analytic image pair. (a) Spectrum of the real image. (b) Spectrum of the
upper-right-quadrant analytic image. (c) Spectrum of the lower-right-quadrant analytic image. (d) Spatial-frequency support of WVD of
(b). (e) Spatial-frequency support of WVD of (c). (f) Spatial-frequency support of the full-domain WVD obtained from (d) and (e).
Original
image
Form analytic
image
2D-PWVD
Max
p,q
m,n
Ratio
PSNR
w
Distorted
image
Form analytic
image
2D-PWVD
+
−
Max
p,q
m,n
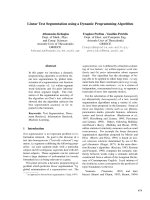
Figure 2: Construction of PSNR
W
.
also induces cross-interference terms. The stronger the noise
WVD coefficients are, the more important the differences be-
tween the noisy image WVD and original image WVD be-
come.
The image quality metric proposed herein is an alterna-
tive based on the WVD to the classical PSNR. WVD-based
PSNR of a distorted version g(m, n) of the original discrete
image f (m, n)isdefinedas(seeFigure2)
PSNR
W
= 10 log
10
m
n
max
p,q
FPW
f
m, n, u
p
, v
q
m
n
max
p,q
FPW
f
m, n, u
p
, v
q
−
FPW
g
m, n, u
p
, v
q
. (7)
A. Beghdadi and R. Iordache 5
(a) f (b) g
1
(PSNR= 23.70, PSNR
W
= 21.70)
(c) g
2
(PSNR= 23.74, PSNR
W
= 17.66) (d) g
3
(PSNR= 23.70, PSNR
W
= 14.07)
Figure 3: Distorted versions of 256 × 256 pixel Parrot image, f : g
1
is obtained by adding white Gaussian noise on f ; g
2
isaJPEGreconstruc-
tion of f ,withaqualityfactorof88;g
3
is the result of imposing a grid-like interference over f . The PSNR and PSNR
W
values are given in
dB.
The 4D PWD reduces to a 2D function of spatial-fre-
quency variables, which can be interpreted as the local
spatial-frequency spectrum of the image at that point. So
with the 2D PWD, a local spatial form in an image can be
related to some spatial-frequency characteristics in the trans-
form domain.
The use of maximum difference power spectrum as a
nonlinearity transformation is motivated and inspired by
some findings on the nonlinearity of the HVS. Similar trans-
formations have been successfully used to model intracorti-
cal inhibition in the primary visual cortex in an HVS-based
method for texture discrimination [21].
For each position (m, n), the highest energy WVD com-
ponent is retained, as if the contribution of the other compo-
nents are masked by it. Of course, the masking mechanisms
are much more complex, but this coarse approximation leads
to results which a re more correlated to the HVS perception
than PSNR. Among the masking models available in the lit-
erature, there is no one single model that takes into account
for all masking phenomena in HVS. Nevertheless, there are
well-established masking models [22, 23] that require a band
limited decomposition of the visual signal, so they cannot be
directly applied to the current approach. Their adaptation to
the WVD representation is a difficult challenge.
Let η
1
and η
2
be two degradations having the same en-
ergy. The first, η
1
, is additive w hite Gaussian noise, and the
second, η
2
, is an interference pattern. While the energy of the
noise is evenly spread in the spatial/spatial-frequency plane,
the energy of the structured degradation is concentrated in
the frequency band of the interference. Thus the WVD of η
2
contains terms which have absolute values larger than any
term of WVD of η
1
, as the two degradations have the same
energy. These peak terms induce larger local differences be-
tween WVD of g
2
= f + η
2
and WVD of f , which are cap-
tured by “max” operation in the denominator of (7)andlead
to a smaller PSNR
W
for g
2
.
3.1. Results and discussion
To show the interest of the proposed image distortion mea-
sure as compared to the PSNR, two examples are presented:
Figure 3 illustrates a 256
× 256 pixel image and its degraded
versions by additive white noise, by an interference pattern,
and, respectively, by JPEG coding-decoding, yielding almost
6 EURASIP Journal on Applied Signal Processing
(a) f (b) g
1
(PSNR = 19.81, PSNR
W
= 18.61)
(c) g
2
(PSNR = 19.83, PSNR
W
= 14.64) (d) g
3
(PSNR = 19.85, PSNR
W
= 12.79)
Figure 4: Distorted versions of 256 × 256 pixels Peppers image, f : g
1
is obtained by adding “salt and pepper” noise, g
2
is a blurred version,
and g
3
is a JPEG reconstruction. The PSNR and PSNR
W
values are given in dB.
Table 1: Observer ranking and image quality metrics for the dis-
torted versions of Parrot image in Figure 3.
Gaussian noise JPEG Grid pattern
Observer ranking 1 2 3
PSNR [dB] 23.70 23.74 23.70
SSIM index 70% 82.8% 87%
PSNR
WAV
[dB] 30.63 29.33 25.75
PSNR
W
[dB] 21.70 17.66 14.07
the same PSNR; in Figure 4, a second 256 × 256 pixel im-
age and its corrupted versions by “salt and pepper” noise, by
blurring, and, respectively, by JPEG coding-decoding, yield-
ing almost the same PSNR.
In both cases, five nonexpert readers were asked to rank
the images (including the original) in decreasing order of
perceived quality. All readers gave the same ranking, with the
original image on top position (rank 0). The ranking for the
distorted images is presented in Table 1 for Parrot image and
in Table 2 for Peppers image, together with the WVD-based
distortion measure. In both examples, the WVD-based dis-
Table 2: Observer ranking and image quality metrics for the dis-
torted versions of Peppers image in Figure 4.
“Salt and pepper” noise Blur JPEG
Observer ranking 1 2 3
PSNR [dB] 19.80 19.83 19.84
SSIM index 80.9% 80.6% 72.2%
PSNR
WAV
[dB] 23.45 21.74 21.32
PSNR
W
[dB] 18.61 14.64 12.79
tortion measure is correlated with the subjective quality eval-
uation.
For the example shown in Figure 3, the observers prefer
the white noise distorted image to the interference-perturbed
image and to the JPEG-coded image. The reason is that for
random degradation, the noise has the same effect in the en-
tire spatial-frequency plane. Therefore, the maximum spec-
tral difference at almost any spatial position is lower than
the just noticeable perceptual difference. On the other hand,
when the distortion is localized (as interference patterns or
distortion induced by JPEG coding), the maximum spectral
A. Beghdadi and R. Iordache 7
difference corresponding to an important proportion of the
pixels has a significant value, much larger than the just no-
ticeable perceptual difference.
Regarding the images in Figure 4, the ordering provided
by the observers, from highest to poorest visual quality,
corresponds to ranking the images in decreasing order of
PSNR
W
. As for the additive white noise, the power of “salt
and pepper” noise is evenly spread over the entire spatial-
frequency plane, and the maximum spectral difference at al-
most any spatial position is lower than the just noticeable
perceptual difference. As blurring corresponds to low-pass
filtering, the spectral differences between the original (see
Figure 4(a)) and the blurred image (see Figure 4(b)) are im-
portant at high frequencies, where the signal power is weaker.
For comparison, the wavelet-based PSNR (see [24]),
PSNR
WAV
, and the structural similarity index (see [15]),
SSIM, are computed in Tables 1 and 2. The SSIM is in con-
tradiction with the observer rating for Figure 3 and in agree-
ment for Figure 4.ThePSNR
WAV
is correlated with the ob-
server rating for the two examples, but PSNR
W
is better in
discriminating the image quality of the distortions.
When computing the PSNR
WAV
, one should perform the
nonlinear (max) operation at the different scales, making the
measure scale-dependent as expected from the HVS point of
view. Moreover, it is pointed out in [24], that the choice of the
wavelets, like, for example, biorthogonal 9/7 wavelets against
cubic spline wavelets, affects the behavior of the PSNR
WAV
.
Regarding the SSIM, it is known that this measure is un-
stable in homogeneous regions [15]. Moreover, the SSIM
does not take into account the frequency content of the image
which plays an important role in the discrimination between
spatial structures.
Herein, the objective is to propose an alternative to the
standard PSNR, which is independent of the observation dis-
tance (and of the observer, in general). Another reason for
using the WVD is its perfect spatial-frequency resolution and
localization in the joint spatial/spatial-frequency space, so
that all frequencies and all location can be analyzed indepen-
dently, respectively. Furthermore, in contr a st to the wavelet
transform, the WVD does not require a scale-window func-
tion.
One of the main t rade-offs of using this type of joint rep-
resentation is the high dimensionality of the data to be pro-
cessed. This may prevent the VWD-based measure to be ap-
plied to real-time applications, like video qualit y control, but
is of no concern for off-line processes such as comparing still
image compression methods or noise filtering methods. Nev-
ertheless, efficient algorithms for computing the WVD are
already available [18, 25]. Moreover, it is the authors’ belief
that a fast implementation of the WVD is possible by using
the huge computational power of the state-of-the-art graphic
cards.
4. SUMMARY AND CONCLUSIONS
This paper considers the 2D WVD in the framework of im-
age analysis. The advantages and drawbacks of this spatial/
spatial-frequency analysis tool are recalled in the light of
some pioneer and recent works in this field.
The usefulness of the WVD in image analysis is demon-
strated by considering a particular application, namely, dis-
tortion analysis. In this respect, a new i mage distortion mea-
sure is defined. It is calculated using the spatial/spatial-
frequency representation of images obtained using 2D WVD.
The efficiency of this measure is validated through exper-
iments and informal visual quality assessment tests. It is
shown that this measure represents a promising tool for
objective measure of image quality, although the masking
mechanisms are neglected. To improve the reliabilit y and the
performance of the proposed method, a refinement to in-
clude a masking model is imper atively needed.
It can be concluded that, taking into consideration some
basic, well-established knowledge on the HVS (the joint
spatial/spatial-frequency representation, a nd nonlinear inhi-
bition models), one can develop a simple image distortion
measure correlated with the perceptual evaluation.
REFERENCES
[1] S. Qian and D. Chen, Joint Time-Frequency Analysis: Methods
and Applications, Prentice-Hall, Upper Saddle River, NJ, USA,
1994.
[2] B. Boashash, Ed., Time-Frequency Signal Analysis and Process-
ing: A Comprehensive Reference, Elsevier, Oxford, UK, 2003.
[3] L. Jacobson and H. Wechsler, “The Wigner distribution as a
tool for deriv ing an invariant representation of 2-D images,”
in Proceedings of the International Conference on Pattern Recog-
nition and Image Processing, pp. 218–220, Las Vegas, Nev, USA,
June 1982.
[4] T.R.ReedandH.Wechsler,“Segmentationoftexturedimages
and Gestalt organization using spatial/spatial-frequency rep-
resentations,” IEEE Transactions on Pattern Analysis and Ma-
chine Intelligence, vol. 12, no. 1, pp. 1–12, 1990.
[5]Y.M.Zhu,R.Goutte,andM.Amiel,“Ontheuseoftwo-
dimensional Wigner-Ville distribution for texture segmenta-
tion,” Signal Processing, vol. 30, no. 3, pp. 329–353, 1993.
[6] L. Jacobson and H. Wechsler, “Joint spatial/spatial-frequency
representation,” Signal Processing, vol. 14, no. 1, pp. 37–68,
1988.
[7] G. Crist
´
obal and J. Hormigo, “Texture segmentation through
eigen-analysis of the Pseudo-Wigner distribution,” Pattern
Recognition Letters, vol. 20, no. 3, pp. 337–345, 1999.
[8] S. Stankovic, I. Djurovic, and I. Pitas, “Watermarking in
the space/spatial-frequency domain using two-dimensional
Radon-Wigner distribution,” IEEE Transactions on Image Pro-
cessing, vol. 10, no. 4, pp. 650–658, 2001.
[9] R. Iordache and A. Beghdadi, “A Wigner-Ville distribution-
based image dissimilarity measure,” in Proceedings of the 6th
International Symposium on Signal Processing and Its Applica-
tions (ISSPA ’01), vol. 2, pp. 430–433, Kuala Lumpur, Malaysia,
August 2001.
[10] S. Gabarda and G. Crist
´
obal, “On the use of a joint spatial-
frequency representation for the fusion of multi-focus im-
ages,” Pattern Recognition Letters, vol. 26, no. 16, pp. 2572–
2578, 2005.
[11] “Special issue on image quality assessment,” Signal Processing,
vol. 70, 1998.
[12] M. A. Garc
´
ıa-P
´
erez and V. Sierra-V
´
azquez, “Visual processing
in the joint spatial/spatial-frequency domain,” in Visual Mod-
els for Target Detection and Recognition, E. Peli, Ed., pp. 16–62,
World Scientific, Hackensack, NJ, USA, 1995.
8 EURASIP Journal on Applied Signal Processing
[13] A. M. Eskicioglu and P. S. Fisher, “Image quality measures
and their performance,” IEEE Transactions on Communica-
tions, vol. 43, no. 12, pp. 2959–2965, 1995.
[14] ITU-R Recommendation BT.500-7, Methodology for the Sub-
jective Assessment of the Quality of Television Pictures,ITU,
Geneva, Switzerland, 1995.
[15] Z. Wang, L. Lu, and A. C. Bovik, “Video quality assessment
based on structural distortion measurement,” Signal Process-
ing: Image Communication, vol. 19, no. 2, pp. 121–132, 2004,
special issue on “Objective video quality metrics”.
[16] T. B
¨
ulow and G. Sommer, “A novel approach to the 2d analytic
signal,” in Proceedings of the 8th International Conference on
Computer Analysis of Images and Patterns (CAIP ’99), pp. 25–
32, Ljubljana, Slovenia, September 1999.
[17] S. L. Hahn, “Multidimensional complex signals with single-
orthant spectra,” Proceedings of the IEEE, vol. 80, pp. 1287–
1300, 1992.
[18] B. Boashash and P. J. Black, “An efficient real-time implemen-
tation of the Wigner-Ville distribution,” IEEE Transactions on
Acoustics, Speech, and Signal Processing, vol. 35, no. 11, pp.
1611–1618, 1987.
[19] J. Homigo and G. Cristobal, “High resolution spectral anal-
ysis of images using the pseudo-Wigner distribution,” IEEE
Transactions on Signal Processing, vol. 46, no. 6, pp. 1757–1763,
1998.
[20] R. Iordache and A. Beghdadi, “Single-quadrant analytic im-
ages for 2-D discrete Wigner distribution,” in Proceedings of the
8th International Workshop on Systems, Signals and Image Pro-
cessing (IWSSIP ’01), pp. 163–166, Bucharest, Romania, June
2001.
[21] J. Malik and P. Perona, “Preattentive texture discrimination
with early vision mechanisms,” Journal of the Optical Society
of America, vol. 7, no. 5, pp. 923–932, 1990.
[22] A. B. Watson and J. A. Solomon, “Model of visual contrast gain
control and pattern masking,” Journal of the Optical Society of
America A: Optics and Image Science, and Vision, vol. 14, no. 9,
pp. 2379–2391, 1997.
[23] P. C. Teo and D. J. Heeger, “Perceptual image distortion,” in
Proceedings of the 1st IEEE International Conference on Image
Processing, vol. 2, pp. 982–986, Austin, Tex, USA, November
1994.
[24] A. Beghdadi and B. Pesquet-Popescu, “A new image distortion
measure based on wavelet decomposition,” in Pro ceedings o f
the 6th International Symposium on Signal Processing and Its
Applications (ISSPA ’03), vol. 1, pp. 485–488, Paris, France,
July 2003.
[25] R. S. Sundaram and K. M. M. Prabhu, “Numerically stable al-
gorithm for computing Wigner-Ville distribution,” IEE Pro-
ceedings - Vision, Image, and Signal Processing, vol. 144, no. 1,
pp. 46–48, 1997.
Azeddine Beghdadi is presently Full Pro-
fessor at the University of Paris 13 (Insti-
tut Galil
´
ee) and a Researcher at L2TI lab-
oratory where he does all his research in
image and video processing. He obtained
his “Maitrise” in physics, and Diplome
d’Etudes Approfondies (Master’s degree) in
optics and signal processing from Univer-
sity Orsay-Paris XI in June 1982 and June
1983, respectively. He also obtained his
Ph.D. degree in physics (optics and signal processing) from Uni-
versity Paris 6 in June 1986. He worked at different places including
the “Groupe d’Analyse d’Images Biom
´
edicales” (CNAM Paris) and
“Laboratoire d’Optique des Solides” (University of Paris 6). From
1987 to 1989, he has been an “Assistant Associ
´
e” (Assistant Pro-
fessor) at University Paris 13. During the period 1987–1998, he
was with LPMTM CNRS Laboratory working on scanning elec-
tron microscope (SEM) materials image analysis. He published
over than one hundred international refereed scientific papers. He
is a Funding Member of the L2TI laboratory. His research inter-
ests include image quality enhancement and assessment, compres-
sion, bio-inspired models for image analysis, and physics-based im-
age analysis. He has served as Conference Chair of ISSPA 2003,
and Technical Chair of ISSPA 2005. He also served as session or-
ganizer and a Member of the organizing and technical committees
for many IEEE conferences. He is Member of IEEE.
R
˘
azvan Iordache received the B.S. degree in
electrical engineering and the M.S. degree
in biomedical engineering from “Politech-
nica” University of Bucharest, Romania,
and the Ph.D. degree in information tech-
nology from Tampere University of Tech-
nology, Finland, in 1995, 1996, and 2001,
respectively. He is currently a Research En-
gineer with the Global Diagnostic X-ray
Imaging Division, GE Healthcare Technolo-
gies, Buc, France. His technical interests are in breast imaging, to-
mosynthesis, and medical image quality.