Báo cáo hóa học: " Research Article An Attention-Driven Model for Grouping Similar Images with Image Retrieval Applications" pptx
Bạn đang xem bản rút gọn của tài liệu. Xem và tải ngay bản đầy đủ của tài liệu tại đây (2.59 MB, 17 trang )
Hindawi Publishing Corporation
EURASIP Journal on Advances in Signal Processing
Volume 2007, Article ID 43450, 17 pages
doi:10.1155/2007/43450
Research Article
An Attention-Driven Model for Grouping Similar
Images with Image Retrieval Applications
Oge Marques,
1
Liam M. Mayron,
1
Gustavo B. Borba,
2
and Humber to R. Gamba
2
1
Department of Computer Science and Engineering, Florida Atlantic University, Boca Raton, FL 33431-0991, USA
2
Programa de P
´
os-Graduac¸
˜
ao em Engenharia El
´
etrica e Inform
´
atica Industrial, Universidade Tecnol
´
ogica Federal do Paran
´
a(UTFPR),
Curitiba, Paran
´
a 80230-901, Brazil
Received 1 December 2005; Revised 3 August 2006; Accepted 26 August 2006
Recommended by Gloria Menegaz
Recent work in the computational modeling of visual attention has demonstrated that a purely bottom-up approach to identify-
ing salient regions within an image can be successfully applied to diverse and practical problems from target recognition to the
placement of advertisement. This paper proposes an application of a combination of computational models of visual attention to
the image retrieval problem. We demonstrate that certain shortcomings of existing content-based image retrieval solutions can
be addressed by implementing a biologically motivated, unsupervised way of grouping together images whose salient regions of
interest ( ROIs) are perceptually similar regardless of the visual contents of other (less relevant) parts of the image. We propose a
model in which only the salient regions of an image are encoded as ROIs whose features are then compared against previously seen
ROIs and assigned cluster membership accordingly. Experimental results show that the proposed approach works well for several
combinations of feature extraction techniques and clustering algorithms, suggesting a promising avenue for future improvements,
such as the a ddition of a top-down component and the inclusion of a relevance feedback mechanism.
Copyright © 2007 Hindawi Publishing Corporation. All rights reserved.
1. INTRODUCTION
The dramatic growth in the amount of digital images avail-
able for consumption and the popularity of inexpensive
hardware and software for acquiring, storing, and distribut-
ing images have fostered considerable research activity in the
field of content-based image retriev al (CBIR) [1] during the
past decade [2, 3]. Simply put, in a CBIR system users search
the image repository providing information about the actual
contents of the image, which is often done using another im-
age as an example. A content-based search engine translates
this information in some way as to query the database (based
on previously extracted and stored indexes) and retrieve the
candidates that are more likely to satisfy the user’s request.
In spite of the large number of related papers, proto-
types, and several commercial solutions, the CBIR problem
has not been satisfactorily solved. Some of the open prob-
lems include the gap between the image features that can be
extracted using image processing algorithms and the seman-
tic concepts to which they may be related (the well-known
semantic gap problem [4–6], which can often be translated as
“the discrepancy between the query a user ideal ly would and
the one it actually could submit to an information retrieval
system” [7]), the lack of widely adopted testbeds and bench-
marks [8, 9], and the inflexibility and poor functionality of
most existing user interfaces, to name just a few.
Some of the early CBIR solutions extract global features
and index an image based on them. Other approaches take
into account the fact that, in many cases, users are search-
ing for regions or objects of interest as opposed to the entire
picture. This has led to a number of proposed solutions that
do not treat the image as a whole, but rather deal with por-
tions (regions or blobs) within an image, such as [10, 11], or
focus on objects of interest, instead [12]. The object-based
approach for the image retrieval problem has grown to be-
come an area of research referred to as object-based image
retrieval (OBIR) in the literature [12–14].
Object- and region-based approaches usually must rely
on image segmentation algorithms, which leads to a num-
ber of additional problems. More specifically, they must em-
ploy strong segmentation—“a division of the image data into
regions in such a way that region T contains the pixels of
the silhouette of object O in the real world and nothing else”
[3], which is unlikely to succeed for broad image domains.
A frequently used alternative to strong segmentation is weak
segmentation, in which “region T is within bounds of object
2 EURASIP Journal on Advances in Signal Processing
O, but there is no guarantee that the region covers all of the
object’s area” [3], leading to imperfect—but usually accept-
able for image retrieval purposes—results.
The limited success of CBIR solutions is further com-
pounded by the fact that supervised learning (and, option-
ally, associated image a nnotation)—which could lead to im-
proved efficiency and more accurate recognition results—is a
subjective, usually domain-dependent, time-consuming, and
expensive process, which makes it unrealistic for most real-
world applications.
Inthispaperanewmodeltoextractregionsofinterest
(ROIs) within an image is proposed. The architecture was in-
spired by the success of a recently developed computational
model of human visual attention [15], which provides im-
portant cues about the location of the most salient ROIs
within an image. These ROIs, once extracted, are then in-
dexed (based on their features) and clustered with other sim-
ilar ROIs that may have appeared in other images.
This paper is structured as fol lows: Section 2 reviews rel-
evant previous work in the fields of CBIR and computational
modeling of human visual attention. Section 3 presents an
overview of the proposed model and explains in detail its key
features and components. Section 4 describes experiments
performed with the current version of the prototype and dis-
cusses relevant results. Finally, Section 5 contains concluding
remarks and directions for future work.
2. BACKGROUND AND CONTEXT
This section reviews relevant previous work on two separate
areas brought together by the proposed model: CBIR sys-
tems and computational models of visual attention. We dis-
cuss the composition of a traditional CBIR system and how
and where the proposed work fits within that context. Addi-
tionally, we present background on computational models of
visual attention, particularly the model proposed by Itti et al.
[15] and one proposed by Stentiford [16].
2.1. CBIR systems
CBIR refers to the retrieval of images according to their con-
tent, as opposed to the use of keywords. The purpose of a
CBIR system is to retrieve all the images that are relevant to
a user query while retrieving as few nonrelevant images as
possible. Similarly to its text-based counterpart, an image re-
trieval system must be able to interpret the contents of the
documents (images) in a collection and rank them accord-
ing to a degree of relevance to the user query. The interpre-
tation process involves extracting semantic information from
the documents (images) and using this information to match
the user’s needs [17].
Figure 1 shows a block diagram of a generic CBIR system,
whose main components are the following [1].
(i) User interface: friendly graphical user interface (GUI)
that allows the user to interactively query the database,
browse the results, and view the retrieved images.
(ii) Query/search engine: collection of algorithms respon-
sible for searching the database according to the pa-
rameters provided by the user.
User
User interface
(querying,
browsing, viewing)
Query/search
engine
Visual
summaries
(thumbnails)
Digital
image
archive
Indexes
Feature
extraction
Figure 1: A generic CBIR architecture (adapted from [1]).
(iii) Digital image archive: repository of digitized (and usu-
ally compressed) images.
(iv) Visual summaries: representation of image in a concise
way, such as thumbnails.
(v) Indexes: pointers to images.
(vi) Feature extraction: process of extra cting (usually low-
level) features from the raw images and using them to
build the corresponding indexes.
Feature extraction is typically an offline process. Once it
has been performed, the database will contain the image files
themselves, possible simplified representations of each image
file, and a collec tion of indexes that act as pointers to the cor-
responding images [1].
The online interaction between a user and a CBIR system
is represented on the upper half of the diagram in Figure 1.
The user expresses his query using a GUI. That query is
translated and a s earch engine looks for the index that corre-
sponds to the desired image. The results are sent back to the
user in a way that should allow easy browsing, viewing, and
possible refinement of the query based on the partial results
[1].
Most CBIR systems allow searching the visual database
contents in several different ways, either alone or combined
[1].
(i) Interactive browsing: convenient to leisure users who
may not have specific ideas about the images they are
searching for. Clustering techniques can be used to or-
ganize visually similar images into groups and mini-
mize the number of undesired images shown to the
user.
(ii) Navigation with customized categories: leisure users
often find it very convenient to navi gate through a
subject hierarchy to get to the target subject and then
browse or search that limited subset of images.
(iii) Query by X, where “X”canbe[18]
(1) an image example: several systems allow the user
to specify an image (virtually anywhere in the In-
ternet) as an example and search for the images
Oge Marques et al. 3
that are most similar to it, presented in decreas-
ing order of similarity score. It is considered to
be the most classical paradigm of image search,
(2) a visual sketch: some systems provide users with
tools that allow drawing visual sketches of the
image they h ave in mind. Users are also allowed
to specify different weights for different features,
(3) specification of visual features: direct specifica-
tion of visual features (e.g., color, texture, shape,
and motion properties) is possible in some sys-
tems and might appeal to more technical users,
(4) a keyword or complete text: some image retrieval
systems rely on keywords entered by the user and
search for visual information that has been pre-
viously annotated using that (set of) keyword(s),
(5) a semantic class: where users specify (or navigate
until they reach) a category in a preexisting sub-
ject hierarchy.
Progress in CBIR has been fostered by recent research re-
sults in many fields, including (text-based) information re-
trie val, image processing and computer vision, visual data
modeling and representation, human-computer interaction,
multidimensional indexing, human visual perception, pat-
tern recognition, multimedia database organization, among
others [1].
CBIR is essentially different from the general image un-
derstanding problem. More specifically, it is usually suffi-
cient that a CBIR system retrieves similar—in some user-
defined sense—images, without fully interpreting its con-
tents. CBIR provides a new framework and additional chal-
lenges for computer vision solutions, such as the large data
sets involved, the inadequacy of strong segmentation, the key
role played by color, and the importance of extracting fea-
tures and using similarity measures that strike a balance be-
tween invariance and discriminating power [3].
Ultimately, effectiveCBIRsystemswillovercometwo
great challenges: the sensory gap and the semantic gap.The
sensory gap is “the gap between the object in the world
and the information in a (computational) description de-
rived from a recording of that scene” [3]. The sensory g a p
is comparable to the general problem of vision: how one can
make sense of a 3D scene (and its relevant objects) from (one
of many) 2D projections of that scene. CBIR systems usu-
ally deal w ith this problem by eliminating unlikely hypothe-
ses, much the same way as the human visual system (HVS)
does, as suggested by Helmholz and its constructivist follow-
ers [19].
The semantic gap is “the lack of coincidence between the
information that one can extract from the visual data and the
interpretation that the same data have for a user in a given sit-
uation” [3]. This problem has received an enormous amount
of attention in the CBIR literature (see, e.g., [4–6]) and is not
the primary focus of the paper.
Despite the large number of CBIR prototypes developed
over the past 15 years (see [20] for a survey), very few have
experienced widespread success or become popular commer-
cial products. One of the most successful CBIR solutions to
date, perception-based image retrieval (PBIR) [21], is also
among the first CBIR solutions to recognize the need to
address the problem from a perceptual perspective and it
does so using a psychophysical—as opposed to biological—
approach.
We claim that the CBIR problem cannot be solved in a
general way, but rather expect that specialized CBIR solu-
tions will emerge, each of which focused on certain types of
image repositories, users’ needs, and query paradigms. Some
of these will rely on keywords, which may be annotated in
a semiautomatic fashion, some will benefit from the use of
clusters and/or categories to group images according to visual
or semantic similarity, respectively, and a true image retrieval
solution should attempt to incorporate as many of those
modules as possible. Along these lines, Figure 2 shows how
the work reported in this paper (indicated by the blocks con-
tained within the L-shaped gray area) fits in a bigger image
annotation and retrieval system in which intelligent semi-
automatic annotation [22] and classical query-by-visual-
content [23] capabilities are also available to the end user.
The proposed model is applicable to image retr ieval sce-
narios where one or few ROIs are present in each image,
for example, semantically relevant objects against a back-
ground or salient by design objects (such as road signs, tennis
balls, emergency buttons, to name a few) in potentially busy
scenes. Some of the image retrieval tasks that will not benefit
from the work proposed in this paper—but that can never-
theless be addressed by other components of the entire image
retrieval solution (Figure 2)—include the ones in which the
gist of the scene is more closely related to its semantic mean-
ing, and there is no specific object of interest (e.g., a sunshine
scene). In this particular case, there is neurophysiological ev-
idence [24] that attention is not needed and therefore the
proposed model is not only unnecessary but also inadequate.
In a complete CBIR solution, these cases can be handled by
adifferent subsystem, focusing on global image properties,
and not relying on a saliency map.
2.2. Visual attention
There are many varieties of attention, but in this paper we
are interested in what is usually known as attention for per-
ception: the selection of a subset of information for further
processing by another part of the information processing sys-
tem. In the particular case of visual information, this c an be
translated as “looking at something to see what it is” [25].
It is not possible for the HVS to process an image entirely
in parallel. Instead, our brain has the ability to prioritize the
order the potentially most important points are attended to
when presented with in a new scene. The result is that much
of the visual information our eyes sense is discarded. Despite,
we are able to quickly gain remarkable insight into a scene.
The rapid series of movements the eyes make are known as
scanpaths [26]. This ability to prioritize our attention is not
only efficient, but critical to survival.
There are two ways attention manifests itself. Bottom-
up attention is rapid and involuntary. In general, bottom-up
4 EURASIP Journal on Advances in Signal Processing
Raw
images
Feature
extraction
Feature
vectors
Clustering Clusters
Ontologies Schemas
Keywords
Intelligent annotation tool
Query &
retrieval tool
Cluster
browsing tool
User
Figure 2: CBIR and related systems, highlighting the scope of this work.
processing is motivated by the stimulus presented [25]. Our
immediate reaction to a fast movement, bright color, or shiny
surface is performed subconsciously. Features of a scene that
influence where our bottom-up visual attention is directed
are the first to be considered by the brain and include color,
movement, and orientation, among others [15]. For exam-
ple, we impulsively shift our attention to a flashing light.
Complementing this is attention that occurs later, controlled
by top-down knowledge—what we have learned and can re-
call. Top-down processing is initiated by memories and past
experience [25]. Looking for a sp ecific letter on a keyboard or
the face of a friend in a crowd are tasks that rely on l earned,
top-down knowledge.
Both bottom-up and top-down factors contribute to how
we choose to focus our attention. However, the extent of their
interaction is still unclear. Unlike attention that is influenced
by top-down knowledge, bottom-up attention is a consistent,
nearly mechanical (but purely biological) process. In the ab-
sence of top-down knowledge, a bright red s top sign will in-
stinctively appear to be more salient than a flat, gray road.
Computational modeling of visual attention (Section 2.3)
has made the most progress interpreting bottom-up fac-
tors that influence attention whereas the integration of top-
down knowledge into these models remain an open prob-
lem. Because of their importance, emphasized by the fact
that bottom-up components of a scene influence our atten-
tion before top-down knowledge does [27] and that they can
hardly be overridden by top-down goals, the proposed work
focuses on the bottom-up influences on attention.
2.2.1. Attention and similarity
Retrieval by similarity is a central concept in CBIR systems.
Similarity is based on comparisons between several images.
One of the biggest challenges in CBIR is that the user seeks
semantic similarity but the CBIR system can only satisfy sim-
ilarity based on physical features [3].
The notion of similarity varies depending on whether at-
tentional resources have been allocated while looking at the
image. Santini and Jain [28] distinguish preattentive sim-
ilarity from attentive similarity: attentive similarity is de-
termined after stimuli have been interpreted and classified,
while preattentive similarity is determined without attempt-
ing to interpret the stimuli. They postulate that attentive
similarity is limited to the recognition process while pre-
attentive similarity is derived from image features [28].
Their work anticipated that preattentive (bottom-up)
similarity would play an important role in general-purpose
image databases before computational models of (bottom-
up) visual attention such as the ones described in Section 2.3
were available. For specialized, restricted databases, on the
other hand, the use of attentive similarity could still be con-
sidered adequate, because it would be equivalent to solving a
more constrained recognition problem.
2.2.2. Attention, perception, and context
Perception is sensory processing [25]. In terms of the visual
system, perception occurs after the energy (light) that bom-
bards the rods and cones in the eyes is encoded and sent to
specialized areas of the brain. Perceptual information is used
throughout to make important judgements about the safety
of a scene, to identify an object, or to coordinate physical
movements.
“Although the perceptual systems encode the environ-
ment around us, attention may be necessary for binding to-
gether the individual perceptual properties of an object such
Oge Marques et al. 5
as its color, shape and location, and for selecting aspects of
the environment for perceptual processes to act on” [25].
In a limited variety of tasks, such as determining the
gist of a scene, perception can occur without attention [24].
However, for most other cases, a ttention is a critical first step
in the process of perception.
Perception is not exclusively based on what we see. What
we perceive is also a direct result of our knowledge and what
we expect to see [30]. Many research studies have shown that
the perception of a scene or the recognition of its compo-
nents is strongly influenced by context information, such as
recent stimuli (priming)[31] and the expected position of an
object within a scene [32].
Specialized CBIR systems, by their nature, have a sense of
context in that the scope is limited. However, this is certainly
short of the ability to narrow the possible interpretations of
an image by dynamically choosing a context. The function
of nonspecialized CBIR systems may be loosely equated to
the gist of a scene task. The addition of information derived
from visual attention models to the CBIR scenario may signal
the beginning of a new array of opportunities to incorporate
context information into CBIR systems in a more realistic
way.
2.3. Biologically inspired computational models of
visual attention and applications
Several computational models of visual attention have been
proposed, and they are briefly described in [33]. However,
for the purpose of this paper, the two most relevant models
are those proposed by Itti et al. [15]andStentiford[16]. The y
are described in more detail in the following sections.
2.3.1. The Itti-Koch model of visual attention
The Itti-Koch model of visual attention considers the task of
attentional selection from a purely bottom-up perspective,
although recent efforts have been made to incorporate top-
down impulses [15]. The model generates a map of the most
salient points in an image, which will be henceforth referred
to as long-range saliency map, or simply saliency map.Color,
intensity, orientation, motion, and other features may be in-
cluded as features.
The saliency map produced by the model can be used in
several ways. In the work presented in this paper, we use the
most salient points as cues for identifying ROIs. In a related
work,Rutishauseretal.[34] apply the Itti-Koch model by
extracting a region around the most salient patch of an im-
age using region-growing techniques. Key points extracted
from the detected object are used for object recognition. Re-
peating this process after the inhibition of return has taken
place enables the recognition of multiple objects in a single
image. However, this technique limits the relative object size
(ROS)—defined as the ratio of pixels belonging to the object
and total number of pixels in the image—to a maximum of
5% [34].
The model has also been used in the context of object
recognition [35]. Navalpakkam and Itti have begun to extend
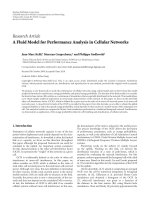
(a) (b) (c)
Figure 3: Comparison between Itti-Koch and Stentiford mod-
els of visual attention: (a) original image (from
.edu/imgdbs/ [29]); (b) Itti-Koch saliency map; (c) Stentiford visual
attention map.
the Itti-Koch model to incorporate top-down knowledge by
considering the features of a target object [36]. These features
are used to bias the saliency map. For instance, if one wants
to find a red object in a scene, the saliency map will be biased
to consider red more than other features.
The ability of the Itti-Koch saliency model to actually
predict human attention and gaze behavior has been ana-
lyzed elsewhere [37–40] and is not free of criticism. It is
easy to find cases where the Itti-Koch model does not pro-
duce results that are consistent with actual fixations. The
work of Henderson et al. documents one such instance where
the saliency map (and computational models of visual atten-
tion in general) do not share much congruence with the eye
saccades of humans [41]. However, this work adds the con-
straint that the visual task being measured is active search,
not free viewing. The Itti-Koch model was not initially de-
signed to include the top-down component that active search
and similar tasks require.
2.3.2. The Stentiford model of visual attention
The model of visual attention proposed by Stentiford [16]—
henceforth referred to as the Stentiford model of visual atten-
tion—is also a biologically inspired approach to CBIR tasks
[16]. It functions by suppressing areas of the image with pat-
terns that are repeated elsewhere. As a result flat surfaces
and textures are suppressed while unique objects are given
prominence. Regions are marked as high interest if they pos-
sess features not frequently present elsewhere in the image.
The result is a visual attention map that is similar in function
to the saliency map generated by Itti-Koch.
The visual attention map generated by Stentiford tends
to identify larger and smoother salient regions of an image,
as opposed to the more focused peaks in Itti-Koch’s saliency
map, as illustrated in Figure 3. Thus we apply the Stentiford’s
visual attention map to the segmentation, not detection, of
salient regions. This process is explained in more detail in
Section 3.3.2. Unfortunately, the tendency of the Stentiford
model to mark large regions can lead to poor results if these
regions are not salient. Itti’s model is much better in this re-
gard. By identifying the unique strengths and weaknesses of
each model we were able to construct our new method for
extracting regions of interest.
6 EURASIP Journal on Advances in Signal Processing
x
y
Figure 4: Matching neighborhoods x and y (adapted from [42]).
Figure 4 shows an example of how the Stentiford model
matches random neighborhoods of pixels. In this model, dig-
ital images are represented as a set of pixels, arranged in
a rectangular grid. Each pixel is assigned a visual attention
(VA) score. This process starts by creating a random pattern
of pixels to be sampled in the vicinity of the original pixel.
This neighborhood is compared to a different, randomly se-
lected neighborhood in the image. The deg ree of mismatch
between the neighborhoods forms the basis for the VA score
and the process continues. If the neighborhoods are identi-
cal, the VA score of a pixel will not change. As a result, the
highest scoring regions are those with the smallest degree of
similarity to the rest of the image. The reader is referred to
[42] for a more detailed explanation.
2.4. Related work
The use of computational models of visual attention in
CBIR-like applications has recently started and there are not
too many examples of related work in the literature. In this
section we briefly review three of them, which appear to be
most closely related to the solution proposed in this paper.
In [43], Boccignone et al. investigate how image retrieval
tasks can be made more effective by incorporating tempo-
ral information about the saccadic eye movements that a
user would have followed when viewing the image, effec-
tively bringing Ballard’s animate vision paradigm [44] to the
context of CBIR. They also use Itti-Koch’s model to com-
pute preattentive features which are then used to encode
an image’s visual contents in the form of a spatiotemporal
feature vector (or “signature”) known as information path
(IP). Similarity between images is then evaluated on a 5000-
image database using the authors’ IP matching algorithms.
The main similarities between their work and the approach
proposed in this paper are the use of Itti-Koch’s model to im-
plement (part of) the early vision stage and the application
domain (CBIR). The main differences lie in the fact that our
work, at this stage, relies on the long-range saliency map pro-
vided by Itti-Koch’s model and does not take the temporal
aspects of the scanpaths explicitly into account.
Stentiford and his colleagues have been studying the ap-
plication of visual attention to image retrieval tasks. While we
incorporate a part of the group’s work, the Stentiford model
of visual attention, into our new architecture, it is meaning-
ful to note related applications of this model. Bamidele and
Stentiford use the model to organize a large database of im-
ages into clusters [45]. This differs from our work in that no
salient ROIs are extracted.
Machrouh and Tarroux have proposed using attention
for interactive image exploration [46]. Their model uses past
knowledge to modulate the saliency map to aid in object
recognition. In some ways it is similar to the method pro-
posed in this work, but it has key differences. Machrouh and
Tarroux simulate long-term memory to implement a top-
down component, our model is purely bottom-up. Addi-
tionally, their implementation requires user interaction while
ours is unsupervised. The example provided by Machroux
and Tarroux presents the task of face detection and detec-
tion of similar regions within a single image. This work is
not concerned with intra-image similari ty, but r a ther with
inter-image relationships.
3. THE PROPOSED MODEL
This section presents an overview of the proposed model and
explains its main components in detail.
3.1. Overview
We present a biologically-plausible model that extracts ROIs
using saliency-based visual attention models, which are then
used for the image clustering process. The proposed solution
offers a promising alternative to overcoming some of the lim-
itations of current CBIR and OBIR systems.
Our architecture incorporates a model of visual attention
to compute the salient regions of an image. Regions of inter-
est are extracted depending on their saliency. Our first cue
to potential ROIs are salient peaks in the Itti-Koch saliency
map. If these peaks overlap with salient regions in Stentiford’s
model, we proceed to extract ROIs around that point. Images
are then clustered together based on the features extracted
from these regions. The result is a group of images based
not on their global characteristics (such as a blue sky), but
rather on their salient regions. When a user is quickly view-
ing scenes or images the salient regions are those that stand
out more quickly. Additionally, the background of an image
quite often dominates the feature extraction component of
many CBIR systems leading to unsatisfying results for the
user.
The proposed work is based on bottom-up influences of
attention and, therefore, purely unsupervised. One of the ad-
vantages of relying exclusively on bottom-up information is
that bottom-up components of a scene influence our atten-
tion before top-down knowledge does [27]. Moreover, atten-
tion leads us to the relevant regions of an image and allows
us to handle multiple ROIs within a scene without relying on
classical segmentation approaches. When we are presented
with an image of which we have no prior knowledge about
and are given no instruction as to what to look for, our at-
tention flows from salient point to point, where saliency is
calculated based on only bottom-up influences.
Oge Marques et al. 7
There are many applications of this knowledge in a va-
riety of diverse fields. In developing user interfaces we may
desire the most important functions to more easily attract
our attention. For example, in cars the button to activate the
hazard lights is red to distinguish itself from less critical but-
tons. Similarly, when we are driving through a crowded city it
is important for warning signs to be the first thing we direct
our attention to. Attention has also been used to compress
images by enabling the automated selection of a region of in-
terest [47].
Recent work has also shown that the performance of ob-
ject recognition solutions increases when preceded by com-
putational models of visual attention that guide the recog-
nition system to the potentially most relevant objects within
ascene[34]. We apply the same methodology to the prob-
lem of CBIR, keeping in mind the differences between the
object recognition and the similarity-based retrieval tasks,
namely [7], the degree of interactivity, the different rela-
tive importance of recall and precision, the broader appli-
cation domains and corresponding semantic ranges, and the
application-dependent semantic knowledge associated with
the extracted objects (regions). In spite of these differences
we believe that attention can improve image retrieval in a
comparable way that it has been shown to improve the per-
formance of object recognition solutions [34]. Since CBIR is
much less strict than object recognition in terms of the qual-
ity of the object segmentation results, we settle for ROIs in-
stead of perfectly segmented objects.
3.2. Key aspects
The following are the key aspects of our model.
Biologically plausible
Our model satisfies biological plausibility by combining Itti
and Koch’s and Stentiford’s biologically inspired models
of visual attention with the clustering of results, which—
according to Draper et al. [48]—is also a biologically plau-
sible task.
Unsupervised and content-based
It is important that our model is able to function entirely un-
supervised. Groupings are made solely based on the content
of the given image. Our model is able to function without the
intervention of a user, producing clusters of related images at
its output. These clusters can then b e browsed by the user,
exported to other applications, or even annotated (although
this is currently not implemented).
Bottom-up
We limit our model to incorporating only bottom-up knowl-
edge. To date, despite advances, true top-down knowledge
has not been successfully incorporated into models of visual
attention. Itti and Koch’s work as well as derivative research
has shown that promising results can still be obtained despite
the lack of top-down knowledge in situations where bottom-
Images Early vision Saliency map
Region of interest
extraction
Regions of
interest
Feature extraction Feature vectors
Clustering Clusters
Figure 5: The proposed model.
up factors are enough to determine the salient region of an
image [49].
Modular
While we rely on the Itti-Koch model of visual attention, our
model allows for a variety of other models of visual atten-
tion to be used in its place. Similarly, the choice of feature
extraction techniques and descriptors as well as clustering al-
gorithms can also be varied. This allows a good degree of flex-
ibility and finetuning (or customization) based on results of
experiments, such as the ones described in Section 4. Addi-
tionally, our modular design means that our model is com-
pletely independent of the query, retrieval, and annotation
stages of a complete CBIR solution (such as the one shown
in Figure 2).
3.3. Components
Our model consists of the following four stages (Figure 5):
early vision (visual attention), region of interest extraction,
feature extraction, and clustering. The current prototype has
been implemented i n MATLAB and uses some of its built-in
functionality, as it will be occasionally mentioned along this
section.
3.3.1. Early vision
The first stage models early vision—specifically, what our
visual attention system is able to perceive in the first few
milliseconds. The purpose of this state is to indicate what the
most salient areas of an image are. The input to this stage
is a source image. The output is the saliency map which is
based on differences in color, intensity, and orientation. We
8 EURASIP Journal on Advances in Signal Processing
use the Itti-Koch model of visual attention as a proven, ef-
fective method of generating the saliency map. It has b een
successfully tested in a variety of applications [50]. Saliency
maps were computed using a Java implementation of the
Itti-Koch model of visual attention [51]. The visual atten-
tion maps proposed by Stentiford were generated by our own
MATLAB implementation of the methods described in [16].
The proposed model is not domain-specific and does not
impose limits on the variety of images that it applies to, pro-
vided that there is at least one semantically meaningful ROI
within the image. The process of generating a saliency map
and selecting the most salient ROIs reduces the impact of dis-
tractors. As noted earlier, the recognition of multiple objects
cannot be done without attentional selection [34].
3.3.2. Region of interest extraction
The second stage of our model gener ates ROIs that corre-
spond to the most salient areas of the image. It is inspired by
the approach used by Rutishauser et al. [34]. Our model ap-
preciates not only the magnitude of the peaks in the saliency
map, but the size of the resulting salient regions as well. The
extracted ROIs reflect the areas of the image we are likely to
attend to first. Only these regions are considered for the next
step, feature extraction.
The algorithm for extr acting one or more regions of in-
terest from an input image described in this paper combines
the saliency map produced by the Itti-Koch model with the
segmentation results of Stentiford’s algorithm in such a way
as to leverage the strengths of either approach without suf-
fering from their shortcomings. More specifically, two of the
major strengths of the Itti-Koch model—the ability to take
into account color, orientation, and intensity to detect salient
spots (whereas Stentiford’s is based on color and shape only)
and the fact that it is more discriminative among potentially
salient regions than Stentiford’s—are combined with two of
the best characteristics of Stentiford’s approach—the abil-
ity to detect entire salient regions (as opposed to Itti-Koch’s
peaks in the saliency map) and handle regions of interest
larger than the 5% ROS limit mentioned in [34].
Figure 6 shows a general view of the whole ROI extrac-
tion algorithm, using as input example the image I contain-
ing a road marker and a sign (therefore, two ROIs). The ba-
sic idea is to use the saliency map produced by the Itti-Koch
model to start a controlled region growing of the potential
ROIs, limiting their growth to the boundaries established by
Stentiford’s results and/or a predefined maximum ROS. The
first step is to extract the saliency (S)andVA(V)mapsfrom
the input image ( I). Both maps were explained in Sections
2.3.1 and 2.3.2, respectively. Note that while the saliency map
returns small highly salient regions (peaks) over the ROIs,
the VA map returns high VA score pixels for the entire ROIs,
suggesting that a combination of S and V couldbeusedina
segmentation process. In Figure 6, the image processing box
(IPB-S) block takes S as input and returns a binary image S
p
containing small blobs that are related to the most salient re-
gions of the image. The IPB-V block takes V as input and re-
turns a binary image V
p
, containing large areas with high VA
scores, instead of blobs. Images S
p
and V
p
are presented to
the mask generation block, that compares them and uses the
matching regions as cues for selection of the ROIs into V
p
.
The result is a near perfect segmentation of the ROIs present
in the example input image I.
Figure 7 presents additional details about the operations
performed by the IPB-S, IPB-V and mask generation blocks.
The IPB-S block performs the foll owing operations.
(i) Thresholding: converts a grayscale image f (x, y) into a
black-and-white (binary) equivalent g(x, y) according
to (1), where T is a hard threshold in the [0, , 255]
range, valid for the entire image. This is accomplished
by using the “im2bw()” function in MATLAB,
g(x, y)
=
⎧
⎨
⎩
1iff (x, y) >T,
0iff (x, y)
≤ T.
(1)
(ii) Remove spurious pixels: removes undesired pixels
from the resulting binarized image. This is imple-
mented using a binary morphological operator avail-
able in the “bwmorph()” function (with the spur pa-
rameter) in MATLAB.
(iii) Remove isolated pixels: removes any remaining white
pixels surrounded by eight black neighbors. This is
implemented using a binary morphological operator
available in the “bwmor ph()” func tion (with the clean
parameter) in MATLAB.
The IPB-V block performs thresholding (as explained
above) followed by the two operations below.
(i) Morphological closing: fills small gaps within the
white regions. This is implemented using a binary
morphological operator, described in (2), where
de-
notes morphological erosion and
⊕ represents mor-
phological dilation with a structuring element. This
is accomplished by using the “imclose()” function in
MATLAB,
A
◦ B = (A B) ⊕ B. (2)
(ii) Region filling: flood-fills enclosed black regions of any
size with white pixels, starting from specified points.
This is implemented using a binary morphological op-
erator available in the “imfill()” function (with the
holes parameter) in MATLAB.
The mask generation block performs (self-explanatory)
logical AND and OR operations, morphological closing, and
region filling (as described above) plus the following steps.
(i) Find centroids: shrinks each connected region until
only a pixel is left. This is accomplished by using the
“bwmorph()” function (with the shrink parameter) in
MATLAB.
(ii) Square relative object size (ROS): draws squares of
fixed size (limited to 5% of the total image size) around
each centroid.
(iii) CP: combines each centroid image (C) w ith a partial
(P) image in order to decide which ROIs to keep and
which to discard.
Oge Marques et al. 9
Saliency
map
S
IPB-S
S
p
Mask
generation
I
Visual att.
map
V
IPB-V
V
p
M
&
R
I
Figure 6: The ROI extraction algorithm: general block diagram and example results.
IPB-S
S
Threshold
Remove spurious
pixles
Remove isolated
pixles
S
p
V
Threshold
Morphological
closing
Region filling
V
p
IPB-V
Find
centroids
Mask generation
C
1
.
.
.
C
n
Square ROS
Morphological
pruning
M
S
p
V
p
&
SR
C
1
SR
C
n
V
p
& &
V
p
P
1
P
n
C
1
CP CP
C
n
Region filling
OR
Morphological
closing
Figure 7: The ROI extraction algorithm: detailed block diagram.
(iv) Morphological pruning: performs a morphological
opening and keeps only the largest remaining con-
nected component, thereby eliminating smaller (un-
desired) branches.
The ideal result of applying our method is an image that
contains the most prominent objects in a scene, discards
what is not salient, handles relatively large objects, and takes
into account salient regions whose saliency is due to prop-
erties other than color and shape. Figure 8 shows additional
results for two different test images: the image on the left con-
tains two reasonably large objects of interest (a trafficsign
and a telephone) that are segmented successfully despite the
fact that one of them resulted from prominent, but uncon-
nected, peaks in the Itti-Koch saliency map. The image on the
right-hand side of Figure 8 shows a case where Stentiford’s
algorithm would not perceive the tilted rectangle as more
salient than any other, but—thanks to Itti-Koch model’s re-
liance on orientation in addition to color and intensity—our
algorithm segments it as the only salient region in the image.
10 EURASIP Journal on Advances in Signal Processing
(a) (b)
(c) (d)
(e) (f)
(g) (h)
(i) (j)
Figure 8: Examples of region of interest extraction. From top to
bottom: original image (I), processed saliency map (Sp), processed
Stentiford’s VA map (Vp), mask (M), and final image, containing
the extracted ROIs (R).
3.3.3. Feature extraction
The proposed system allows using any combination of fea-
ture extraction algorithms commonly used in CBIR, for ex-
ample, color histograms, color correlograms, Tamura texture
descriptors, Fourier shape descriptors, and so forth (see [52]
for a brief comparative analysis), applied on a region-by-
region basis. Each independent ROI has its own feature vec-
tor. An image may be associated with several different feature
vectors.
The current prototype implements two color-based fea-
ture extraction algorithms and descriptors, a 216-bin RGB
color histogram and a 256-cell quantized HMMD (MPEG-
7-compatible) descriptor. The latter is expected to produce
better results than the former, because of the chosen color
space (w hich is closer to a perceptually uniform color space
than the RGB counterpart) and due to the nonuniform sub-
space quantization that it undergoes.
3.3.4. Clustering
The final stage of our model groups the feature vectors to-
gether using a general-purpose clustering algorithm. Just as
an image may have several ROIs and several feature vectors
it may also be clustered in several different, entirely indepen-
dent, groups. This is an important distinction between our
model and other cluster-based approaches, which often limit
an image to one cluster membership entry. The flexibility of
having several ROIs allows us to cluster images based on the
regions (objects) we are more likely to perceive rather than
only global information.
Recently, Chen et al. [53] demonstrated that clustering
and ranking of relevant results is a viable alternative to the
usual approach of presenting the results in a ranked list for-
mat. The results of their experiments demonstrated that their
approach provides clues that are semantically more relevant
to a CBIR user than those provided by the existing systems
that make use of similar measurement techniques. Their re-
sults also motivated the cluster-based approach taken in our
work.
Figure 9 shows the results of clustering 18 images con-
taining five ROIs with possible semantic meaning, namely:
mini-basketball, tennis ball, blue plate, red newspaper stand,
and yellow road sign. It can be seen that the proposed solu-
tion does an excellent job grouping together all occurrences
of similar ROIs into the appropriate clusters. This simple ex-
ample captures an essential aspect of the proposed solution:
the ability to group together similar ROIs in spite of large
differences in the background.
4. EXPERIMENTS AND RESULTS
This section contains representative results from our exper-
iments and discusses the performance of the proposed ap-
proach on a representative dataset.
4.1. Methodology
The composition of the image database is of paramount im-
portance to the meaningful evaluation of any CBIR system.
The images must be of the appropriate context so that the
results are relevant. In the case of this work it was neces-
sary to have a database containing images with semantically
well-defined ROIs (regions that are salient by design). Pho-
tographs of scenes with a combination of naturally occurring
Oge Marques et al. 11
C
1
(a) (b) (c) (d)
C
2
(e) (f) (g) (h)
C
3
(i) (j) (k) (l)
C
4
(m) (n) (o) (p)
C
5
(q) (r) (s) (t)
Figure 9: Examples of clustering based on ROIs for a small dataset. The extracted ROIs are outlined.
and art ificial objects are a natural choice. Our computational
model underwent preliminary assessment using a subset of
images from the STIMautobahn, STIMCoke, and STIMTri-
angle archives available at the iLab image database reposi-
tory ( We selected a total of
110 images, divided as follows: 41 images from the STIMau-
tobahn database (a variety of road signs), 41 images from
the STIMCoke database (red soda cans in many different
sizes, positions and backgrounds), and 28 images from the
STIMTriangle database (emergency triangles in many dif-
ferent relative sizes, positions, and backgrounds). The re-
sulting database provided a diverse range of images w ith an
12 EURASIP Journal on Advances in Signal Processing
Figure 10: The ground truth ROIs for a sample image. The image
on the left can be found at [29].
appropriate balance between easy, moderate, and difficult-
to-isolate ROIs.
An initial manual analysis of the selected 110 images was
done to establish the ground truth ROIs. In total, 174 regions
were divided between 22 clusters. In the ground truth, for
example, all red soda cans belong to one cluster, while all or-
ange signs belong to another. The ground truth was agreed
upon by three people familiar with the images and is not am-
biguous. Identified ROIs are shown for one of the images in-
cluded in the database in Figure 10.
For each image the corresponding saliency map was ex-
tracted and used to compute the relevant ROIs using the al-
gorithm described in Section 3.3.2.EachROIwasencoded
using either a 27-bin RGB color histogram or a 32-cell quan-
tized HMMD color descriptor (both have been described in
Section 3.3.3) as the feature vector. The resulting feature vec-
tors were clustered using the classic K-means clustering al-
gorithm [54]. In-depth analysis of these results is presented
in Section 4.2. Further experiments tested a variety of differ-
ent clustering algorithms. Their results are also qualitatively
compared.
The chosen feature extraction and clustering algorithms
are simple and widely accepted methods—baseline case for
both stages. While the use of more sophisticated feature ex-
traction and clustering algorithms provides more possibili-
ties for improving the performance of the presented system,
they are beyond the scope of this paper. The ability to pro-
vide meaningful results with simple modules for clustering
and feature extraction provides encouragement for the po-
tential of future work to improve this model.
4.2. Results
The fol lowing sections report the results of two distinct eval-
uation stages: ROI extraction and clustering.
4.2.1. ROI extraction
For ROI extr action a receiver operating characteristic (ROC)
curve was generated to evaluate the ideal key parameter, the
binarizing threshold of the saliency map. This curve is shown
in Figure 11. It was generated by evaluating the number of
true positives, false positives, and false negatives in the result-
ing images. The resulting figure plots the false alarm rate ver-
0 102030405060708090100
Hit rate (%)
0
10
20
30
40
50
60
70
80
90
100
False alarm rate (%)
Figure 11: ROC curve used to evaluate the performance of the ROI
extraction algorithm as a function of the threshold used to binarize
the saliency map. The vertical axis represents the false alarm rate
(expressed in %), whereas the horizontal axis represents the hit rate
(also expressed in %).
sus the hit rate. ROC curves provide a visual indication of the
interaction between the risk of a f alse positive and the reward
of a true positive and facilitate the selection of a threshold.
The false alarm rate is defined as
false alarm rate
=
FP
max(FP)
. (3)
The hit rate is defined as
hit rate
=
TP
(TP + FN)
,(4)
where TP is the number of true positives, FP is the number
of false positives, and FN is the number of false negatives.
The varied parameter of the ROC curve is the threshold
used to binarize the saliency map that results from applying
the Itti-Koch model of visual attention to the source image.
The threshold used directly affects the potential amount of
seed points provided to the further stages of the model and
has a great impact on performance. If the threshold is too
high not enough seeds will be generated and valid ROIs will
be missed. Conversely, a low threshold will result in too many
false positives. Our experiments showed that a value of 190
yielded the most balanced results—a 27.67% false alarm rate
and a 76.74% hit rate.
An alternative way to determine the best value for the
threshold is to compute precision (p), recall (r), and F1, de-
fined as follows:
p
=
TP
(TP + FP)
, r
=
TP
(TP + FN)
,F1
=
2 × p × r
(p + r)
,
(5)
where TP is the number of true positives, FP is the number
of false positives, and FN is the number of false negatives.
Oge Marques et al. 13
123456789101112
Different test intervals
0
0.1
0.2
0.3
0.4
0.5
0.6
0.7
0.8
0.9
1
F1 value
Figure 12: Variation of F1 as a function of the threshold used to
binarize the saliency map. The vertical axis represents the F1 value,
whereas the horizontal axis represents the different test intervals.
Theidealvalueforp, r,orF1is1.Figure 12 shows the
variation of F1 as a function of the threshold. Once again,
the curve peaks (at about 0.73) for threshold values between
180 and 190 (inter vals labeled 7 and 8 on the curve).
4.2.2. Clustering
Quantitative evaluation of the clustering stage was per-
formed on raw confusion matrices obtained for each relevant
case. The analysis was done from two different angles: (i) we
used measures of purity and ent ropy (defined in (6)and(7)
below) to evaluate the quality of the resulting clusters; and
(ii) we adopted measures of precision, recall, and F1 to cap-
ture how well a certain semantic category was represented in
the resulting clustering structure.
Given a number of categories c,wecandefinepurityas
p
C
j
=
1
C
j
max
k=1, ,c
C
j,k
,(6)
while entropy can b e defined as
h
C
j
=−
1
log c
c
k=1
C
j,k
C
j
log
C
j,k
C
j
,(7)
where
|C
j
| is the size of cluster j,and|C
j,k
| represents the
number of images in cluster j that belong to category k.
Purityvaluesmayvarybetween1/c and 1 (best), whereas
entropy values may vary between 0 (best) and 1.
In the context of clustering,
p
k
=
C
j,k
C
j
,
r
k
=
C
j,k
C
k
,
F1
k
=
2 × p
k
× r
k
p
k
+ r
k
,
(8)
123456789101112131415161718192021
Cluster numbers
0
0.1
0.2
0.3
0.4
0.5
0.6
0.7
0.8
0.9
1
Purity value
RGB
HMMD
Figure 13: Measure of purity for each of the K = 21 clusters. The
vertical axis represents the purity value, whereas the horizontal axis
represents the cluster numbers.
where |C
j
| is the size of cluster j, |C
j,k
| represents the num-
ber of images in cluster j that belong to category k,and
|C
k
|
represents the total number of images that belong to cate-
gory k.
The two relevant cases reported in this section used the
same clustering algorithm (K-Means, where K
= 21) but dif-
fered in the choice of feature vector (descriptor): 27-bin RGB
histogram or 32-cell quantized HMMD descriptor. These
two feature extraction methods were evaluated in connec-
tion with the clustering algorithms, under the ra tionale that
the quality of resulting clusters is dependent on the quality
of the input feature vectors. The value of K
= 21 here was
determined independently of the number of clusters in the
ground truth dataset, which was 22.
Figure 13 shows the variation in the measure of purity for
both cases, whereas Figure 14 shows the corresponding plot
for measures of entropy. In both cases, the values have been
sorted so that best results appear on the right-hand side of
each figure. For both figures of merit, the HMMD descriptor
outperforms the RGB histogram in almost all clusters.
Figure 15 shows the variation in the measure of maxi-
mum value of F1 for both cases. Once again, the HMMD de-
scriptor outperforms the RGB histogram in almost all clus-
ters.
We have also collected qualitative and quantitative re-
sults for other clustering algorithms, namely, fuzzy c-means,
hierarchical clustering, and a combination of subtractive
clustering—for seed selection—and K-means. The detailed
quantitative comparison is beyond the scope of this paper
and will be presented in a separate work. Qualitative re-
sults confirm that improved clustering algorithms can result
in better clustering structures (from a human user’s expec-
tation) based upon the same feature descriptor(s) than the
baseline case presented above.
14 EURASIP Journal on Advances in Signal Processing
1 2 3 4 5 6 7 8 9 101112131415161718192021
Cluster numbers
0
0.1
0.2
0.3
0.4
0.5
0.6
0.7
0.8
0.9
1
Entropy value
RGB
HMMD
Figure 14: Measure of entropy for each of the K = 21 clusters. The
vertical axis represents the entropy value, whereas the horizontal
axis represents the cluster numbers.
1 2 3 4 5 6 7 8 9 101112131415161718192021
Cluster numbers
0
0.1
0.2
0.3
0.4
0.5
0.6
0.7
0.8
0.9
1
Max F1value
RGB
HMMD
Figure 15: Measure of maximum value of F1 for each of the 21 se-
mantic categories. The vertical axis represents the best (maximum)
value for a certain semantic category across all clusters, whereas the
horizontal axis represents the cluster numbers.
4.3. Discussion
Results from our experiments on a 110-image dataset con-
taining a total of 174 ROIs and at least one ROI per image
have shown that the proposed solution has performed well
in most cases. The vast majority (77% for the chosen thresh-
old value) of meaningful ROIs are successfully extr acted and
eventually clustered along with other visually similar ROIs in
a way that closely matches the human user’s expectations.
The current ROI extraction algorithm has certain short-
comings that fall into one of the following three categories:
false negatives (meaningful ROIs are not extracted), false
Figure 16: Examples of cases where the proposed ROI extraction
algorithm does not work as expected. The images on the top row
can be found at [29].
positives (additional extraneous ROIs are extracted), and im-
perfect ROIs. Imperfections in the resulting ROIs can be seen
in the form of incomplete, oddly shaped, and/or excessively
large ROIs. Figure 16 shows three such cases. In the first one
(left column), a relevant object (Coke can) is not extracted
(primarily due to the poor lighting conditions of the scene).
In the second case (middle column), a relatively large num-
ber of false positives appear (in addition to the only true posi-
tive in the scene, the emergency triangle). Finally, in the third
case (right column), an artificial ly large ROI is obtained, in-
cluding the object of interest (triangle), but adding many
more unnecessary pixels to the ROI.
The behavior displayed by our ROC curve may initially
appear to be inconsistent with the expected monotonically
increasing function. Traditionally, the amount of hits will in-
crease with more liberal criteria, at the expense of encounter-
ing more misses. However, the parameter our method uses,
the threshold of the saliency map (ultimately, the number of
seeds used to extract regions of interest), exhibits diminish-
ing returns after a point. This is because low thresholds will
increasingly generate more seeds and, as a result, larger re-
gions of interest. The breaking point occurs when the ROIs
get too large and start to overlap, diminishing the ability to
distinguish multiple ROIs. As a result, it is not beneficial (in
terms of detecting the maximum possible amount of ROIs)
to continually decrease the threshold.
There are obvious dependencies among certain blocks,
particularly: (i) ROI extraction and feature extraction, since
a missed ROI (false negative) will never again become avail-
able to have its features extracted; (ii) feature extraction and
clustering, since different descriptors will provide variations
in the clustering results.
The combined tests investigating the relative impact of
the chosen feature extraction algorithm on the quality of the
clustering results have confirmed that the HMMD descriptor
outperforms its RGB counterpart.
Interestingly enough, the feature extraction and cluster-
ing algorithms can still provide good results even in the
presence of less-than-perfect results from the ROI extrac-
tion stage, as indicated in the top-most figure in cluster C5
in Figure 9.
Oge Marques et al. 15
Our clustering experiments use the results of the ROI ex-
traction algorithm (and subsequent feature extraction) with-
out modification. In o ther words, due to the presence of false
positives in the ROI extraction stage, we had to revisit the se-
mantic categories and account for the false positives. Had we
removed the false positives (which one could compare to a
user-initiated action), we would have achieved much better
results in the clustering stage, but would have sacrificed the
unsupervised nature of our approach.
5. CONCLUSION
This paper presented a model for grouping images based
on their salient regions. The differential of our model is
that it overcomes some of the main limitations of existing
object-based image retrieval solutions. It makes use of the
results of a biologically inspired bottom-up model of visual
attention—encoded in a saliency map—to guide the pro-
cess of detecting—in a purely unsupervised manner—the
most salient points within an image. These salient points are
then used to extract regions of interest around them. These
regions—which in many cases correspond to semantically
meaningful objects—are then processed by a feature extr ac-
tion module and the results are used to assign a region (and
the image to w hich it belongs) to a cluster. Next, images con-
taining perceptually similar objects are grouped together, re-
gardless of the number of occurrences of an object or any
distracting factors around them.
Quantitative and qualitative results of our experiments
on a 110-image dataset are very encouraging and suggest that
the approach should be extended and improved in ways such
as described below.
Some shortcomings of the proposed solution are related
to the purely bottom-up nature of the visual saliency maps
upon which much of the processing is done. Future work
includes, among other things, a deeper study of image re-
trieval users’ needs to determine how they can modulate the
saliency map and provide a top-down component to the cur-
rent model, comparable to the work reported in [36]fortar-
get detection tasks.
Certain limitations of the proposed approach are due to
its purely unsupervised nature. Since many CBIR solutions
postulate the use of relevance feedback (RF) to allow user in-
teraction, we are planning on extending the existing proto-
type to include an RF option (e.g., by allowing users to click
on some of the false negatives and false positives obtained at
the output of the ROI extraction to indicate what the algo-
rithm missed and/or incorrectly added).
Future work also includes the extension of our system
to incorporate relevance feedback at the end of the cluster-
ing stage. While clusters provide the ability to quickly pass
reasonable judgment on groups of similar images, adding
relevance feedback would enable the user to converge to-
wards meaningful results with minimal interaction. We are
currently considering persistent relevance feedback strategies
that modify cluster membership based on the activity of mul-
tiple users across multiple sessions.
There are other areas where notable improvements could
be achieved under the new model. While the feature extrac-
tion and clustering methods selected were purposefully sim-
ple, an evaluation of the performance of alternative methods
in the context of this solution may lead to better overall re-
sults.
ACKNOWLEDGMENT
This research was partially sponsored by the UOL (http://
www.uol.com.br), through its UOL Bolsa Pesquisa program,
no. 200503312101a and by the Office of Naval Research
(ONR) under the Center for Coastline Security Technology
Grant N00014-05-C-0031.
REFERENCES
[1] O. Marques and B. Furht, Content-Based Image and Video Re-
trieval, Kluwer Academic, Boston, Mass, USA, 2002.
[2] Y. Rui, T. S. Huang, and S F. Chang, “Image retrieval: current
techniques, promising directions, and open issues,” Journal
of Visual Communication and Image Representation, vol. 10,
no. 1, pp. 39–62, 1999.
[3] A. M. W. Smeulders, M. Worring, S. Santini, A. Gupta, and
R. Jain, “Content-based image retrieval at the end of the early
years,” IEEE Transactions on Pattern Analysis and Machine In-
telligence, vol. 22, no. 12, pp. 1349–1380, 2000.
[4]P.G.B.EnserandC.J.Sandom,“Towardsacomprehensive
survey of the semantic gap in visual image retrieval,” in Pro -
ceedings of the 2nd International Conference on Image and Video
Retrieval (CIVR ’03), pp. 291–299, Urbana-Champaign, Ill,
USA, July 2003.
[5] R. Zhao and W. I. Grosky, “Narrowing the semantic gap—
improved text-based web document retrieval using v isual fea-
tures,” IEEE Transactions on Multimedia, vol. 4, no. 2, pp. 189–
200, 2002.
[6] R. Zhao and W. I. Grosky, “Negotiating the semantic gap:
from feature maps to semantic landscapes,” Pattern Recogni-
tion, vol. 35, no. 3, pp. 593–600, 2002.
[7] C. Colombo and A. Del Bimbo, “Visible image retrieval,” in
Image Databases: Search and Retrieval of Digital Imagery,V.
CastelliandL.D.Bergman,Eds.,chapter2,pp.11–33,John
Wiley & Sons, New York, NY, USA, 2002.
[8] C. H. C. Leung and H. H S. Ip, “Benchmarking for content-
based visual information search,” in Proceedings of the 4th In-
ternat ional Conference on Advances in Visual Information Sys-
tems (VISUAL ’00), pp. 442–456, Lyon, France, November
2000.
[9] H. M
¨
uller, W. M
¨
uller, and D. M. Squire, “Automated bench-
marking in content-based image retrieval,” in Proceedings of
the IEEE International Conference on Multimedia and Expo
(ICME ’01), p. 290, Tokyo, Japan, August 2001.
[10] C. Carson, S. Belongie, H. Greenspan, and J. Malik, “Blob-
world: image segmentation using expectation-maximization
and its application to image querying,” IEEE Transactions on
Pattern Analysis and Machine Intelligence, vol. 24, no. 8, pp.
1026–1038, 2002.
[11] W Y. Ma and B. S. Manjunath, “NeTra: a toolbox for navigat-
ing large image databases,” Multimedia Systems,vol.7,no.3,
pp. 184–198, 1999.
16 EURASIP Journal on Advances in Signal Processing
[12] Y. Li and L. Shapiro, “Object recognition for content-
based image retrieval,” />shapiro/.
[13] D. Hoiem, R. Sukthankar, H. Schneiderman, and L. Huston,
“Object-based image retr ieval using the statistical structure of
images,” in Proceedings of the IEEE Computer Society Confer-
ence on Computer Vision and Pattern Recognition (CVPR ’04),
vol. 2, pp. 490–497, Washington, DC, USA, June-July 2004.
[14] Y. Tao and W. I. Grosky, “Image matching using the OBIR sys-
tem with feature point histograms,” in Proceedings of the 4th
Working Conference on Visual Database Systems (VDB ’98),pp.
192–197, L’Aquila, Italy, May 1998.
[15] L. Itti, C. Koch, and E. Niebur, “A model of saliency-based vi-
sual attention for rapid scene analysis,” IEEE Transactions on
Pattern Analysis and Machine Intelligence, vol. 20, no. 11, pp.
1254–1259, 1998.
[16] F. W. M. Stentiford, “An attention based similarity measure
with application to content-based information retrieval,” in
Storage and Retrieval for Media Databases, vol. 5021 of Pro-
ceedings of SPIE, pp. 221–232, Santa Clara, Calif, USA, January
2003.
[17] R. Baeza-Yates and B. Ribeiro-Neto, Modern Information Re-
trieval, Addison-Wesley/ACM Press, New York, NY, USA,
1999.
[18] S F. Chang, J. R. Smith, M. Beigi, and A. Benitez, “Visual in-
formation retrieval from large distributed online repositories,”
Communications of the ACM, vol. 40, no. 12, pp. 63–71, 1997.
[19] S. Palmer, Vision Science: Photons to Phenomenology,MIT
Press, Cambridge, Mass, USA, 1999.
[20] R. Veltkamp and M. Tanase, “A survey of content-based image
retrieval systems,” in Content-Based Image and Video Retrieval,
O. Marques and B. Furht, Eds., chapter 5, pp. 47–101, Kluwer
Academic, Boston, Mass, USA, 2002.
[21] E. Chang, K T. Cheng, W C. Lai, C T. Wu, C. Chang, and Y
L. Wu, “PBIR: perception-based image retrieval-a system that
can quickly capture subjective image query concepts,” in Pro-
ceedings of the 9th ACM International Conference on Multime-
dia, pp. 611–614, Ottawa, Canada, September 2001.
[22] O. Marques and N. Barman, “Semi-automatic semantic an-
notation of images using machine learning techniques,” in
Proceedings of the 2nd International Semantic Web Conference
(ISWC ’03), vol. 2870 of Lecture Notes in Computer Science,pp.
550–565, Sanibel Island, Fla, USA, October 2003.
[23] O. Marques and B. Furht, “MUSE: a content-based image
search and retrieval system using relevance feedback,” Multi-
media Tools and Applications, vol. 17, no. 1, pp. 21–50, 2002.
[24] A. Oliva, “Gist of a scene,” in Neurobiology of Attention,L.Itti,
G. Rees, and J. Tsotsos, Eds., chapter 41, pp. 251–256, Aca-
demic Press, Elsevier, New York, NY, USA, 2005.
[25] E. A. Styles, Attention, Perception, and Memory: An Integrated
Introduction,Taylor&FrancisRoutledge,NewYork,NY,USA,
2005.
[26] D. Noton and L. Stark, “Scanpaths in eye movements during
pattern perception,” Science, vol. 171, no. 968, pp. 308–311,
1971.
[27] C. Connor, H. Egeth, and S. Yantis, “Visual attention: bottom-
up versus top-down,” Current Biology, vol. 14, no. 19, pp.
R850–R852, 2004.
[28] S. Santini and R. Jain, “The graphical specification of similar-
ity queries,” Journal of Visual Languages and Computing, vol. 7,
no. 4, pp. 403–421, 1996.
[29] L. Itti and C. Koch, “Feature combination strategies for
saliency-based visual attention systems,” Journal of Electronic
Imaging, vol. 10, no. 1, pp. 161–169, 2001.
[30] Z. W. Pylyshyn, Seeing and Visualizing: It’s Not What You
Think, MIT Press, Cambridge, Mass, USA, 2006.
[31] S. Palmer, “The effects of contextual scenes on the identifica-
tion of objects,” Memory & Cognition, vol. 3, no. 5, pp. 519–
526, 1975.
[32] I. Biederman, “Perceiving real-world scenes,” Science, vol. 177,
no. 43, pp. 77–80, 1972.
[33] L. Itti and C. Koch, “Computational modeling of visual atten-
tion,” Nature Reviews Neuroscience, vol. 2, no. 3, pp. 194–203,
2001.
[34] U. Rutishauser, D. Walther, C. Koch, and P. Perona, “Is
bottom-up attention useful for object recognition?” in Pro-
ceedings of the IEEE Computer Society Conference on Computer
Vision and Pattern Recognition (CVPR ’04), vol. 2, pp. 37–44,
Washington, DC, USA, June-July 2004.
[35] D. Walther, L. Itti, M. Riesenhuber, T. Poggio, and C. Koch,
“Attentional selection for object recognition—a gentle way,”
in Proceedings of the 2nd International Workshop on Biologically
Motivated Computer Vision (BMCV ’02), vol. 2525 of Lecture
Notes In Computer Science, pp. 472–479, Tubingen, Germany,
November 2002.
[36] V. Navalpakkam and L. Itti, “Modeling the influence of task on
attention,” Vision Research, vol. 45, no. 2, pp. 205–231, 2005.
[37] W. Einh
¨
auser and P. K
¨
onig, “Does luminance-contrast con-
tribute to a saliency map for overt visual attention?” European
Journal of Neuroscience, vol. 17, no. 5, pp. 1089–1097, 2003.
[38] D. Parkhurst, K. Law, and E. Niebur, “Modeling the role of
salience in the allocation of overt visual attention,” Vision Re-
search, vol. 42, no. 1, pp. 107–123, 2002.
[39] D. Parkhurst and E. Niebur, “Texture contrast attracts overt
visual attention in natural scenes,” European Journal of Neuro-
science, vol. 19, no. 3, pp. 783–789, 2004.
[40]R.J.Peters,A.Iyer,L.Itti,andC.Koch,“Componentsof
bottom-up gaze allocation in natural images,” Vision Research,
vol. 45, no. 18, pp. 2397–2416, 2005.
[41] J. M. Henderson, J. R. Brockmole, M. S. Castelhano, and M.
Mack, “Image salience versus cognitive control of eye move-
ments in real-world scenes: evidence from visual search,” in
Eye Movement Research: Insights Into Mind and Brain,R.van
Gompel,M.Fischer,W.Murray,andR.Hill,Eds.,Elsevier,
Amsterdam, The Netherlands, in press.
[42] A. Bamidele, F. W. M. Stentiford, and J. Morphett, “An
attention-based approach to content-based image retrieval,”
BT Technology Journal, vol. 22, no. 3, pp. 151–160, 2004.
[43] G. Boccignone, A. Picariello, V. Moscato, and M. Albanese,
“Image similarity based on animate vision: information path
matching,” in Proceedings of the 8th International Workshop on
Multimedia Information Systems (MIS ’02), pp. 66–75, Tempe,
Ariz, USA, October 2002.
[44] D. H. Ballard, “Animate vision,” Artificial Intelligence, vol. 48,
no. 1, pp. 57–86, 1991.
[45] A. Bamidele and F. W. M. Stentiford, “An attention based sim-
ilarity measure used to identify image clusters,” in Proceedings
of the 2nd European Workshop on the Integration of Knowl-
edge, Semantics and Dig ital Media Technology, London, UK,
November-December 2005.
[46] J. Machrouh and P. Tarroux, “Attentional mechanisms for in-
teractive image exploration,” EURASIP Journal on Applied Sig-
nal Processing, vol. 2005, no. 14, pp. 2391–2396, 2005.
[47] A. P. Bradley and F. W. M. Stentiford, “JPEG 2000 and region
of interest coding,” in Proceedings of Digital Image Computing:
Techniques and Applications (DICTA ’02), pp. 303–308, Mel-
bourne, Australia, January 2002.
Oge Marques et al. 17
[48] B. Draper, K. Baek, and J. Boody, “Implementing the expert
object recognition pathway,” in Proceedings of the 3rd Interna-
tional Conference on Vision Systems (ICVS ’03),Graz,Austria,
April 2003.
[49] L. Itti, C. Gold, and C. Koch, “Visual attention and target
detection in cluttered natural scenes,” Optical Eng ineering,
vol. 40, no. 9, pp. 1784–1793, 2001.
[50] L. Itti and C. Koch, “A saliency-based search mechanism for
overt and covert shifts of visual attention,” Vision Research,
vol. 40, no. 10–12, pp. 1489–1506, 2000.
[51] R. Newcombe, “An interactive bottom-up visual atten-
tion toolkit in Java,” />∼ranewc/
research/visualAttentionJava.html.
[52] W Y. Ma and H. J. Zhang, “Benchmarking of image features
for content-based retrieval,” in Proceedings of the 32nd IEEE
Conference Record of the Asilomar Conference on Signals, Sys-
tems and Computers, vol. 1, pp. 253–256, Pacific Grove, Calif,
USA, November 1998.
[53] Y.Chen,J.Z.Wang,andR.Krovetz,“CLUE:cluster-basedre-
trieval of images by unsupervised learning,” IEEE Transactions
on Image Processing, vol. 14, no. 8, pp. 1187–1201, 2005.
[54] L. Kaufman and P. Rousseeuw, Finding Groups in Data: An In-
troduction to Cluster Analysis, John Wiley & Sons, New York,
NY, USA, 1990.
Oge Marques is an Assistant Professor
intheDepartmentofComputerScience
and Engineering at Florida Atlantic Uni-
versity in Boca Raton, Florida. He re-
ceived his B.S. degree in electrical engineer-
ing from Federal University of Technology
Paran
´
a (UTFPR) in Curitiba, Brazil, a Mas-
ter’s degree in electronic engineering from
Philips International Institute of Techno-
logical Studies in Eindhoven, The Nether-
lands, and a Ph.D. degree in computer engineering from Florida At-
lantic University. His research interests and publications have been
focused on image processing, analysis, annotation, search, and re-
trieval; human and computer vision; video processing and analysis;
and secure multimedia communications. He is a Member of ACM,
IEEE, IEEE Computer Society, and the honor societies of Phi Kappa
Phi and Upsilon Pi Epsilon.
Liam M. Mayron is a Ph.D. candidate with
the Department of Computer Science and
Engineering at Florida Atlantic University.
He received his M.S. degree from the Uni-
versity of Florida. His research interests in-
clude content-based image retrieval, biolog-
ically inspired computing, data mining, and
the Internet.
GustavoB.Borbais a Ph.D. student with
theDepartmentofElectronicsatFederal
University of Technology, Paran
´
a(UTFPR)
and a Lecturer at Ensitec School of Tech-
nology, Curitiba, Brazil. He received his
B.S. deg ree in electrical engineering and
Master’s degree from UTFPR. His research
interests include content-based image re-
trieval, image processing, biologically in-
spired computing and embedded systems.
Humberto R. Gamba is a Lecturer in the
Department of Electronics at Federal Uni-
versity of Technology Paran
´
a(UTFPR)in
Curitiba, Brazil. He received his B.S. de-
gree in electrical engineering from UTFPR,
a Master’s degree in electrical engineering
from Campinas State University (Camp-
inas, Brazil) and a Ph.D. degree in medi-
cal physics from University of London. His
current research interests include content-
based image retrieval, fMRI, image processing, and electronics in-
strumentation.