Báo cáo hóa học: " Research Article New Approaches for Channel Prediction Based on Sinusoidal Modeling" pdf
Bạn đang xem bản rút gọn của tài liệu. Xem và tải ngay bản đầy đủ của tài liệu tại đây (1.66 MB, 13 trang )
Hindawi Publishing Corporation
EURASIP Journal on Advances in Signal Processing
Volume 2007, Article ID 49393, 13 pages
doi:10.1155/2007/49393
Research Article
New Approaches for Channel Prediction Based on
Sinusoidal Modeling
Ming Chen,
1
Torbj
¨
orn Ekman,
2
and Mats Viberg
1
1
Department of Signals and Systems, Chalmers University of Technology, SE 412 96 G
¨
oteborg, Sweden
2
Department of Electronics and Telecommunications, Norwegian Institute of Scie nce and Technology,
NO-7491 Trondheim, Norway
Received 4 December 2005; Revised 4 April 2006; Accepted 30 April 2006
Recommended by Kostas Berberidis
Long-range channel prediction is considered to be one of the most important enabling technologies to future wireless communica-
tion systems. The prediction of Rayleigh fading channels is studied in the frame of sinusoidal modeling in this paper. A stochastic
sinusoidal model to represent a Rayleigh fading channel is proposed. Three different predictors based on the statistical sinusoidal
model are proposed. These methods outperform the standard linear predictor (LP) in Monte Carlo simulations, but underper-
form with real measurement data, probably due to nonstationary model parameters. To mitigate these modeling errors, a joint
moving average and sinusoidal (JMAS) prediction model and the associated joint least-squares (LS) predictor are proposed. It
combines the sinusoidal model with an LP to handle unmodeled dynamics in the signal. The joint LS predictor outperfor ms all
the other sinusoidal LMMSE predictors in suburban environments, but still performs slightly worse than the standard LP in urban
environments.
Copyright © 2007 Ming Chen et al. This is an open access article distributed under the Creative Commons Attribution License,
which permits unrestricted use, distr ibution, and reproduction in any medium, provided the original work is properly cited.
1. INTRODUCTION
Link adaption techniques, such as multiuser diversity, adap-
tive modulation and coding, and fast scheduling hold great
promise to improve spectrum efficiency. However, the im-
provement on the system capacity depends heavily on the
predictability of the short-term channel fades [1, 2]. Exten-
sive studies on this topic were made during the last several
years by different researchers [1], [3–10]. It was found that
a prediction horizon corresponding to a distance of half a
wavelength traveled by the mobile is considered challeng-
ing [11]. In this paper, we assume the availability of a vector
y
= [y(t), y(t − 1), , y(t − N +1)]
T
containing the N chan-
nel observations (successive estimates of a particular channel
coefficient)
y
= h + e,(1)
where h
= [h(t), h(t −1), , h(t −N +1)]
T
is the time evolu-
tion of the true channel, and e
= [e(t), e(t − 1), , e(t − N +
1)]
T
is the additive estimation errors with Gaussian distribu-
tion CN (0, σ
2
e
I
N
), where I
N
is the N ×N identity matrix. The
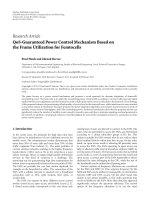
value h(t + L)istobepredictedfromobservationsy,where
L is the prediction horizon. Such a scenario is presented in
Figure 1, where the time index t
= 0 and the length of the
observation interval is N
= 100. The published channel pre-
dictors are divided into two categories, which can be catego-
rized as model-free predictors and model-based predictors,
respectively.
1.1. Model-free channel predictors
The first category is essentially the class of linear predictors
(LP), where the channel coefficient is predicted as a weighted
sum of the previous channel observations. A dth order LP of
h(t + L), where d<N,is
h
(t + L)
=
d−1
k=0
β
k
y(t − k) = β
T
d
y
d
= f
H
l
y,
(2)
where
f
H
l
=
β
T
d
0
1xN−d
(3)
is the coefficient vector of the LP.
A large number of algorithms can be found in the liter-
ature to estimate β under various optimization criteria, for
2 EURASIP Journal on Advances in Signal Processing
y = h + e
h(L)
100 80 60 40 20 0
Index of channel observations
40
35
30
25
Amplitude (dB)
Figure 1: Prediction of Rayleigh fading channel.
instance, the least squares (LS) estimate, which is
β
d
=
Y
H
ls
Y
ls
−1
Y
H
ls
y
ls
= Y
†
ls
y
ls
,
(4)
where
y
ls
=
y(t), y(t − 1), , y(t − N + L + d)
T
(5)
and the matrix Y
ls
is a Hankel mat rix, which is
Y
ls
=
⎡
⎢
⎢
⎢
⎢
⎣
y(t−L) y(t−L − 1) ··· y(t−L − d+1)
y(t
−L − 1) y(t −L − 2) ··· y(t−L − d)
.
.
.
.
.
.
.
.
.
.
.
.
y(t
−N +d) y(t−N +d−1) ··· y(t−N +1)
⎤
⎥
⎥
⎥
⎥
⎦
.
(6)
1.2. Model-based channel predictors
In the second category, the channel over a short observation
interval is modeled as superimposed deterministic complex
sinusoids, which correspond to the Doppler frequencies as in
the Jakes model [12],
y(t)
= h(t)+e(t) =
p
i=1
ρ
i
e
jφ
i
e
jω
i
t
+ e(t), (7)
where p is the number of sinusoids, ρ
i
, φ
i
,andω
i
are the
real amplitude, phase, and the Doppler frequency associated
with the ith path, respectively, and e(t) is the additive com-
plex Gaussian estimation error, e(t)
∼ CN (0, σ
2
e
). Assuming
there are no moving reflecting objects, the ith Doppler fre-
quency is
ω
i
=
2πv
λ
cos θ
i
,(8)
where v is the velocity of the mobile terminal, and θ
i
is the
angle between the ith impinging ray and the mobile heading.
In this model, there are (3p + 1) parameters to be estimated.
They are
ψ
=
ρ
T
, φ
T
, ω
T
, σ
2
e
T
,(9)
where
ρ
=
ρ
1
, , ρ
p
T
, φ =
φ
1
, , φ
p
T
,
ω
=
ω
1
, , ω
p
T
.
(10)
These model parameters are assumed to be stationary over
the observation interval. In these methods, the first step is
to compute parameter estimates of ρ, φ,andω. Then, the
straightforward prediction of h(t + L)is
h(t + L) =
p
i=1
ρ
i
e
j
φ
i
e
j ω
i
(t+L)
. (11)
Let s
i
= ρ
i
e
jφ
i
be the complex amplitude. Then, (7)canbe
written as
y(t)
=
p
i=1
s
i
e
jω
i
t
+ e(t), (12)
and the prediction of h(t + L)is
h(t + L) =
p
i=1
s
i
e
j ω
i
(t+L)
. (13)
In vector form, the N observations can be represented as
y
= As + e, (14)
where
A
=
a
1
, , a
p
, a
k
=
e
jω
k
t
, , e
jω
k
(t−N +1)
T
, (15)
s
=
s
1
, , s
p
T
. (16)
A thorough performance evaluation of linear predictions
and channel predictions based on deterministic sinusoidal
modeling were made by simulations and real world data in
[6]. According to the reported results, the LP outperforms
the deterministic sinusoidal modeling based methods. All
these studies were performed in single-in single-out (SISO)
systems. Later, similar results were reported in multiple-in
multiple-out (MIMO) scenarios in [13]. It was also claimed
that the calculation complexity of LP increases exponentially
with the increase of the dimensions of the MIMO systems.
This makes LP costly for high dimension MIMO channel
prediction. This is one of the motivations to pursue channel
prediction methods based on sinusoidal modeling, where a
fewer number of model parameters is expected than the LP
in MIMO scenarios.
Beside these prediction methods, a nonlinear prediction
of mobile radio channel using the MARS modeling was stud-
ied in [14 ]. In this study, the channel prediction is studied in
the frame of sinusoidal modeling of the fading channel. First,
a statistical sinusoidal model of the Rayleigh fading channel
is proposed. Based on this model, three sinusoidal LMMSE
channel predictors are given. Later a joint moving average
and sinusoidal (JMAS) channel predictor is proposed, which
alleviates the influence of the nonsinusoidal model compo-
nents and leads to the Joint LS predictors.
Ming Chen et al. 3
In this paper, the statistical sinusoidal model and the ex-
tensions into single-in multiple-out (SIMO) and MIMO sys-
tems are presented in Section 2. Three sinusoidal LMMSE
predictors are given in Section 3. The JMAS prediction
and Joint LS predictor are presented in Section 4 . Section 5
presents an analysis of the measurement data and the sta-
tionarity properties of model parameters. The performance
evaluations of these sinusoidal modeling-based methods by
Monte Carlo simulations and real measurement data are pre-
sented in Section 6. Section 7 contains the conclusions.
2. STATISTICAL SINUSOIDAL MODELING
In SISO scenarios, the stochastic sinusoidal modeling of ra-
dio channel has the same form as the deterministic sinusoidal
model in (14), but the complex amplitudes of the sinusoids s
are modeled as zero-mean random variables with covariance
matrix, E[ss
H
] = σ
2
s
I
p
. This extension leads to a number of
LMMSE channel predictors, w hich are presented in the fol-
lowing section.
The statistical sinusoidal model for a SIMO system, with
one transmit antenna and m receive antennas, is
Y
= AS + E, (17)
where
Y
=
y
T
(t), y
T
(t − 1), , y
T
(t − N +1)
T
,
S
=
s
T
1
, s
T
2
, , s
T
p
T
,
E
=
e
T
(t), e
T
(t − 1), , e
T
(t − N +1)
T
,
(18)
where the m-vector y(t) is the channel observations at the
sensor array at time t.MatrixS is p
× m, and the m-vector
s
i
is one realization of the complex random amplitude vector
associated to the ith path. Assume these sinusoids have equal
mean power σ
2
s
,andE[SS
H
] = mσ
2
s
I
p
.Them-vector e(t)
is the additive noise with covariance matrix E[e
H
(k)e(l)] =
σ
2
e
I
m
δ
k,l
. Note that we have assumed that the angle of arrivals,
θ,areidenticalatdifferent antenna elements, but with inde-
pendent amplitudes. In practice, inaccurate calibration of the
array might give rise to such uncorrelated amplitudes.
To derive the signal model for a MIMO system with n
transmit antennas and m receive antennas, first let the SIMO
channel, associated to the kth transmit antenna, be
H
k
= AS
k
, (19)
where A and S
k
are the same as in (17), except the subscripts.
Vect orizing H
k
,wehave
h
k
= vec
H
k
=
vec
AS
k
=
I
m
⊗ A
vec
S
k
,
=
I
m
⊗ A
s
k
,
(20)
where
⊗ is the Kronecker product and vec(·) is the vectoriza-
tion operation [15]. Stacking h
k
, the sinusoidal signal model
for the MIMO channel is
H
=
h
1
, h
2
, , h
n
=
I
m
⊗ A][s
1
, s
2
, , s
n
= AS,
(21)
where the matrices H are (Nm
× n)andS is (pm × n), re-
spectively. The power matrix is E[SS
H
] = nσ
2
s
I
pm
,wherewe
have assumed, again, that the amplitudes are independent
with equal mean power σ
2
s
. Including channel estimation er-
rors, the observed channel based on sinusoidal modeling for
MIMO system becomes
Y
= AS + E . (22)
Note that we have assumed here that all mn subchannels
share the same Doppler frequencies. The extension to the
general case is ob vious, but introduces considerably more
unknown parameters to be estimated.
In the following sections, we restrict our study within
SISO scenarios.
3. LMMSE PREDICTORS
In this paper we are not concerned with the frequency es-
timation problem, but focus on prediction only. A number
of successful frequency estimation methods have been pub-
lished in the literature [16–19]. The class of subspace meth-
ods provides high-performance estimators at low cost, and
of these we have chosen the unitary ESPRIT method due to
[20].
3.1. Conditional LMMSE channel predictor
Assume that the frequency estimates
ω = [ω
1
, , ω
p
]are
given, the LMMSE estimate of s is then [4]
s =
A
H
A + αI
−1
A
H
y = R
−1
reg
A
H
y, (23)
where
A is defined as A, but using the estimated frequencies
ω
k
instead of the true frequencies, and α = σ
2
e
/σ
2
s
= 1/SNR.
This can also be interpreted as a regularized LS estimator.
Moreover, the LMMSE prediction of h(t + L) (given that
ω is
assumedtobecorrect)isgivenby
h(t + L) =
e
j ω
1
(t+L)
, e
j ω
p
(t+L)
s
= a(L)
H
R
−1
reg
A
H
y = f
H
c
y,
(24)
where
a(L)
H
=
e
j ω
1
(t+L)
, , e
j ω
p
(t+L)
,
f
H
c
= a(L)
H
R
−1
reg
A
H
(25)
is the conditional prediction filter. If the complex amplitudes,
s, are modeled as Gaussian random variables, CN ( 0, σ
2
s
I
N
),
the statistical sinusoidal signal model (14)istermedBayesian
general linear model in [21], and the conditional LMMSE pre-
dictor is also the conditional MMSE predictor [10].
3.2. Adjusted conditional LMMSE channel predictor
Above, the frequency estimates
ω were regarded as exact. In
practice,
ω is estimated by some method, such as unitary ES-
PRIT [20], and subject to errors. The error variance, in the-
ory, is determined by the SNR and the number of observa-
tions [21]. Such a problem was investigated in [22, 23]. De-
fine the residual signal
=[(t), , (t − N +1)]
T
as the part
4 EURASIP Journal on Advances in Signal Processing
of the observations which cannot be accurately reconstructed
by the estimated sinusoidal model,
= y −
h, (26)
where
h =
As. In the imperfect modeling case, a low-order
LP is required to predict the colored residuals
(t + L), which
contain less signal dynamics than y. So the adjusted condi-
tional LMMSE predictor is
h
adj
(t + L) =
h(t + L)+
(t + L). (27)
The predictor
(t +L) is computed based on past residuals as
(t + L) =
d−1
k=0
β
k
(t − k). (28)
The coefficients β
d
= [β
0
, , β
d−1
]
T
are computed by solv-
ing an LS problem. To explicitly show the dependency of
(t + L) on the channel observation y,werewrite(28)as
(t + L) =
β
T
d
0
T
N
−d
I
N
−
AR
−1
reg
A
H
y = f
H
y,
(29)
where 0
N−d
is an (N − d)zerovector,andf
H
is the residual
predictor. Then, the adjusted conditional LMMSE predictor
(27) can be expressed as
h
adj
(t + L) =
f
H
c
+ f
H
y = f
H
a
y,
(30)
where f
H
a
is the adjusted conditional LMMSE prediction fil-
ter.
3.3. Unconditional LMMSE predictor
Another approach to combat the frequency estimation error
is motivated by introducing the frequency estimation un-
certainty into the conditional LMMSE predictions. We can
model ω
k
as a random variable with mean ω
k
and variance
E[Δω
2
k
] = σ
2
Δω
k
,
ω
k
= ω
k
+ Δω
k
. (31)
The classical form of the LMMSE predictor is given by the
Wiener filter [21],
h(t + L) = R
hy
R
−1
yy
y, (32)
where
E
h(t + L)
y
h(t + L)
H
y
H
=
σ
2
h
R
hy
R
yh
R
yy
l
. (33)
The covariance matrix for N observations is
R
yy
= E
yy
H
= R
hh
+ R
ee
. (34)
Under the assumption that the amplitudes and frequency es-
timation errors are independent stochastic variables, we can
write the (m, n)th element of R
hh
as
R
hh
mn
= E
Ass
H
A
H
mn
=
p
k=1
E
|
s
k
|
2
E
e
j(ω
k
+Δω
k
)(n−m)
.
(35)
The expectation over the frequency estimation error can be
expressed as
E
e
j(ω
k
+Δω
k
)(n−m)
=
e
j ω
k
(n−m)
E
e
jΔω
k
(n−m)
=
e
j ω
k
(n−m)
Φ
Δω
k
(n − m),
(36)
where Φ
Δω
k
(τ) is the characteristic function of the frequency
estimation error Δω
k
. If we assume the frequency errors to
be Gaussian distributed, then
Φ
Δω
k
(n − m) = e
−(σ
2
Δω
k
/2)(n−m)
2
. (37)
The expectation over the ensemble of amplitudes is just the
variance
E
|s
k
|
2
=
σ
2
s
. (38)
The (m, n)th element of the covariance matrix is thus ob-
tained as
R
hh
mn
=
p
k=1
σ
2
s
e
j ω
k
(n−m)
e
−(σ
2
Δω
k
/2)(n−m)
2
. (39)
For simplicity, let all the frequency errors be IID with σ
2
Δω
k
=
σ
2
Δω
. We then have
R
hh
mn
= σ
2
s
p
k=1
e
j ω
k
(n−m)
e
−(σ
2
Δω
/2)(n−m)
2
. (40)
Define the (N
× N) damping matrix Γ by
[Γ]
mn
= e
−(σ
2
Δω
/2)(n−m)
2
. (41)
The covariance matrix can then be expressed as
R
hh
= σ
2
s
A
A
H
Γ, (42)
where
denotes the Hadamard product. Similarly, the cross
covariance R
hy
is given by
R
hy
= E
a(L)
H
ss
H
A
H
=
p
k=1
E
s
k
2
·
E
e
j(ω
k
+Δω
k
)L
, , e
j(ω
k
+Δω
k
)(L+N−1)
.
(43)
Define the damping vector
γ
=
e
(−σ
2
Δω
/2)L
2
, , e
(−σ
2
Δω
/2)(L+N −1)
2
. (44)
The cross covariance is then obtained as
R
hy
= σ
2
s
p
k=1
e
j ω
k
L
, , e
j ω
k
(L+N−1)
γ
= σ
2
s
a(L)
H
A
H
γ.
(45)
The unconditional LMMSE predictor is finally given by (just
some variation)
h(t + L) = R
hy
R
−1
yy
y
=
a(L)
H
A
H
γ
A
A
H
Γ + αI
N
−1
y
= f
H
u
y,
(46)
Ming Chen et al. 5
where
f
H
u
=
a(L)
H
A
H
γ
A
A
H
Γ + αI
N
−1
(47)
is the unconditional prediction filter. Clearly, the influence
of old observations is reduced by the damping matrix Γ and
the damping vector γ, w hich are also dependent on the pre-
diction range. The further ahead we are looking, the smaller
the gain of the predictor is. The way the frequency error is
taken into account can be interpreted as a convolution of
the line spectrum of the signal with the error distribution.
The filter design is thus done for distributed sources. The er-
rors in the frequency estimates force the predictor to miss-
trust older data, as even a small frequency error can cause
a large phase error if one waits long enough. As the special
case, when σ
2
Δω
= 0, (46) degenerates to (24). When σ
2
Δω
> 0,
(46), although being LMMSE (ignoring the influence of s
k
on the estimate of ω
k
), is not the MMSE due to the nonlinear
dependency on the frequency estimates.
4. JMAS PREDICTION MODEL AND
JOINT LS PREDICTOR
In order to represent signals with more general spectral char-
acteristics, let the estimate of h(t + L) be modeled by
h(t + L) = y
T
d
β
d
+ a(L)
H
s + e(t + L), (48)
where ω in a(L) contains only the frequencies of the station-
ary sinusoidal signals, which are determined by some model
selection method. With this model, the channel is divided
into two parts. One part contains the consistent sinusoidal
signals, such as the direct rays in LOS scenarios. The second
part captures all the remaining power in the observations.
This prediction model is interpreted as the joint moving av-
erage and sinusoidal (JMAS) predictor. Note that the name
refers to the predictor, but not to the signal model. Select-
ing which sinusoids to use in the predictor is not a trivial
problem, and deserves further study. A possibility is to use
frequency tracking and apply some stationarity measure for
each frequency tr ack.
Due to the linearity of the autoregressive and sinusoidal
bases, the model parameters,
θ
= [β
T
d
s
T
]
T
,canbeestimated
jointly. Given
ω,(48)canberewrittenas
h(t + L) =
y
T
d
a(L)
H
β
d
s
. (49)
In vector form, we have
h
N−L−d+1
=
Y
ls
A
J
β = Hθ, (50)
where
h
N−L−d+1
=
h(t),
h(t − 1), ,
h(t + L − N + d)
T
,
A
J
=
a
J1
, a
J2
, , a
Jp
,
a
Jk
=
e
j ω
k
(t+L)
, e
j ω
k
(t+L−1)
, , e
j ω
k
(t+2L−N +d)
T
.
(51)
To take into account the prediction model error, (50)canbe
rewritten as
y
ls
=
h
N−L−d+1
+ u
= Hθ + u,
(52)
where u
= [u(t), u(t−1), , u(t−N +L+d)]
T
with Gaussian
distribution CN (0, σ
2
u
I
N−L−d+1
). Then, the LS estimate of θ
is
θ =
H
H
H
−1
H
H
y
ls
. (53)
The channel prediction is
h(t + L) =
y
T
d
a(L)
H
θ, (54)
which is named Joint LS predictor. In the terminology of the
previous sections, it is a conditional LS predictor, since
ω is
assumed to be given and s is modeled as deterministic.
Finally, substitute (53) into (54)toobtain
h(t + L) =
y
T
d
a(L)
H
H
H
H
−1
H
H
y
N−L−d+1
=
y
T
d
a(L)
H
(H
H
H)
−1
H
H
0
M
y = f
H
J
y,
(55)
where the 0
M
is a zero matrix of conformable dimensions,
and
f
H
J
=
y
T
d
a(L)
H
H
H
H
−1
H
H
0
M
(56)
is the joint LS prediction filter. Note that this is a nonlinear
predictor, since H depends on y.
The difference between the joint LS method and the ad-
justed conditional LMMSE predictor in Section 3.2 can be
seen by rew riting (26)as
= y −
A
A
H
A
−1
A
H
y
=
I
N
−
A
A
H
A
−1
A
H
y = Π
⊥
A
y.
(57)
So that (27)becomes
h
adj
(t + L) =
T
d
a(L)
H
β
d
s
=
1
T
d
0
T
N
−d
T
Π
⊥
A
y
T
a(L)
H
θ,
(58)
where 1
T
d
is a d-vector with all ones. It can be seen that the
autoregressive bases are orthogonal to the sinusoidal bases in
(58), but they are not in (49).
In general, the total order of the joint LS prediction,
r
= p + d, can be determined by some classical criterion,
that is, AIC [24]andMDL[25]. So a wide sense definition
of model selection includes the selection of the stationary si-
nusoidal part of the signals, p, and the order of the LP, d,or
both at once. In this paper, the model selection refers to the
selection of the strong and stationary sinusoidal signals only.
In practice, it is probably a wise idea to overestimate the
rank, and estimate unnecessarily many sinusoids. But only
a subset of these is used in the predictor. The tricky part is
to know which ones to keep. With only one data set, one
would probably go for the ones with the largest estimated
6 EURASIP Journal on Advances in Signal Processing
amplitude. With several data sets, one could try to evalu-
ate the stationarity of the various frequency estimates, but
this requires a clever sorting (data association) to create fre-
quency tracks.
5. ANALYSIS OF MEASUREMENT DATA
5.1. Measurement data
A measurement campaign was performed in the urban area
of Stockholm, and the suburban area, Kista, a few kilome-
ters north of central Stockholm. The measurements were
performed at 1880 MHz, and the bandwidth is 5 MHz. In
total, 45 and 31 effective measurements were performed at
different ur ban and suburban locations, respectively. The
velocities of the mobile station were between 30 to 90 km
per hour during the measurements, except for a few stand
still cases. Each measurement records channel sounding data
over 156.4 ms and contains 1430 repetitions of channel im-
pulse responses. This gives rise to the channel update rate
of 9.1 KHz. Each channel impulse response (or power delay
profile) is described by 120 taps with a sampling frequency of
6.4 MHz. The time interval between two neighboring taps is
0.156 μs.
In this study, the strongest channel tap in each measure-
ment is used in the performance evaluations of the proposed
channel prediction methods, which can be considered as a
narrow band Rayleigh fading channel.
Obviously, the performance of the sinusoidal modeling-
based channel prediction methods depends heavily on the
stationarity properties of model parameters in the obser-
vation window and the prediction horizon. In this section,
the stationarity of the model parameters is investigated by
means of the short-term MUSIC pseudospectrum (MPS)
and model parameter tracking.
5.2. MUSIC pseudospectrum
TheMUSICpseudospectrum(MPS)isdefinedas[16]
p
mu
(ω) =
a(ω)
H
a(ω)
a(ω)
H
Π
⊥
a(ω)
, ω
∈
− f
max
, f
max
, (59)
where Π
⊥
= U
n
U
H
n
, and the columns of U
n
are the eigenvec-
tors spanning the noise space of the covariance matrix of the
data sequence y, R
yy
= E[yy
H
]. It can be obtained by taking
eigenvalue decomposition of R
yy
as
R
yy
=
U
s
U
n
Λ
s
Λ
n
U
H
s
U
H
n
=
U
s
Λ
s
U
H
s
+ U
n
Λ
n
U
H
n
,
(60)
where a rank estimation algorithm is necessary, and the
eigenvalues are ordered in nonincreasing order. In case of
high SNR, MPS is not sensitive to under-estimated noise sub-
space dimension, while an overestimated noise space will at-
tenuate certain weak frequency components. The a(ω) is the
DFT vector associated with frequency ω,and f
max
is the max-
imum Doppler frequency.
10 20 30 40
Number of blocks
1
0
1
2
3
4
5
0.1
0.05
0
0.05
0.1
Frequency (rad/s)
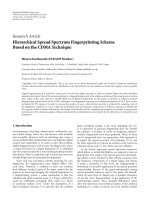
Figure 2: Example of a MUSIC pseudospectrum of a measurement
in an urban area. A number of high-power frequency bins can be
observed. They are distributed on both the positive and negative
sides of the spectrum. But the relative power between these bins and
the remaining frequency bins is low. Those bins close to the posi-
tive and negative maximum Doppler frequencies are more consis-
tent over the measurements than the others. These bins have blurry
edges.
10 20 30 40
Number of blocks
1
0
1
2
3
4
0.1
0.05
0
0.05
0.1
Frequency (rad/s)
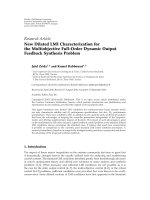
Figure 3: Example of a MUSIC pseudospectrum of a measurement
in a suburban area. A fewer number of high-power frequency bins
are observed compared to Figure 2. The locations of these frequency
bins are biased to the negative side in the spectrum. The edges of
these high-power frequency bins are much sharper than those in
Figure 2. The power in the strongest frequency bin is much higher
than the others and is consistent over the whole measurement in-
terval.
The MPS is calculated over each segmented data block,
where a sliding window is applied for data extraction. Ex-
amples of typical time varying MPSs in urban and subur-
ban channels are presented in Figures 2 and 3,respectively.
In these two measurements, the mobile speeds were around
30 km/h, the original data is downsampled by a factor of
10, and the window length (after downsampling) is 100,
Ming Chen et al. 7
which corresponds to a spatial observation inter val of 6 λ.
The numbers of sinusoids are set to be 8 and 7, respectively,
which is assumed to be slightly overestimated. In these fig-
ures, the grayscale of the contours indicates the powers in the
frequency bins.
In Figure 2, the MPS from an urban measurement is
given, where a number of frequency bins with deeper
grayscale appear in the spectrum. A number of relatively
high-power and stationary frequency bins, close to the posi-
tive and negative maximum Doppler frequencies, can be ob-
served. Their edges are blurry, which implies that these bins
are contributed by a cluster of (or more than one) close,
but separated reflectors. This is coincident with our simula-
tion results. The remaining frequency bins, close to zero fre-
quency, are weaker and less stationary. This is due to that the
low Doppler frequencies are associated with the impinging
rays perpendicular to the mobile velocity. The observed fre-
quencies and amplitudes belonging to these rays are more
likely to experience large time variation over the observa-
tion interval compared to the maximum Doppler frequency
components close to the direction or the inverse direction of
the mobile velocity. Such a spectrum agrees with the typical
Doppler spectrum in a rich scattering urban environment.
These nonstationary frequency bins might render sinusoidal
modeling-based channel prediction difficult.
The MPS in Figure 3 is obtained from a measurement in
a suburban area. It has much fewer high-power frequency
bins compared to what is observed in urban measurement as
given in Figure 2. The distribution of these frequency bins in
the spectrum is biased to the negative side in this example.
This is probably due to that the mobile station was moving
away from the base station or the reflection objects during
the measurement. The edges of these high-power frequency
bins are much sharper than those in Figure 2. This indicates
that e ach bin might contain only one pure sinusoid. This is
also coincident with a typical Doppler spe ctrum in a sub-
urban or rural area in LOS. The power in the strongest fre-
quency bin is much higher than the others, and is consistent
over the whole measurement interval.
5.3. Model parameter tracking
Similar to the study of the MPSs, estimates of the model
parameters (frequencies and amplitudes) are computed for
each data block using the unitary ESPRIT and LS methods.
The estimates of the frequencies and amplitudes using the
same urban and suburban example measurement are plot-
ted as a function of the number of data blocks in Figures 4
and 5, respectively. The numbers of sinusoids are assumed to
be 8 and 7 for urban and suburban example measurements,
respectively, as b efore. In these figures, the channel ampli-
tudes and phases are given in subplots (a) and (b). The es-
timated frequencies and the associated amplitudes are given
in subplots (c) and (d), where different markers are used for
frequency and amplitude estimates associated with each si-
nusoid.
In Figure 4, which is the urban case, the dynamic range of
the channel amplitude is larger than the one in the suburban
measurement, as given in subplot (a) in Figure 5. The chan-
nel phase is linear in just a part of the measurement, which
indicates that there might be just one dominant sinusoid in
the linear part of the channel, but more comparable dom-
inant sinusoids in the remaining part. In subplot (d), one
amplitude is much higher than others, which is marked by
an asterisk. Its frequency is close to
−0.1asseeninsubplot
(c). The amplitude of this ray is consistent over the obser-
vation interval. Besides this sinusoid, a number of sinusoids
with well-separated frequencies are found in subplot (c), but
their amplitudes are time varying and comparable. The vari-
ations of these amplitudes are much larger than that of the
first frequency. The presence of these sinusoids might explain
the large variation of the channel amplitudes and nonlinear
phaseinthismeasurement.
In Figure 5, the parameter tracking using the suburban
example measurement is given. Both the average and the
variation of the channel amplitude are smaller than in the
urbanmeasurement,asseeninsubplot(a)inFigure 4.The
phase of the channel is quite linear over the whole measure-
ment interval. In subplot (d) there are two sinusoids marked
by a triangle and a circle having the strongest amplitudes
among all the estimated sinusoids. The frequencies associ-
ated with these two sinusoids are extremely close, as seen in
subplot (c). This may be due to over estimated number of si-
nusoids and indicates that the channel could be well modeled
by just one dominant sinusoidal component.
6. PERFORMANCE EVALUATIONS
6.1. Measures of prediction performance
The performance of the predictors is evaluated by Monte
Carlo simulations and measurements. The normalized mean
square error (NMSE) is adopted in this paper for perfor-
mance evaluations. First, we define the normalized square
error (NSE) in a single realization as
e
2
NSE
(t + L) =
N
h(t + L) −
h(t + L)
2
h
H
h
. (61)
Then, the NMSE is the mean value of e
2
NSE
(t + L) taken over
the Monte Carlo simulations. However, an adjusted NMSE
(ANMSE) is also introduced to get rid of the influence of
a small amount of outliers which might ruin the whole av-
eraged performance. So the outliers are dropped when the
NSE of their power prediction is larger than 0.04, or in other
words, when the prediction error of the complex amplitude
is larger than 20% of the root mean square (RMS) channel
amplitudes.
The concept of level of confidence is also used in the per-
formance evaluation. For example, when we say the NMSE of
a channel predictor is
−10 dB with the level of confidence of
95%, we mean that the average of the NSEs of the best 95% of
the channel predictions from simulations or measurements is
less than
−10 dB, while the worst 5% c ases are excluded.
It is also worth noting that when the measurement data
is used, the channel observation y(t + L) is used as h(t + L),
8 EURASIP Journal on Advances in Signal Processing
0 50 100
Number of samples
0
1
2
3
10
3
Channel amplitude
(a)
0 50 100
Number of samples
4
2
0
2
4
Channel phase (rad)
(b)
010203040
Number of blocks
0.2
0.1
0
0.1
0.2
Estimated frequencies (rad/s)
(c)
010203040
Number of blocks
10
6
10
4
10
2
Estimated amplitudes
(d)
Figure 4: Example of the time variation of model parameters in an urban area: (a) the channel amplitude, whose dynamic range is large in
this example; (b) the phase of the channel, which is linear in a part of this measurement; (c) the estimated frequencies of the sinusoids in
each block, the number of sinusoids is assumed to be 8; (d) the amplitudes of the sinusoids associated to the frequencies in (c).
and the prediction error is normalized by the mean power of
y, instead of h asgivenin(61).
6.2. Model selection based on SVD
In this study, an ad hoc singular-value-decomposition-
(SVD-) based model selection method is proposed. First, the
number of the consistent sinusoidal signals is estimated us-
ing the ith largest gradient method. It chooses the index of
the descending ordered singular values which g ives the ith
largest gradient in linear scale. For example, an m-vector
σ
=
σ
1
, , σ
r−1
, σ
r
, , σ
m
T
(62)
contains the singular values from the SVD of Y
ls
,whereL = 0
and d
= m. The value of m should be larger than the number
of sinusoids. These singular values are arranged in descend-
ing order. If (σ
r−1
− σ
r
) gives the ith largest gradient between
adjacent singular values, σ
r
is cal led the break point, and the
index r is then selected as the number of consistent sinusoidal
signals. In the second step, p frequencies are estimated from
the data block, where p>r. The frequencies that have the r
largest estimated amplitudes are, then, assumed to be consis-
tent.
The selection of i in this simple method is environment
dependent. In a suburban area, most rays can be expected
to be consistent. We could therefore choose a larger i.Butin
an urban area, this method might not fit, since some sinu-
soids are strong, but not stationary. This means that a small
i should be selected for urban measurements to be conser-
vative. In the follow ing performance evaluations, we choose
i
= 1andi = 3 for urban measurements and suburban mea-
surements, respectively, which provide the best performance
for the methods in Section 2.
6.3. Simulation setup
The simulation parameter setting is as follows:
(i) SISO scenario;
(ii) spatial channel sampling interval
= 0.1 λ (Δl = 0.1);
(iii) prediction horizon
= 0.5 λ (L = 5);
Ming Chen et al. 9
0 50 100
Number of samples
0.5
1
1.5
2
2.5
3
10
3
Channel amplitude
(a)
0 50 100
Number of samples
4
2
0
2
4
Channel phase (rad)
(b)
010203040
Number of blocks
0.2
0.1
0
0.1
0.2
Estimated frequencies (rad/s)
(c)
02040
Number of blocks
10
5
Estimated amplitudes
(d)
Figure 5: Example of the time variation of model parameters in a suburban area: (a) the channel amplitude, whose dynamic range is smaller
than in Figure 4; (b) the phase of the channel, which is linear in the whole measurement interval; (c) the estimated frequencies of the
sinusoids in each block, the number of sinusoids is assumed to be 7; (d) the amplitudes of the sinusoids associated to the frequencies in (c).
(iv) number of sinusoids = 8(p = 8, which is assumed to
be known);
(v) number of samples
= 100 (N = 100);
(vi) number of Monte Carlo simulations
= 1000;
(vii) order of LP is two times the number of sinusoids;
(viii) in the combined method, the model selection is based
on the powers of sinusoids. Specifically the sinusoids
with
|s
k
| > 2σ
e
are predicted by the conditional
LMMSE method, the residual is predicted using an LP
with order 2 (d
= 2);
(ix) the frequency error variance is used as a design param-
eter, and is taken to be σ
2
Δω
= 1/N
3
. This is somewhat
arbitr ary, but is motivated by the CRLB [21];
(x) the unitary ESPRIT method is used for frequency esti-
mation.
In Figure 6, the cumulative density function (CDF) of the
NMSE is presented. All sinusoidal model-based predictors
have light tails, but the LP has a heavy tail.
The ANMSE of different predictors is given in Figure 7.
It can be seen that the conditional LMMSE predictor with
known frequency and the LP have the best and the worst
performances, respectively. The conditional LMMSE predic-
tor with estimated frequency has much better performance
than the LP in the investigated scenarios. The unconditional
LMMSE predictor performs slightly better than the condi-
tional LMMSE predictor. The performance of the adjusted
conditional LMMSE predictor approaches that of the con-
ditional LMMSE predictor with known frequency with the
increase of SNR.
Note that, in these simulations, for a given carrier fre-
quency, f , and velocity, v, the spatial sampling interval can
be easily converted into time sampling interval as Δt = (Δl ·
c)/( f · v), where c is the speed of radio propagation.
6.4. Performance evaluation of LMMSE predictors
using measured data
The original data is downsampled by a downsampling ratio
(DSR) of 10 to reduce the calculation load and increase the
prediction horizon, which gives rise to a sampling frequency
10 EURASIP Journal on Advances in Signal Processing
0 10203040
Average SNR (dB)
0
0.2
0.4
0.6
0.8
1
Probability
Unconditional LMMSE
Conditional LMMSE
LMMSE, known ω LP
Adjusted
Figure 6: Probability of channel prediction error less than 20%
(L
= 0.5 λ, N = 100, 8 rays).
0 10203040
Average SNR (dB)
10
6
10
5
10
4
10
3
10
2
10
1
ANMSE
Unconditional LMMSE
Conditional LMMSE
LMMSE, known ω LP
Adjusted
Figure 7: Adjusted NMSE of channel prediction (L = 0.5 λ, N =
100, 8 rays).
of 910 Hz. After the downsampling, the evaluation parameter
settings are
(i) number of samples
= 100 (N = 100), which is cor-
responding to a measurement interval of 0.92 m (6 λ)
or 2.75 m (18 λ) in distance at the speed of 30 km/h or
90 km/h, respectively;
(ii) the prediction horizon L is 5, which is λ/3or1λ at the
above speeds and the frequency band of 1880 MHz; in
time scale, it is a prediction of 5.5 ms into the future.
0.20.40.60.81
Level of confidence
40
35
30
25
20
15
10
5
0
NMSE (dB)
Conditional LMMSE
LP Unconditional LMMSE
Adjusted
Figure 8: Performance evaluation of LMMSE prediction methods
in an urban area.
(iii) the SNRs used in the conditional LMMSE prediction
methods are estimated from the associated power de-
lay profiles;
(iv) the order of the LP in the adjusted conditional LMMSE
predictors is 2, which is fixed;
(v) the order of the standard LP is set to be the same as the
signal order estimated for the data block using model
selection method;
(vi) the 1st and 3rd largest gradients are used for the model
selection based on SVD for urban and suburban envi-
ronments, respectively;
(vii) other settings are the same as in Section 6.3.
With these settings there are 39 blocks of data in each
measurement. In total, 1755 and 1209 blocks of data are ob-
tained in urban and suburban areas, respectively.
In Figure 8 the overall NMSEs of different prediction
methods using all measurement data in an urban area are
presented versus the level of confidence. It is meaningless to
discuss the achievable NMSEs in this case due to the lim-
ited number of measurements. We put our attention on the
relative performance instead. In this figure, the LP has the
best performance. The conditional LMMSE predictor has
the worst performance. The unconditional LMMSE predic-
tor outperforms the conditional LMMSE predictor. The ad-
justed conditional LMMSE predictor outperforms the con-
ditional LMMSE predictor and the unconditional LMMSE
predictor, and is slightly worse than LP.
In Figure 9, the results using suburban measurements are
given. Similar results are observed. In these results, the per-
formances of the conditional LMMSE and the unconditional
LMMSE predictor are even closer compared to those in an
urban area. This is mainly due to that the frequency sep-
aration is larger in suburban than in urban environments.
The adjusted conditional LMMSE predictor outperforms the
Ming Chen et al. 11
0.20.40.60.81
Level of confidence
40
35
30
25
20
15
10
5
0
NMSE (dB)
Conditional LMMSE
LP Unconditional LMMSE
Adjusted
Figure 9: Performance evaluation of LMMSE prediction methods
in a suburban area.
conditional and unconditional L MMSE prediction methods
and underperforms the LP.
6.5. Performance evaluation of joint LS predictors
using measured data
In this study, most parameter settings are the same as in the
previous section except the following.
(i) The order of the standard LP is 4 and fixed.
(ii) Both orders of the LPs in the joint LS predictor and
the adjusted conditional LMMSE predictor are 3 and
fixed.
(iii) The number of sinusoids is 1, where only the strongest
sinusoidal component is selected.
In Figure 10, the overall NMSEs of different prediction
methods using measurement data in an urban area is pre-
sented versus the level of confidence as before. In this case we
see that the LP still performs (slightly) better than the others.
This mig ht be due to the nonstationarity of the model pa-
rameters. In addition, the chosen strategy for model selection
might not be the best. The strong sinusoids might not have
consistent parameters, and the consistent sinusoids are not
necessarily the strongest, especially in urban environments.
But the joint LS predictor is better than the adjusted condi-
tional LMMSE predictors. This improvement is due to the
joint estimate of the model parameters.
In Figure 11, the measurements from the suburban area
are used. It can be seen that the joint LS predictor outper-
forms the other predictors. While the adjusted conditional
LMMSE predictor outperforms the standard LP at a low level
of confidence. This might be because the strongest path is
better described by the sinusoidal model than the nonpara-
metric method.
0.20.40.60.81
Level of confidence
40
35
30
25
20
15
10
5
NMSE (dB)
JLS
Adjusted
LP
Figure 10: NMSE versus level of confidence (urban area).
0.20.40.60.81
Level of confidence
35
30
25
20
15
10
5
NMSE (dB)
JLS
Adjusted
LP
Figure 11: NMSE versus level of confidence (suburban area).
7. CONCLUSIONS
The problem of predicting flat Rayleigh fading channels in
wireless communications is studied in the frame of sinu-
soidal modeling in this paper. A stochastic sinusoidal model
for a Rayleigh fading channel is proposed, based on the
nature of multipath propagation environment in wireless
communications. Given frequency estimation, three sinu-
soidal LMMSE predictors are proposed. They are conditional
LMMSE predictor, unconditional LMMSE predictor, and the
adjusted conditional LMMSE predictor. They outperform
12 EURASIP Journal on Advances in Signal Processing
the standard LP in simulations, but underperform using real
data. Thus the model-based estimators are significantly more
tolerant to measurement noise (channel estimation errors),
but suffer from sensitiv ity to modeling errors and nonsta-
tionarities. To take into account unmodeled, but station-
ary, signal components, a joint moving average and sinu-
soidal channel prediction model is proposed, which results
in the joint LS predictor. Together with an SVD-based model
selection method, the joint LS predictor outperforms the
other predictors in a suburban environment. While, in the
same environment, the adjusted conditional LMMSE pre-
dictor outperforms the standard LP at a low level of confi-
dence. But both methods still per form slightly worse than LP
in urban areas. Model select ion based on frequency tracking
might help to further improve the overall performance of the
joint LS method and the adjusted conditional LMMSE pre-
dictor. Finally, we point out that the channel sounding mea-
surements have a very high SNR, and in a practical use the
channel estimates will be more noisy. The enhanced noise
immunity of model-based channel predictors might then
make them a better choice than standard LP.
ACKNOWLEDGMENTS
The authors would like to thank Dr. S
¨
oren Andersson, Hen-
rik Asplund, and Jan-Erik Berg at Ericsson Research for pro-
viding measurement data.
REFERENCES
[1] A. Duel-Hallen, S. Hu, and H. Hallen, “Long-range predic-
tion of fading signals: enabling adaptive transmission for mo-
bile radio channels,” IEEE Signal Processing Magazine, vol. 17,
no. 3, pp. 62–75, 2000.
[2] S. Falahati, A. Svensson, T. Ekman, and M. Sternad, “Adap-
tive modulation systems for predicted wireless channels,” IEEE
Transactions on Communications, vol. 52, no. 2, pp. 307–316,
2004.
[3]J.B.Andersen,J.Jensen,S.Holdt,andF.Frederiksen,“Pre-
diction of future fading based on past measurements,” in Pro-
ceedings of the 50th Vehicular Technology Conference (VTC ’99),
vol. 1, pp. 151–155, Amsterdam, The Netherlands, September
1999.
[4] M. Chen and M. Viberg, “LMMSE channel predictor based on
sinusoidal modeling,” in Proceedings of IEEE Sensor Array and
Multichannel Signal Processing Workshop (SAM ’04), pp. 377–
381, Barcelona, Spain, July 2004.
[5] J K. Hwang and J. H. Winters, “Sinusoidal modeling and pre-
diction of fast fading processes,” in Proceedings of IEEE Global
Telecommunications Conference (GLOBECOM ’98), vol. 2, pp.
892–897, November 1998.
[6] S. Semmelrodt and R. Kattenbach, “Performance Analysis and
Comparison of Different Fading Forecast Schemes for Flat
Fading Radio Channels,” COST 273 TD(03)045, Barcelona,
Spain, January 2003.
[7] T.Ekman,M.Sternad,andA.Ahl
´
en, “Unbiased power predic-
tion of Rayleigh fading channels,” in Proceedings of IEEE Ve-
hicular Technology Conference (VTC ’02), vol. 1, pp. 280–284,
Vancouver, British Columbia, Canada, September 2002.
[8] M. Chen, T. Ekman, and M. Viberg, “Two new approaches for
channel prediction based on sinusoidal modeling,” EURASIP
Journal on Applied Signal Processing, special issue on advances
in subspace-based techniques for signal processing and com-
munications, 2006.
[9] T. Ekman, “An FIR predictor interpretation of LS estimation
of sinusoidal amplitudes followed by extrapolation,” in Pro-
ceedings of the 12th European Signal Processing Conference (EU-
SIPCO ’04), Vienna, Austria, September 2004.
[10] M. Chen, “Channel prediction based on sinusoidal model-
ing,” Licentiate thesis, Chalmers University of Technology,
G
¨
oteborg, Sweden, August 2005.
[11] M. Sternad, T. Ekman, and A. Ahl
´
en, “Power prediction on
broadband channels,” in Proceedings of IEEE Vehicular Tech-
nology Conference (VTC ’01), vol. 4, pp. 2328–2332, Rhodes,
Greece, May 2001.
[12] W. C. Jakes Jr., Microwave Mobile Communications, IEEE Press,
Piscataway, NJ, USA, 1974.
[13] T. Svantesson, J. W. Wallace, and S. Semmelrodt, “Perfor-
mance evaluation of MIMO channel prediction algor ithms us-
ing measurements,” in Proceedings of the 13th IFAC Symposium
on System Identification, Rotterdam, The Netherlands, August
2003.
[14] T. Ekman and G. Kubin, “Nonlinear prediction of mobile
radio channels: measurements and MARS model designs,”
in Proceedings of IEEE International Conference on Acoustics,
Speech and Signal Processing (ICASSP ’99), vol. 5, pp. 2667–
2670, Phoenix, Ariz, USA, March 1999.
[15] H. L
¨
utkepol, Handbook of Matrices, John Wiley & Sons, Chich-
ester, UK, 1996.
[16] R. O. Schmidt, “A signal subspace approach to multiple emit-
ter location and spectral estimation,” Ph.D. dissertation, Stan-
ford University, Stanford, Calif, USA, November 1981.
[17] A. J. Barabell, “Improving the resolution performance of
eigenstructure-based direction-finding algorithms,” in Pro-
ceedings of IEEE International Conference on Acoustics, Speech
and Signal Processing (ICASSP ’83), vol. 1, pp. 336–339,
Boston, Mass, USA, May 1983.
[18] R. Kumaresan, L. L. Scharf, and A. K. Shaw, “An algorithm for
pole-zero modeling and spectral analysis,”
IEEE Transactions
on Acoustics, Speech, and Signal Processing, vol. 34, pp. 637–
640, 1986.
[19] R. Roy, A. Paulraj, and T. Kailath, “ESPRIT—a subspace rota-
tion approach to estimation of parameters of cisoids in noise,”
IEEE Transactions on Acoustics, Speech, and Signal Processing,
vol. 34, no. 5, pp. 1340–1342, 1986.
[20] M. Haardt and J. A. Nossek, “Unitary ESPRIT: how to obtain
increased estimation accuracy with a reduced computational
burden,” IEEE Transactions on Signal Processing, vol. 43, no. 5,
pp. 1232–1242, 1995.
[21] S. M. Kay, Fundamentals of Statistical Signal Processing, Esti-
mation Theory, Prentice-Hall, Upper Saddle River, NJ, USA,
1993.
[22] P. Stoica and T. S
¨
oderstr
¨
om, “Statistical analysis of MUSIC and
subspace rotation estimates of sinusoidal frequencies,” IEEE
Transactions on Sig nal Processing, vol. 39, no. 8, pp. 1836–1847,
1991.
[23] P. Tichavsky, “High-SNR asymptotics for signal-subspace
methods in sinusoidal frequency estimation,” IEEE Transac-
tions on Signal Processing, vol. 41, no. 7, pp. 2448–2460, 1993.
Ming Chen et al. 13
[24] H. Akaike, “Fitting autoregressive models for prediction,” An-
nals of the Institute of Statistical Mathematics, vol. 21, pp. 243–
247, 1969.
[25] J. Rissanen, “Modeling by shortest data description,” Automat-
ica, vol. 14, no. 5, pp. 465–471, 1978.
Ming Chen received the B.Eng. degree in
computer communications in 1995 from
Xi’an University of Electronics Science and
Technology, Xi’an, China. In 2001 and 2005,
he received the M.S. degree and the Lic.
degree in signal processing, respectively,
both from Chalmers University of Tech-
nology, G
¨
oteborg, Sweden. Currently he
is a Ph.D. candidate at Signal Processing
Group, Chalmers University of Technology,
G
¨
oteborg, Sweden. From 1996 to 1999, he was a technical repre-
sentative at Allgon System AB, Beijing Office, Beijing, China. From
1999 to 2000, he was an STINT (Swedish Foundation for Interna-
tional Cooperation in Research and Higher Education) scholar for
studying at Chalmers. From 2001 to 2004, he was a Research En-
gineer at Ericsson Research, Stockholm, Sweden. His current re-
search interests include signal processing in wireless communica-
tions, channel estimation and channel prediction for MIMO sys-
tems, channel modeling, and mobile positioning.
Tor bj
¨
orn Ekman wasborninV
¨
aster
˚
as,
Sweden, in 1969. He received the M.S. de-
gree in engineering physics in 1994 and
the Ph.D. degree in signal processing in
2002, both from Uppsala University, Upp-
sala, Sweden. Currently, he is an Associate
Professor with the Department of Electron-
ics and Telecommunications at the Nor-
wegian University of Science and Technol-
ogy (NTNU) in Trondheim, Norway. From
1997 to 1998 he was a visiting scientist at the Institute of Commu-
nications and Radio-Frequency Engineering, Vienna University of
Technology, Vienna, Austria, on a Marie Curie Grant. From 1999 to
2002, he was visiting the Digital Signal Processing Group, Univer-
sity of Oslo, Oslo, Norway. In 2002–2005, he made his postdoctoral
studies at UniK, University Graduate Center, Kjeller, Norway. His
current research interests include signal processing in wireless com-
munications, scheduling of radio resources, and dynamic model-
ing, and prediction of radio channels.
Mats Viberg received the Ph.D. degree in
automatic control from Link
¨
oping Univer-
sity, Sweden, in 1989. During 1989–1992,
he was an Assistant Professor in Link
¨
oping
University and in 1992–1993, he held visit-
ing scholarships at the Information Systems
Laboratory, Stanford University, and the
Department of ECE, Brigham Young Uni-
versity, USA. He was appointed Full Profes-
sor at Chalmers University of Technology,
Sweden, in 1993, and during 1999–2004, he served as the Head
of the Department of Signals and Systems. His research interests
are in statistical signal processing and its var ious applications, in-
cluding sensor array signal processing, system identification, wire-
less communications, radar systems, automotive signal processing,
and landmine detection. He has received 2 Paper Awards from the
IEEE Signal Processing Society (1993 and 1999, resp.), and was the
Chair of the IEEE SP Society’s Technical Committee on Signal Pro-
cessing Theory and Methods 2001–2003. He served as an Asso-
ciate Editor of the IEEE Transactions on Signal Processing 2004-
2005, and currently he is a Member of the IEEE SP Awards Board
(2005 up todate), and the IEEE SP Technical Committee on Sensor
Array and Multichannel from 2006 until now. He is a Fellow of the
IEEE.